
APPENDIX
A
Basic Information on Census Questionnaires
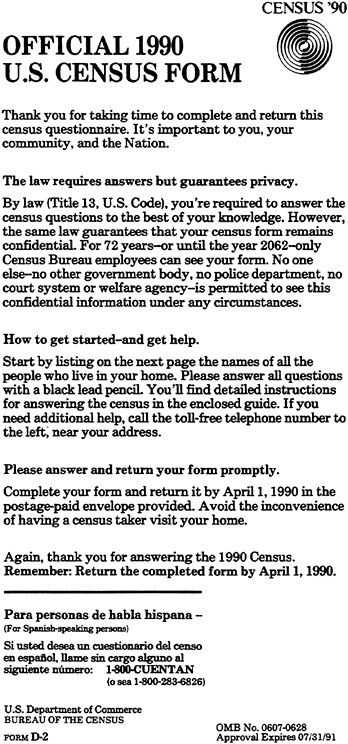
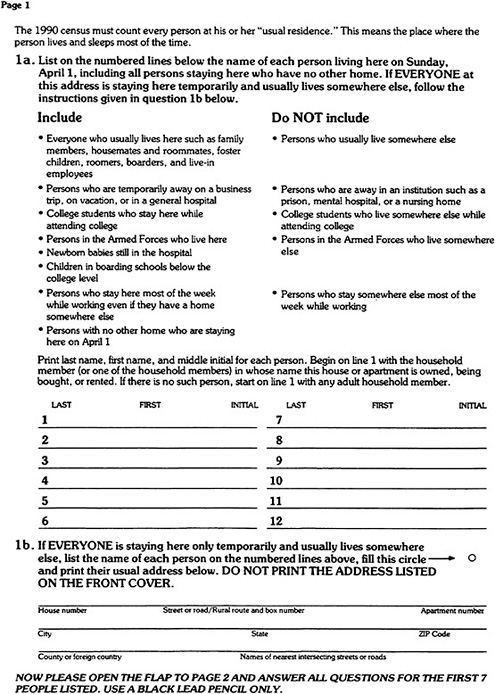
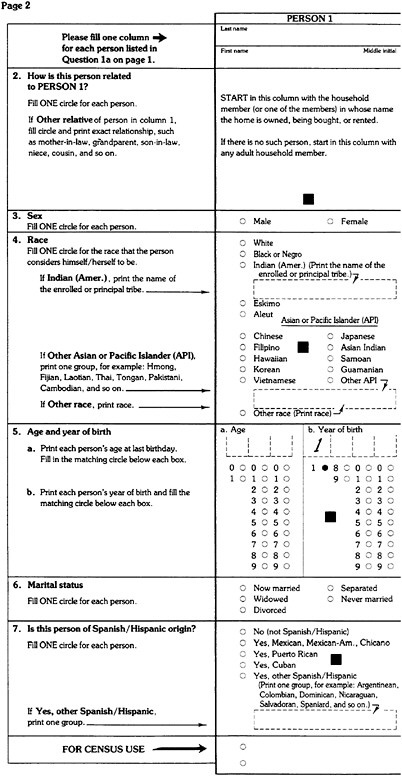
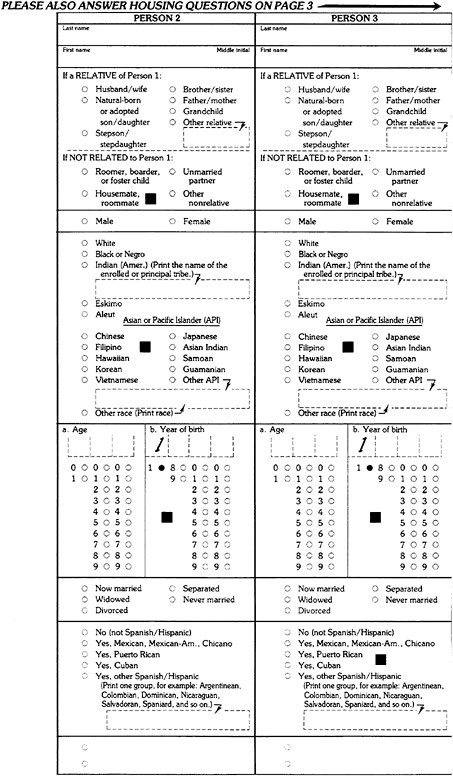
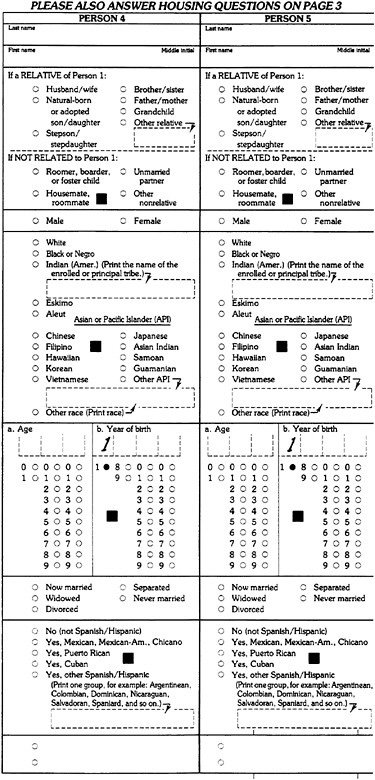
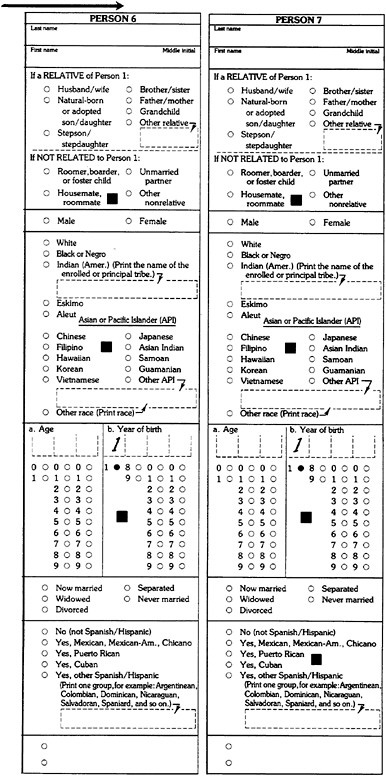
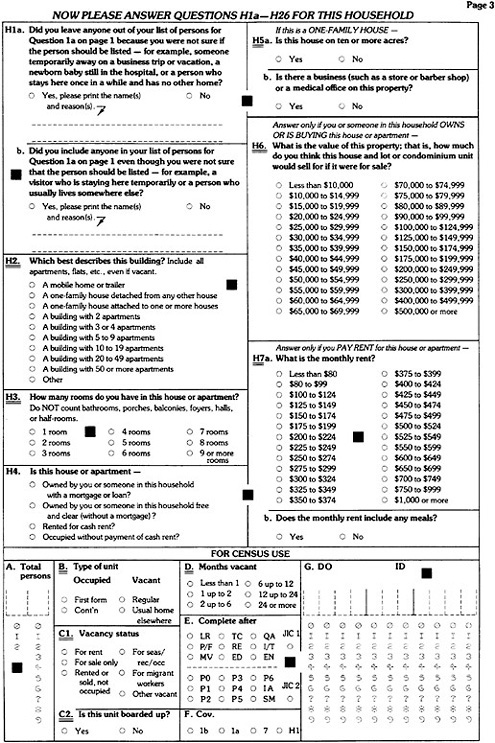
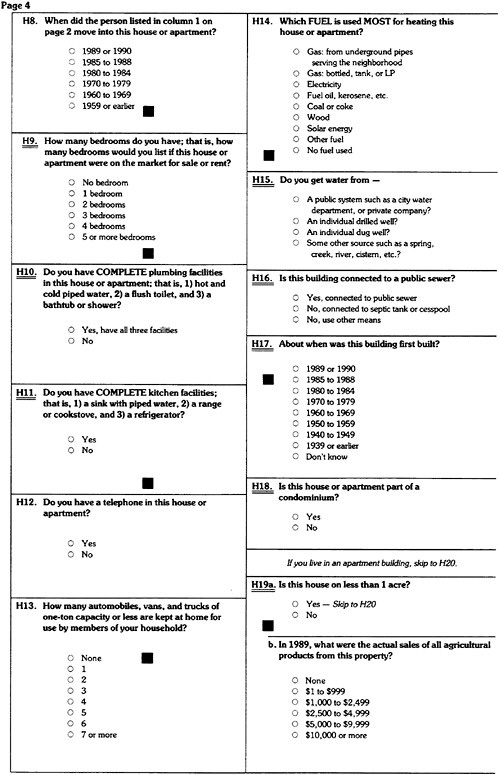
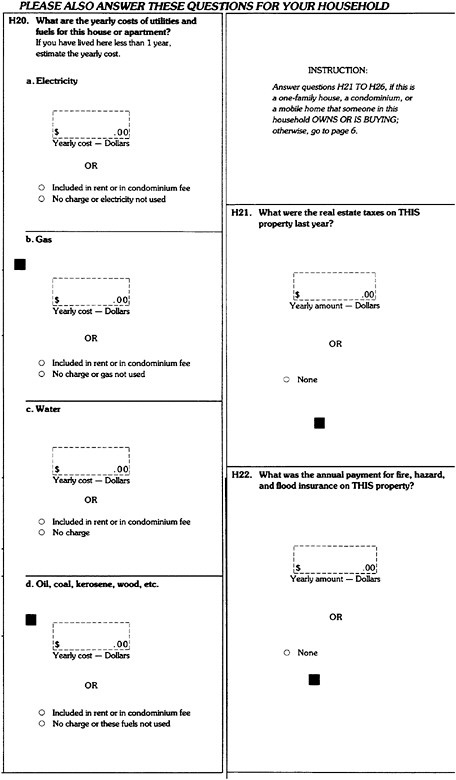
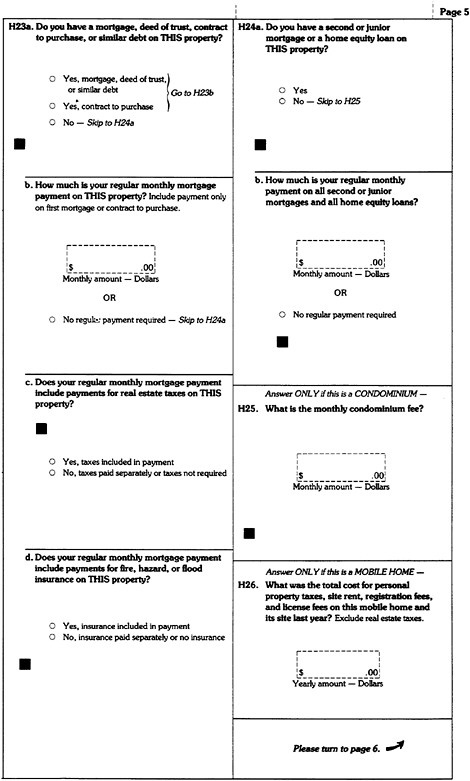
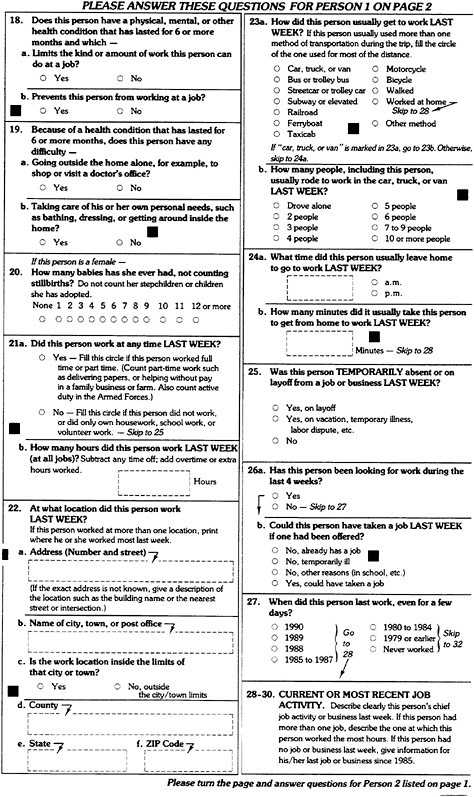
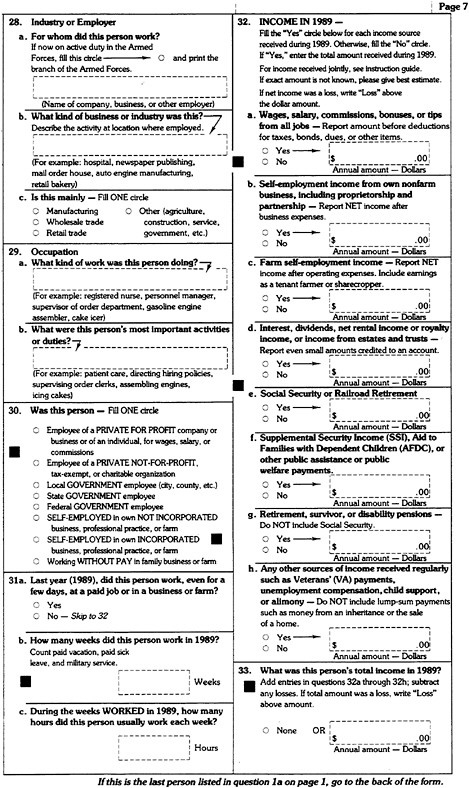
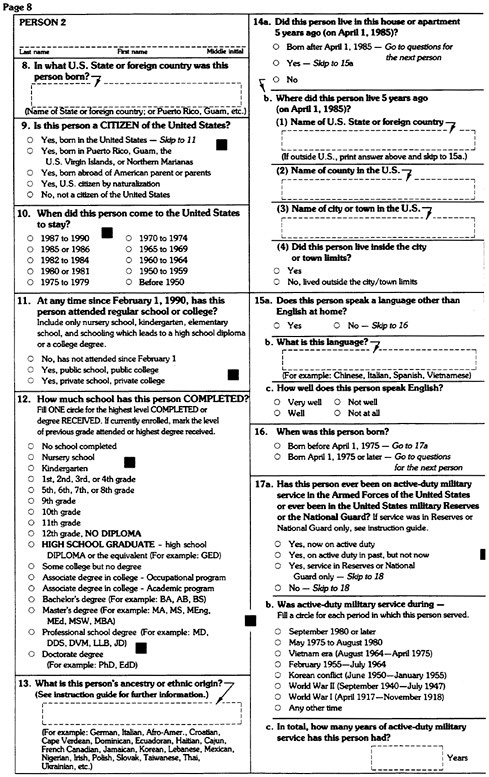
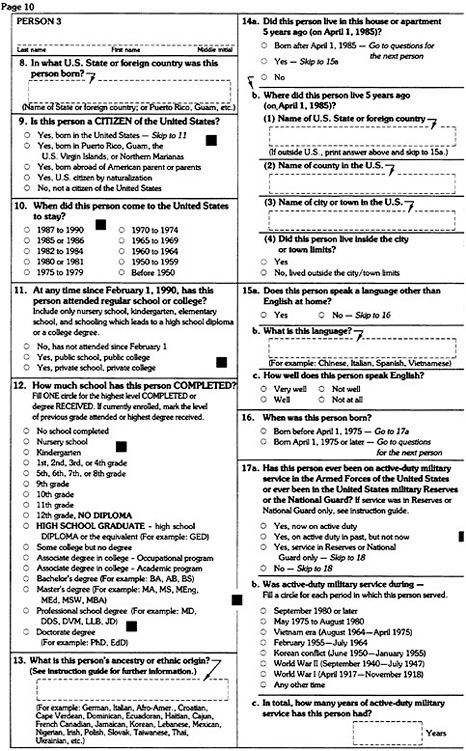
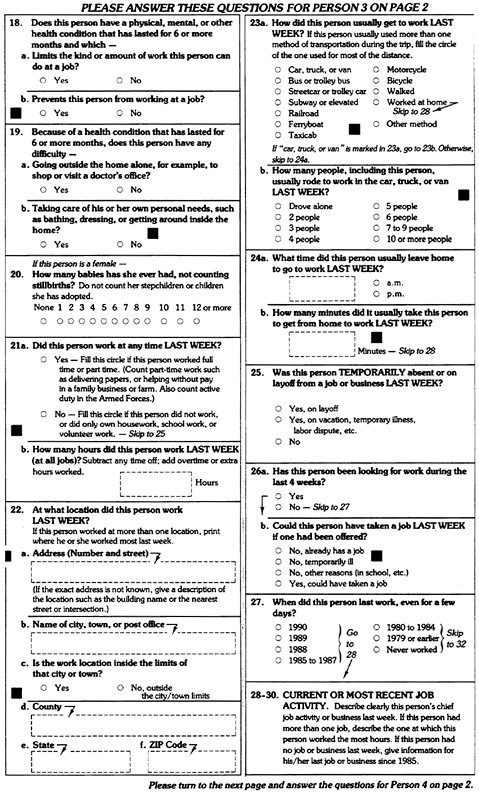
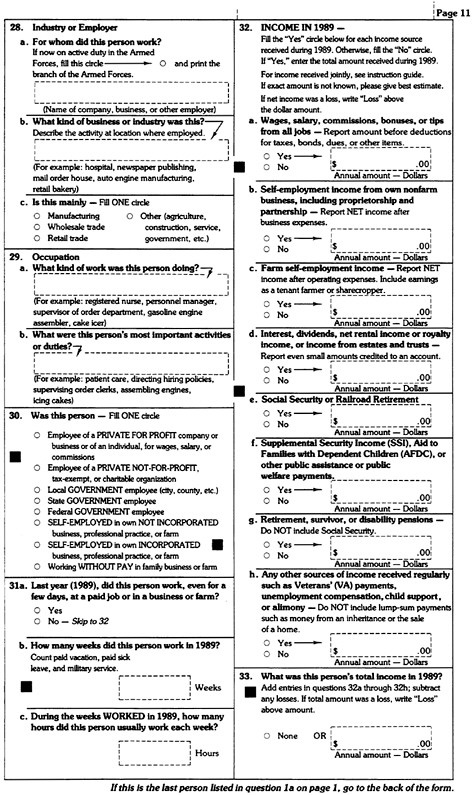
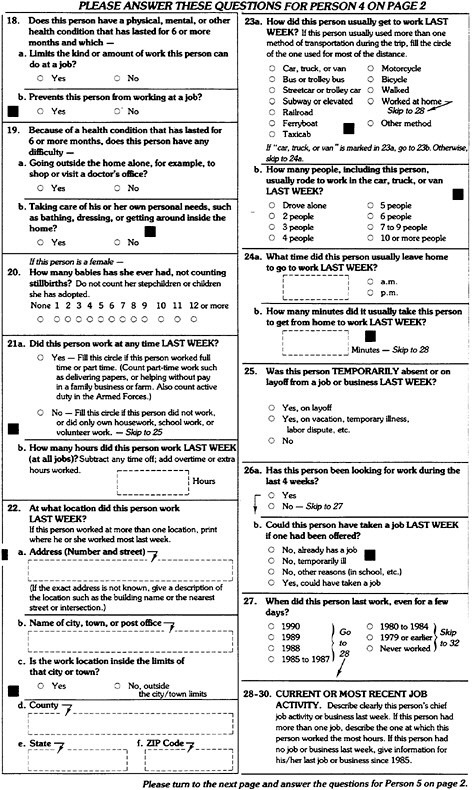
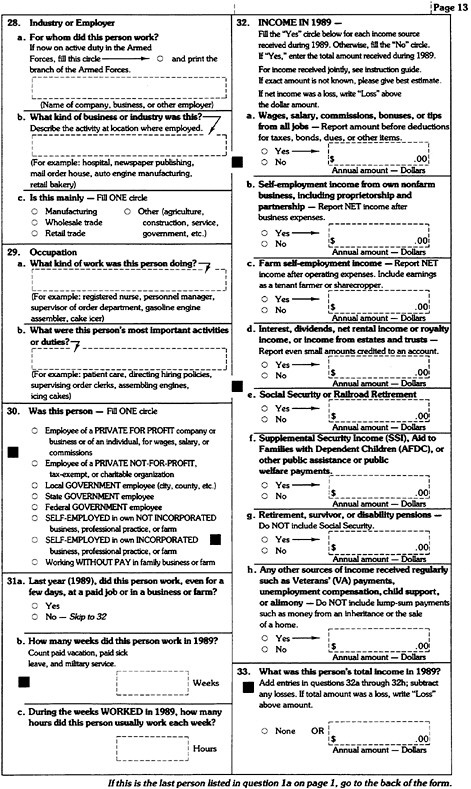
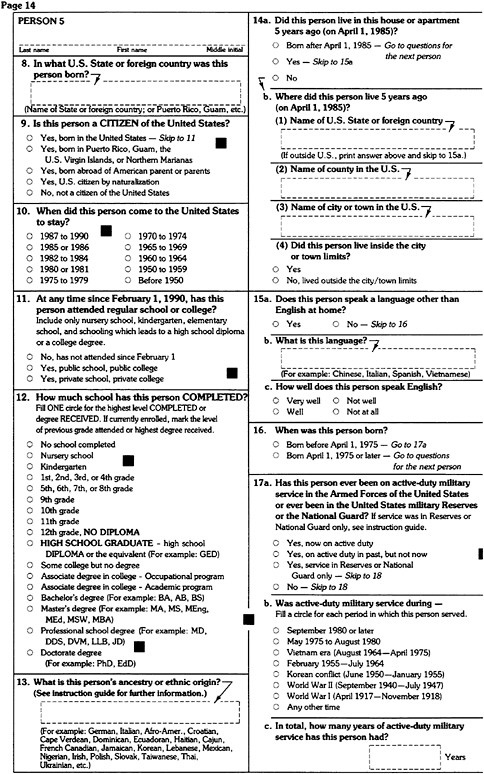
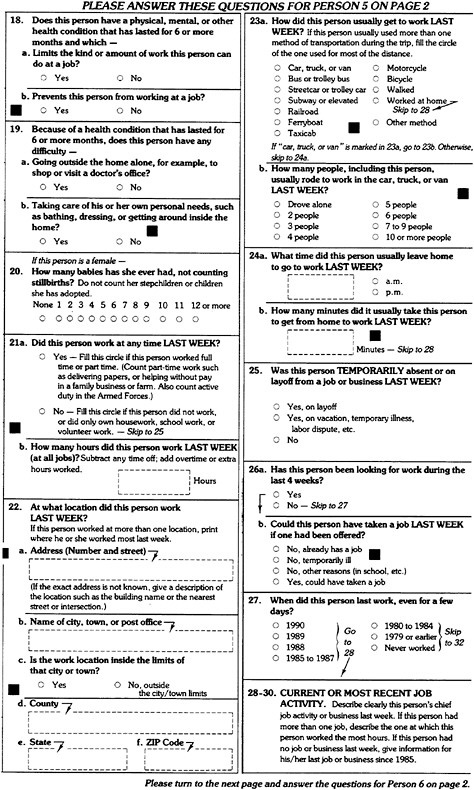
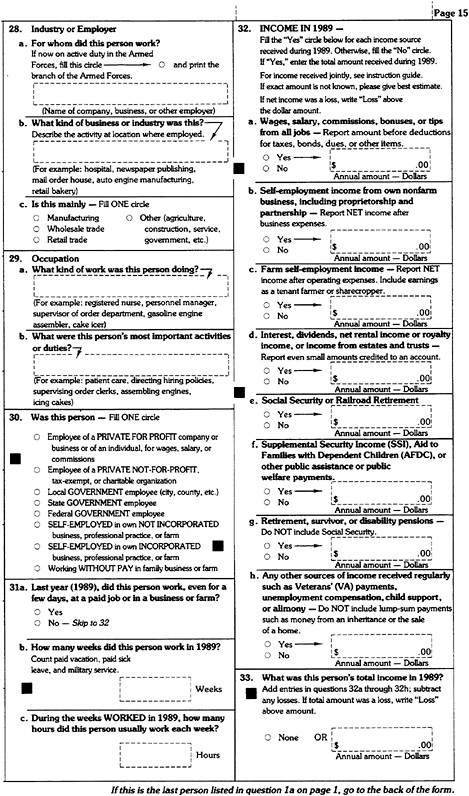
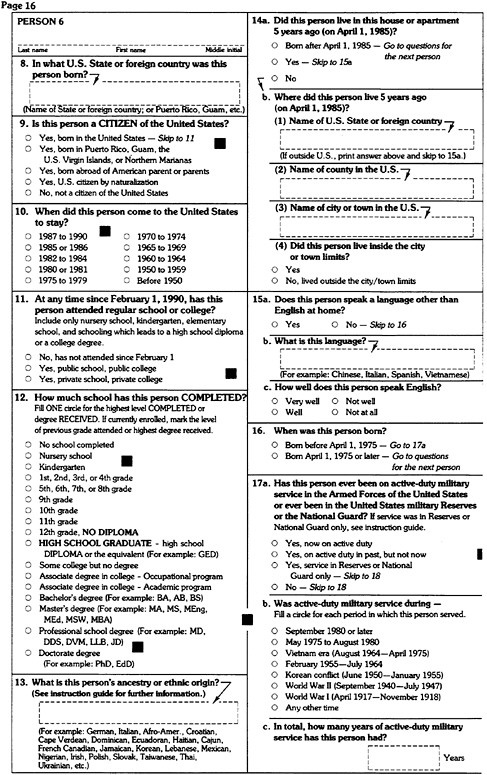
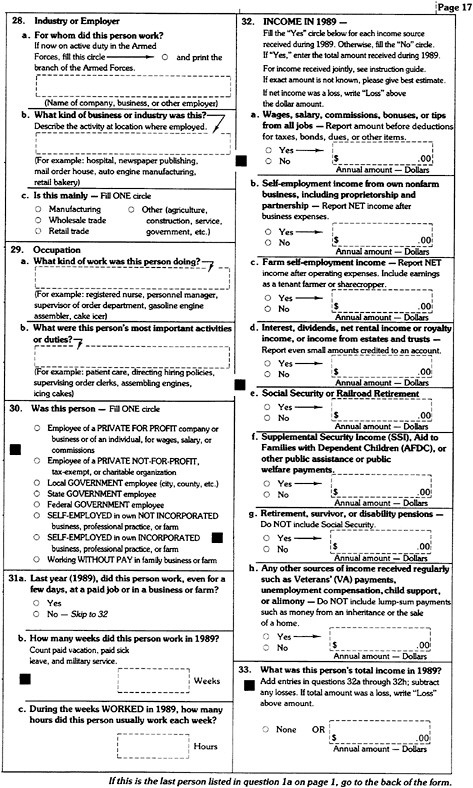
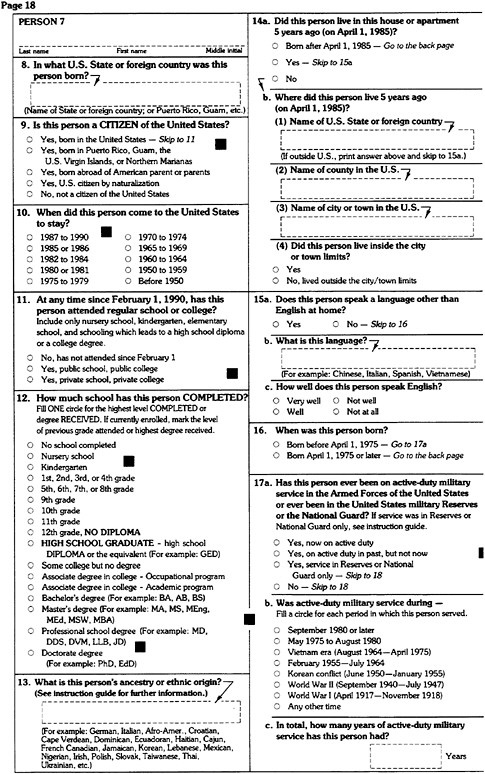
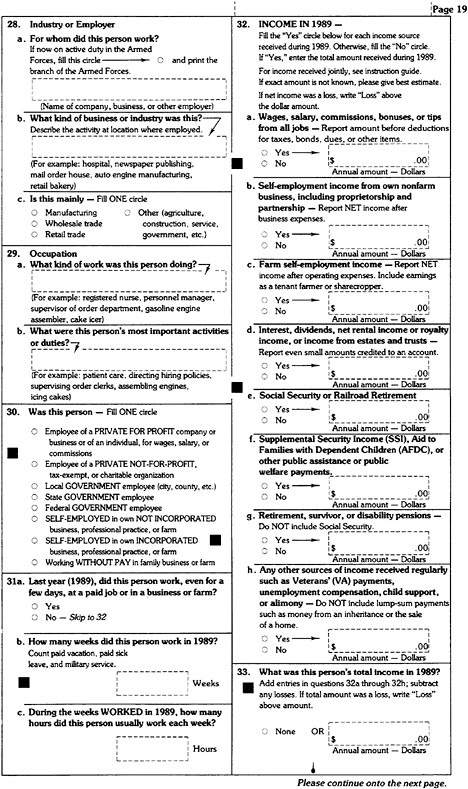
This appendix summarizes information on the content of the decennial censuses, 1960-1990. In general, the number of items for which data are obtained in the census and the major content areas have remained about the same over this period. The 1990 long-form questionnaire (which includes the short-form questions) is shown in Figure A.1 (although the dimensions of the census form have been altered to fit into this book, the content is the same as on the original form). All households received the short form; a sample of households received the long form. The short form is the first 7 pages and page 32 of Figure A.1. The actual short form delivered to households in 1990 was 4 pages. The appendix also provides information on the number of households receiving and responding to the questionnaires in the 1970-1990 censuses.
SHORT-FORM AND LONG-FORM QUESTIONNAIRE CONTENT
Table A.1 is a summary of total population and housing items asked in the short-and long-form questionnaires. The summary shows great stability in the number of short-form population items, which are limited to basic demographic information. There has been a decline in the number of short-form housing items; hence, the burden of the short form on the population has declined somewhat over time. The number of long-form items (population and housing combined) grew from 49 items in 1960 to 64 items in 1970 and 65 items in 1980, declining to 58 items in 1990 (the Office of Management and Budget played a role in this reduction—see Chapter 6). In the 1970 census, the use of matrix
sampling reduced the burden of the long form on individual households (the 1960 census also used matrix sampling but to a more limited extent).
The table indicates that the burden of the long form has progressively declined in terms of the sampling rate. Twenty-five percent of households were designated to receive the long form in 1960, 20 percent in 1970, 19 percent on average in 1980, and 16 percent on average in 1990. The 1970 census used a type of matrix sampling for both population and housing items: 15 percent of households received a markedly shorter long form, and 5 percent received a longer long form; some items were common to both forms, producing a 20 percent sample for those items.
The 1960 census also employed matrix sampling but to a more limited extent from the perspective of responding households. Different forms were used in large cities of 50,000 or more population and other areas; each contained a couple of questions unique to the form. In addition, in conventionally enumerated areas in 1960 (see below), 20 percent of households were asked one set of housing items by enumerators, and 5 percent were asked another set; some items were asked in common, producing a 25 percent sample for those items. In the remaining areas, however, which covered about 80 percent of households, every household in the 25 percent sample was asked to fill out and mail back a long form with all of the sample questions for the type of place (large city or other). Enumerators then transcribed the answers to computer-readable forms, transcribing the answers for 25, 20, or 5 percent of households, depending on the item (see Table A.2).
Table A.2 lists the various detailed items on the census. The housing portion of the long-form questionnaire no longer includes such items as possession of a washing machine or other appliances. The population portion of the long-form questionnaire, over time, has included more questions on disability and ancestry (although the question on birthplace of parents was deleted after 1970) and fewer on marriage and schooling. The greatest number of questions are related to employment, occupation, and income. For the income question, each added income source (e.g., pensions) is counted as a separate item because the respondent must consciously disaggregate the preceding year's income into component parts
QUESTIONNAIRE RECEIPT AND RESPONSE
Table A.3 lists the total number of both vacant and occupied housing units and the number of occupied housing units (households) in 1970, 1980, and 1990. Total housing units have increased over time from 69 million in 1970 to 102 million in 1990; total households have increased from 64 million to 92 million over the same period. Also shown are the number of households receiving the short and long forms and, for each form type, the number receiving and returning
a form by mail. (Other households were visited by an enumerator to pick up their form.)
Assessing changes over time in the willingness of households to cooperate with the census, specifically, their willingness to mail back a form, is difficult because of changes in methodology.1 The 1960 census was an exploratory attempt at mailback questionnaires and was limited to the long form (for this reason, Table A.3 does not include figures for 1960). The U.S. Postal Service (USPS) delivered unaddressed short forms for households to fill out and wait for enumerator pick-up. At the time of pick-up in areas of the country containing about 80 percent of the housing, enumerators left long forms at every fourth unit (25%) to be completed and returned by mail. (This was termed the two-stage procedure.) In the remaining areas, enumerators obtained answers to the long-form items from every fourth unit at the same time as they picked up the short form. (This was termed the single-stage or conventional procedure.)
In 1970, the USPS delivered questionnaires to addresses on a mailing list developed by the Census Bureau for areas containing about 60 percent of the housing. Four-fifths of housing units received a short form and the other one-fifth received one of two versions of the long form. In these mailout/mailback census areas, about 87 percent of households (occupied housing units) returned a questionnaire. The mail return rate (based on occupied housing units) was 87.8 percent for the short form and 85.5 percent for the long form, a difference of 2.3 percentage points. In the remaining conventionally enumerated areas containing about 40 percent of the housing, households received an unaddressed short form and were then visited by an enumerator who picked up the short form and, at every fifth household (20%), administered one of two versions of the long form.
In 1980, the mailout/mailback census areas covered about 96 percent of the housing. Overall, about 19 percent of housing units received the long form. In places with an estimated population of less than 2,500, the sampling rate was 1 in 2 (50%). In all other areas, it was 1 in 6 (17%). In the mailout/mailback areas, about 81 percent of households mailed back their questionnaire. The mail return rate (based on occupied housing units) was 81.6 percent for the short form and 80.1 percent for the long form, a difference of 1.5 percentage points.
In 1990, the mailout/mailback areas covered about 95 percent of the housing. (In most of these areas, the USPS delivered the questionnaires, but, in some areas, census enumerators made the delivery—see Appendix B.) Overall, about 17 percent of the housing units received a long form. In places (such as counties and incorporated places) with an estimated 1988 population of less than 2,500, the sampling rate was 1 in 2 (50%). Based also on precensus estimates, very populous census tracts (or equivalents) had a sampling rate of 1 in 8 (12.5%). All other areas had a sampling rate of 1 in 6 (17%). In the mailout/mailback areas, 74 percent of households returned their questionnaires. For both long and short forms, mail return rates (based on occupied housing units) were lower for
1990 than 1980. The long form return rate in 1990 was 4.5 percentage points below the short form mail return rate (70.4 percent versus 74.9 percent).
NOTE
|
1 |
For descriptions of census methodology in the 1960, 1970, and 1980 censuses, see Citro and Cohen (1985: Chap. 3); for a description of the 1990 census methodology, see Appendix B. For official mail return rates (based on occupied housing units), see Chapter 6. |
REFERENCE
Citro, C.F., and M.L. Cohen 1985 The Bicentennial Census: New Directions for Methodology in 1990 . Panel on Decennial Census Methodology, Committee on National Statistics, National Research Council. Washington, D.C.: National Academy Press.
TABLE A.1 Questions on the Decennial Census, 1960-1990, Totalsa
|
Questionnaire Item |
1960 |
1970 |
1980 |
1990 |
|
Short-form population items |
5 |
5 |
6 |
6 |
|
Short-form housing itemsb |
12 |
13 |
9 |
7 |
|
Combined short-form items |
17 |
18 |
15 |
13 |
|
Long-form population items |
23 |
37 |
37 |
35 |
|
15% long form |
|
25 |
|
|
|
5% long form |
|
30 |
|
|
|
Long-form housing items |
26 |
27 |
28 |
23 |
|
15% long form |
|
13 |
|
|
|
5% long form |
|
22 |
|
|
|
Combined long-form items |
49 |
64 |
65 |
58 |
|
15% long form |
|
38 |
|
|
|
5% long form |
|
52 |
|
|
|
Grand total short-and long-form items |
66 |
82 |
80 |
71 |
|
On 15% long form |
|
56 |
|
|
|
On 5% long form |
|
70 |
|
|
|
SOURCE: Compiled by staff from reviewing census questionnaires. NOTE: The 1980 and 1990 censuses used one long form with a variable sampling rate depending on the estimated population size of the area; the overall long-form sampling rate was about 19 percent of households in 1980 and 17 percent in 1990. The 1970 census used matrix sampling, with two long forms, one containing items asked of 15 percent of the households and the other containing items asked of 5 percent; some items were common to both forms (producing a 20% sample). The 1960 census also used matrix sampling, but to a lesser extent and with a complex design that is difficult to summarize. A few long-form housing items were asked only in large cities of 50,000 or more; a few other long-form housing items were asked only outside large cities. In addition, in areas using the conventional, single-stage procedure (see text), enumerators asked long-form questions of 25 percent of households overall, but asked some housing questions of only 20 percent of households and other housing questions of only 5 percent. In areas using the two-stage procedure, 25 percent of households were asked to fill out and mail back either the large city or other area questionnaire with all of the long-form items. However, enumerators subsequently transcribed some of the housing items for only 20 percent of households and other housing items for only 5 percent. Hence, the combined number of long-form population and housing items in the 1960 census, from the perspective of households asked to respond, ranged from 40-42 items in conventional areas to 48 items in two-stage areas outside large cities (compared with 49 items in the table). a Totals should not be regarded as exact, as there is some interpretation as to what constitutes a separate item. b Several items on vacant units are omitted because enumerators fill out these items, not household members. |
||||
TABLE A.2 Questions on the Decennial Census: 1960-1990 (S indicates short form; L indicates long form)
|
Questionnaire Item |
1960 |
1970 |
1980 |
1990 |
|
Population items |
|
|
|
|
|
Age (and/or date of birth) |
S |
S |
S |
S |
|
Sex |
S |
S |
S |
S |
|
Race |
S |
S |
S |
S |
|
Hispanic origin |
|
Lb |
S |
S |
|
Relationship to household head |
S |
S |
S |
S |
|
Marital status |
S |
S |
S |
S |
|
Age at or date of first marriage |
L |
Lb |
L |
|
|
Married more than once |
L |
Lb |
L |
|
|
If remarried, was first marriage ended by death? |
|
Lb |
L |
|
|
Number of children ever born to mother |
L |
L |
L |
L |
|
School attendance/education attainment |
L |
L |
L |
L |
|
Public or private school |
L |
L |
L |
L |
|
Vocational training |
|
Lb |
|
|
|
Place of birth (short-form item in New York State in 1960) |
L |
L |
L |
L |
|
Place of birth of mother and father |
L |
La |
|
|
|
Citizenship (short-form item in New York State in 1960 and not asked elsewhere in that year) |
|
Lb |
L |
L |
|
Year of immigration |
|
Lb |
L |
L |
|
Language spoken at home (if born abroad in 1960) |
L |
La |
L |
L |
|
How well English spoken |
|
|
L |
L |
|
Ancestry |
|
|
L |
L |
|
Veteran status/period of service (for men only in 1960 and 1970) |
L |
La |
L |
L |
|
Years of military service |
|
|
|
L |
|
Place of residence 5 years ago |
L |
L |
L |
|
|
Year moved to present residence (see housing item on year household head moved into unit) |
L |
La |
|
|
|
Work disability |
|
Lb |
L |
L |
|
Transportation disability |
|
|
L |
|
|
Disabled for going outside the home alone |
|
|
|
L |
|
Disabled for taking care of personal needs |
|
|
|
L |
|
Duration of disability |
|
Lb |
|
|
|
Employment status |
L |
L |
L |
L |
|
Hours worked in preceding week |
L |
L |
L |
L |
|
Industry |
L |
L |
L |
L |
|
Occupation |
L |
L |
L |
L |
|
Class of worker |
L |
L |
L |
L |
|
Place of work |
L |
La |
L |
L |
|
Means of transportation to work |
L |
La |
L |
L |
|
Commuting time |
|
|
L |
L |
|
Carpooling |
|
|
L |
L |
|
Year last worked |
L |
L |
L |
L |
|
Weeks worked in preceding year |
L |
L |
L |
L |
|
Hours worked per week in preceding year |
|
|
L |
L |
|
Weeks unemployed in preceding year |
|
|
L |
|
|
Activity 5 years ago |
|
L |
L |
|
|
Occupation 5 years ago |
|
Lb |
|
|
|
Industry 5 years ago |
|
Lb |
|
|
|
Class of worker 5 years ago |
|
Lb |
|
|
|
Income from earnings |
L |
L |
L |
L |
|
Income from nonfarm self-employment (nonfarm plus farm self-employment in 1960) |
L |
L |
L |
L |
|
Income from farm self-employment |
|
L |
L |
L |
|
Income from Social Security |
|
L |
L |
L |
|
Income from public assistance |
|
L |
L |
L |
|
Income from interest, dividends, rents |
|
|
L |
L |
|
Income from pensions |
|
|
|
L |
|
All other income |
L |
L |
L |
L |
|
Housing items |
|
|
|
|
|
Tenure—owned or rented |
S |
S |
S |
S |
|
Number of rooms |
S |
S |
S |
S |
|
Units at address |
Sc |
S |
S |
S |
|
Type of property |
Sc |
S |
S |
S |
|
Value (short-form item in large cities, long-form item otherwise in 1960) |
S |
S |
S |
S |
|
Contract rent (short-form item in large cities, long-form item otherwise in 1960) |
S |
S |
S |
S |
|
Does the rent include any meals |
|
|
|
S |
|
Access to unit |
Sc |
S |
S |
|
|
Condominium status |
|
|
S |
L |
|
Condition |
Sc |
|
|
|
|
Water supply |
S |
S |
|
|
|
Toilet facilities |
S |
S |
|
|
|
Bathing facilities |
S |
S |
|
|
|
Complete plumbing facilities |
|
|
S |
L |
|
Kitchen, cooking facilities |
S |
S |
L |
L |
|
Telephone available |
L |
S |
L |
L |
|
Basement |
La |
S |
|
|
|
Utilities |
|
|
|
|
|
Electricity costs (for renters only in 1960 and 1970) |
L |
L |
L |
L |
|
Gas costs (for renters only in 1960 and 1970) |
L |
L |
L |
L |
|
Water costs (for renters only in 1960 and 1970) |
L |
L |
L |
L |
|
Oil, coal, etc. costs (for renters only in 1960 and 1970) |
L |
L |
L |
L |
|
Real estate taxes (for owners only) |
|
|
L |
L |
|
Homeowners insurance |
|
|
L |
L |
|
Whether have mortgage |
|
|
L |
L |
|
Mortgage payment (whether includes taxes and insurance) |
|
|
|
|
|
Whether have second mortgage |
|
|
L |
L |
|
Payment for second mortgage(s)/loans |
|
|
|
L |
|
Condominium or mobile home fee |
|
|
|
L |
|
Farm residence/sales of farm products (asked only outside large cities in 1960) |
L |
L |
L |
L |
|
Second home |
|
Lb |
|
|
|
Year structure built |
L |
L |
L |
L |
|
Year household head moved into unit (replaced pop. item on year moved in) |
|
|
L |
L |
|
Number of units in structure |
L |
L |
|
|
|
Whether home mobile or fixed |
L |
|
|
|
|
Number of stories |
|
Lb |
L |
|
|
Elevator (asked only in large cities in 1960 combined with question on number of stories) |
La |
Lb |
L |
|
|
Number of bathrooms |
La |
La |
L |
|
|
Number of bedrooms |
Lb |
Lb |
L |
L |
|
Source of water (asked only outside large cities in 1960) |
La |
La |
L |
L |
|
Sewage disposal (asked only outside large cities in 1960) |
La |
La |
L |
L |
|
Heating equipment |
L |
L |
L |
|
|
Heating fuel |
Lb |
Lb |
L |
L |
|
Cooking fuel |
|
Lb |
L |
|
|
Water heating fuel |
|
Lb |
L |
|
|
Radio sets (battery-operated only in 1970) |
Lb |
Lb |
|
|
|
Clothes washer |
Lb |
Lb |
|
|
|
Clothes dryer |
Lb |
Lb |
|
|
|
Home food freezer |
Lb |
Lb |
|
|
|
Air conditioning |
Lb |
La |
L |
|
|
Television sets |
Lb |
Lb |
|
|
|
Whether television equipped for UHF |
|
Lb |
|
|
|
Dishwasher |
|
Lb |
|
|
|
Automobiles (20% item in large cities, 5% item outside large cities in 1960) |
La |
L |
L |
|
|
Vans or trucks |
|
|
L |
|
TABLE A.3 Number of Households Receiving the Census Questionnaires, 1970, 1980, and 1990, in millions
|
|
1970 |
1980 |
1990 |
|
Total number of housing unitsa |
68.7 |
88.4 |
102.3 |
|
Total number of householdsb |
63.5 |
80.4 |
91.9 |
|
Number of households receiving short form |
51.0 |
65.6 |
76.2 |
|
Households receiving short from for mailbackc |
31.2 |
62.8 |
70.9 |
|
Households returning short form by mail |
27.4 |
51.3 |
53.1 |
|
Number of households receiving long form |
12.4 |
14.8 |
15.7 |
|
Households receiving long form for mailbackc |
7.6 |
14.2 |
13.9 |
|
Households returning long form by mail |
6.5 |
11.3 |
9.8 |
|
SOURCE: This table is based on information in Bureau of the Census memoranda, June 7, June 16, and September 3, 1994, from Florence Abramson to Meyer Zitter and Juanita Tamayo Lott. NOTE: Because of rounding, mail return rates (based on occupied housing units) calculated from this table will not agree exactly with published rates. a The total number of housing units includes both vacant and occupied units. b Households are occupied housing units. The numbers of households receiving the short and long forms in the 1990 census include estimates for 3 million households for which definitive information regarding the type of form is not readily determined. c For the 1970 and 1980 censuses, includes households in the mailout/mailback areas; for the 1990 census, includes households in the mailout/mailback and update/leave/mailback areas. |
|||


page 20
Please make sure you have . . .
-
FILLED this form completely.
-
ANSWERED Question 1a on page 1.
-
ANSWERED Question 2 through 7 for each person you listed in Question 1a.
-
ANSWERED Questions H1a through H26 on pages 3, 4, and 5.
-
ANSWERED the questions on pages 6 through 19 for each person you listed in Question 1a.
Also . . .
-
PRINT here the name of a household member who filled the form, the date the form was completed, and the telephone number at which a person in this household can be called.
-
FOLD the form the way it was sent to you.
-
MAIL it back April 1, or as close to that date as possible, in the envelope provided; no stamp is needed. When you insert your completed questionnaire, please make sure that the address of the U.S. Census Office can be seen through the window on the front of the envelope.
NOTE – If you have listed more than 7 persons in Question 1a, please make sure that you hve filled the form for the first 7 people. Then mail back this form. A census taker will call to obtain the information for the other people.
Thank you veryt much.
|
The Census Bureau estimates that, for the average household, this form will take 43 minutes to complete, including the time for reviewing the instructions and answers. Comments about this estimate should be directed to the Associate Director for Management Services, Bureau of the Census, Washington, DC 20233, Attn: CEN-90, and to the Office of Management and Budget, Paperwork Reduction Project CEN-90, Washington, DC 20503. Please DO NOT RETURN your questionnaire to either of these addresses. Use the enclosed preaddressed envelope to return your completed questionnaire. |


