
4
BIOLOGIC MAKERS OF EFFECT
Biologic markers of effect are perhaps the most important set of markers. Markers of effect permit the early identification of adverse effects of toxic xenobiotic exposure. They constitute the missing link in the continuum of disease development, linking markers of exposure and susceptibility with onset of disease and offering the possibility of detecting disease at the very early stages of development. They offer the most potential for clinical intervention before irreversible effects have occurred. With proper use of such markers, carcinogenesis can be detected before clinically apparent tumors result, and nephrotoxicity can be identified while sufficient kidney function still remains.
This chapter focuses on relatively noninvasive measurements of early genitourinary consequences of human exposure to noxious chemical, biologic, or physical agents. It discusses available markers of renal effects, their limitations, and directions for future work, but it excludes in vitro procedures extensively used for evaluating cytotoxic effects in animals (which is covered in Chapter 5) or for studying mechanisms of nephrotoxicity. It also discusses markers of carcinogenesis that signal tumor development and address other disorders, such as interstitial cystitis.
Our objective here is to identify and evaluate markers of general or specific effects on renal function and integrity. Measurement of these markers is preferably minimally invasive, accurate, and suitable for screening populations at risk. A number of techniques have been developed to assess renal function, but these techniques generally lack the sensitivity and specificity necessary for detecting preclinical disease or are not applicable to large populations. For example, renal biopsy and radioisotopic procedures are not appropriate for screening, and classical clearance procedures are seldom reproducible to within ±10%, even in the laboratory. Compromises have therefore been made with respect to convenience, sensitivity, and invasiveness. The conventional markers are reviewed from this perspective, and newer results from cellu
lar and molecular studies are presented in light of their potential to provide new markers of effect that will be more sensitive to early nephrotoxicity and can be applied widely to at-risk populations. The conventional markers also can play an important role in validating new markers, particularly in people with compromised renal function who are exposed to additional potentially damaging events. The loss of a small number of tubular cells in a person with only minimal residual kidney function can lead to large changes in conventional markers whereas the same loss in a normal person would be undetectable. Such a change, now easily detectable in a compromised person, can be used to validate new markers against conventional markers.
EXTERNAL VISUALIZATION
Several techniques permit external visualization of the kidney and delineation of functional changes. Radiopaque contrast media and ultrasonic agents permit imaging of changes in blood or urine flow or in renal solute accumulation and secretion. Similar results are routinely obtained with gamma-emitting radioisotopes. In addition to the risks associated with radiation exposure, these tests do not reflect subtle changes in renal function and are therefore limited in their applicability to population screening.
A visualization technique that might hold promise and that has been applied to small animals is magnetic resonance imaging (MRI). Acara et al. (1991) observed conspicuously hyperintense regions in renal papillae in rats and related them to early hydronephrotic changes. Further improvements in MRI might make the technique more useful for screening human populations, but it is still time-consuming and expensive.
URINARY CLEARANCE MEASUREMENTS
Direct
Measurement of urinary clearances is not convenient for use in large populations at risk, but it continues to constitute a basic approach to evaluating renal function. Indeed, the introduction of the clearance concept into renal physiology by Moller et al. in 1929 provided for the first time a relatively simple and informative measure of renal function and was a critical contribution to the study of the kidney. Urinary clearance (C) is the virtual volume of plasma that is cleared per unit time by excretion into urine; it is expressed as Cx = Ux V/Px, where Ux V is the amount of substance x excreted per unit time and Px is the plasma concentration of substance x. Depending on the solute chosen, clearances can provide information on glomerular and tubular function; they are useful under many conditions for evaluating functional integrity of the kidney in humans or animals.
The direct measurement of clearance, however, has disadvantages, especially for the study of large populations. It is clear from the formula Cx = Ux V/Px that it is essential to keep Px constant during the clearance period or at least to be able
to calculate the mean plasma concentration of the chosen solute. For exogenous solutes, such as inulin (often used to evaluate renal function), this requirement is best met by continuous intravenous infusion of I hour or longer, but it can at times be approximated by subcutaneous or intramuscular depot injection. In either case, blood has to be sampled repeatedly to ensure the required constancy of P. The procedure is simplified by reliance on an endogenous solute, such as creatinine, which is usually produced in the body at a constant rate and normally excreted almost entirely by glomerular filtration. Creatinine clearance can be a measure of glomerular filtration rate. Clearance of endogenous urea has also been used to evaluate glomerular function, but it suffers from the double disadvantage of less-constant plasma concentration than that of creatinine and substantial influence by urinary flow rate.
The need for accurately timed and complete urine collection presents a second difficulty in clearance procedures. Because of the cumulative errors arising from lack of constant plasma concentrations and from inaccurate timing or incomplete urine collection (and because of analytic errors), clearance determinations are seldom reproducible to within ±10%, even in a laboratory setting. Such low reproducibility might be adequate for many clinical purposes, but it interferes with attempts to demonstrate early changes in the ability of the kidney to excrete a given solute. In addition, early effects of nephrotoxicants might result in diminution of glomerular reserve capacity without changes in overall clearance (as described in Chapter 2). The glomerular reserve capacity reflects the ability to increase the glomerular filtration rate in response to stimuli. A failure to elicit such a response implies the presence of a subclinical disease process.
Total functional reserve capacity of the kidney can be measured by, for example, imposing a stress, such as ingestion of a high-protein meal. The increase in creatinine clearance during pregnancy can also reflect functional reserve capacity. For tubular secretion or reabsorption, total capacity is evaluated at saturating levels of a test solute, in which case secretion is expressed as excreted load minus filtered load, whereas reabsorption is calculated as filtered load minus excreted load. These techniques require determination of the glomerular filtration rate (GFR) as well as prolonged infusion of large amounts of solute and therefore are not suitable for routine screening.
Direct clearance measurement takes place primarily in the laboratory or special clinic. It can be simplified in some cases by use of radioisotopes, but this is not appropriate for general screening. It would be useful if convenient and sensitive chemical procedures could be developed for such compounds as chromium ethylenediaminetetraacetic acid (Cr-EDTA) and iodothalamate, both good solutes for measurement of GFR but so far used only in the radiolabeled form.
Indirect
A number of indirect measures of
renal clearance have been proposed. They are generally simple but lack sensitivity and precision, as can be illustrated by reference to the formerly extensively used measurement of the rate of excretion of a chemical after injection of a standard dose of some substance. For instance, the dye phenol red (PSP) is excreted by tubular secretion, and the rate of its recovery in urine is therefore controlled by independent variables, such as renal plasma flow, the integrity of tubular transport mechanisms, and a linear dependence of the rate of transport on plasma concentration of the dye at the dose used. Measurement of fractional excretion of a standard dose of PSP over 15 or 30 min can yield little information on specific aspects of renal function.
A more commonly used indirect method measures the declining slope of plasma concentration of an injected solute after a suitable equilibration period. An example is the estimation of GFR with iodothalamate.
Another indirect measurement of urinary clearance is based on the assumption that creatinine is filtered and excreted at a constant rate. Even in the presence of diurnal variations in GFR, normalizing urinary concentrations of a specified substance by the urinary concentration of creatinine permits conclusions to be drawn from spot urine samples and avoids the difficulty of obtaining 24-hour collections. Any deviation of a solute-to-creatinine concentration ratio from normal is equated to a corresponding change in the clearance of this solute. Normalization can also be achieved on the basis of total urine concentration as reflected in its specific gravity, with the empirically derived mean value of 1.018 as a reference point. Because GFR undergoes diurnal variation, spot samples should be collected at the same time each day. It must be kept in mind that specific lesions cannot always be blamed for a change in fractional excretion. For instance, the fractional excretion of filtered sodium normally falls below 1%. If GFR becomes depressed for any reason, maintenance of normal sodium excretion in the face of a reduced filtered load necessitates an increased fractional excretion.
In selected cases, clearance values can be computed indirectly from analysis of serum. The solutes most commonly studied in this manner are creatinine and urea. Creatinine is synthesized and excreted at an approximately constant rate. It follows that its steady-state concentration in plasma will vary indirectly with GFR. The agreement between measured creatinine clearance and that predicted from plasma creatinine concentration shows considerable variation. The predicted creatinine clearance is based on the formula Ccr = [(140-age in years) (weight in kg)]/72Scr' where C is in milliliters per minute and S in milligrams per deciliter (Cockroft and Gault, 1976), for men. For women, 85% of the value is chosen. Both may be expressed in terms of body weight or body surface area. Blood urea has been similarly used as an indicator of glomerular function, but variations in the rate of urea synthesis and tubular reabsorption render it unsuitable for quantitative
purposes. Attempts have also been made to use plasma concentrations of beta2-microglobulin to measure GFR; this is further considered in the next section. All these methods are of qualitative, rather than quantitative, use.
URINALYSIS
Toxic injury to the kidney can involve any of the tissue compartments of the urinary tract. Ultimately, the products of such injury—whether sloughed necrotic renal epithelial cells themselves or the products of the functional, inflammatory, and reparative responses that the injury provokes—find their way into the urine. Simple urinalysis remains perhaps the most useful screening test for the detection of renal injury in large populations. Changes in urinary excretion of numerous solutes have been suggested as markers of exposure and effect. Bowers et al. (1992), for instance, showed that urinary porphyrin can serve as a marker of mercury accumulation and nephrotoxicity. It is unlikely, however, that porphyrin analysis provides more information than some of the simpler tests routinely performed.
Total Urinary Solute Concentration
In almost all cases of nephrotoxic injury, an early and reliable marker is the failure of the kidney to excrete concentrated urine. The failure is caused by the inability of the damaged kidney to generate and maintain a high osmolar concentration in the renal papilla. The two routine tests of this capacity are the urinary specific gravity (SG) and osmolality.
Urinary SG correlates well with the osmolar concentration with some exceptions. Normally, urinary SG exceeds 1.020 after overnight water deprivation, and values below 1.015 indicate a concentration defect. Care must be taken to correct the determined values for abnormally high glucose or protein concentrations. SG can be determined directly with a hydrometer. Indirect, easy-to-use measurements are gaining acceptance. The most common of these is based on the change in ionization of a polyelectrolyte as a function of the ionic strength of urine; the resulting change in pH is noted with a dipstick.
Osmolality can be measured with vapor-pressure osmometry or freezing-point depression. In the United States, subjects ingesting a normal diet excrete urine of up to around 900–1,200 mOsmol/L. By comparison, the osmolality of plasma is 280 mOsmol/L. In chronic renal disease or after acute toxic injury, the ability to concentrate urine maximally is impaired; and with severe injury, the maximal urine osmolality approaches that of plasma.
Dipsticks
Dipsticks have found extensive use for evaluation of urinary pH and the presence of proteins, glucose, hemoglobin, and bile pigments.
-
pH. This is not greatly affected by most renal diseases, and the ability to acidify urine maximally is preserved even in severe forms of renal dysfunction. However, some forms of renal injury are associated with defects in acid excretion. Such so-called tubular acidosis can be induced by some xenobiotics, by solvents and metals, and by obstruction of the urinary tract. Urine excreted in cases of lead, cadmium, and toluene toxicity might be alkaline. The samples should be collected after overnight water deprivation to avoid the alkaline pH produced by stimulation of gastric HCl production.
-
Proteinuria (discussed in detail later). The colorimetric reagent strip of most dipsticks uses tetrabromphenol blue for the semiquantitative detection of protein. The test is more sensitive for albumin than for other urinary proteins, and its sensitivity is greatly diminished at high pH.
-
Glucosuria. Like proteinuria, glucosuria generally accompanies acute renal injury after exposure to nephrotoxicants. The glucose oxidase reagent is highly specific for glucose.
-
Hematuria. Presence of hemoglobin (or large amounts of myoglobin) is readily demonstrated. The presence of red blood cells in the urine is abnormal. It does not necessarily reflect renal lesions themselves, inasmuch as diseases in any portion of the urinary tract can lead to this finding.
-
Bile pigments. Nephrotoxicants often damage liver and red-cell membranes, so bilirubin and urobilinogen are important indicators of liver injury. Because bilirubin is unstable and light-sensitive, samples should be stored in the dark.
Microscopic Analysis
Little information is usually gained from microscopic examination of urinary sediment if chemical analysis had negative results. In large screening studies, microscopic examination of urine should be reserved for urine samples whose chemical screens were positive. First morning specimens, which are highly concentrated, as opposed to those passed later in the day, are not useful for this purpose, because cells rapidly deteriorate in hypertonic bladder urine. Therefore, freshly voided samples should be used only after partial hydration, which will result in a lower urine specific gravity. Preservatives can be added to ensure the integrity of cellular elements. This preservation will be especially important when more sophisticated techniques—such as immunocytology, in situ hybridization, and polymerase chain reaction (PCR), are introduced to examine these specimens (see the next major section, on markers of cytotoxicity). Formaldehyde-releasing tablets are now available as a preservative, but all preservatives might interfere with routine tests. For example, false-positive results for protein and glucose have been observed after addition of the preservatives thymol and formalin, respectively.
Preparation of the sediment should be standardized. Most commonly, 15 ml of urine is spun at 2000 g for 5 min. The supernatant is partially decanted and the
sediment resuspended in 1 ml of supernatant. In such a preparation, the normal concentration of red cells and white cells is 1-2 cells per high-power field. The presence of casts, which can be formed especially at high salt concentrations in acidic urine, reflects injury to the glomerular capillary wall (in the case of red-cell casts) or tubules; the presence of granular and hyaline casts probably depends on the combined effects of tubular epithelial damage, inflammatory reactions, and abnormal protein excretion and aggregation.
Study of urinary cells is discussed in greater detail in the next major section. Normal urine specimens can contain epithelial cells and cells of the pelvic, ureteral, bladder, and urethral epithelium that cannot be distinguished by routine light microscopy. Some inflammatory cells can also found. A recent study by Mandal (1986) failed to identify tubule cells in normal urine with electron microscopy. Under pathologic conditions, cell identification requires a variety of techniques to identify phenotypic markers. Granular casts, consisting of contents of disintegrated cells, and Tamm-Horsfall protein (see the next section) are commonly found in the urine from patients with acute renal failure (ARF), and acute or chronic tubulointerstitial disease. Muddy-brown casts, coarsely granular casts, red cells and casts, and white cells are all associated with ARF. Their presence correlates with the degree of damage, so mild cytotoxicity is accompanied by few urinary abnormalities. However, major renal impairment can be present in acute interstitial nephritis with little or no abnormality of the urinary sediment. Acute interstitial nephritis with prominent peripheral eosinophilia can lead to the presence of eosinophils in urine.
Proteinuria
Under normal circumstances, the glomerular capillary wall provides a barrier to the filtration of protein. Permeation of the glomerular basement membrane by proteins is influenced by the size, charge, and rigidity of individual protein molecules. Small uncharged molecules, such as horseradish peroxidase, pass freely into the urinary space. Negatively charged molecules of intermediate size, such as albumin, are impeded at the endothelial-cell surface and the proximal layers of the glomerular basement membrane. Uncharged or positively charged molecules, such as myeloperoxidase, permeate the glomerular basement membrane and are retarded at the slit diaphragm of epithelial cells. The net effect of those properties is to exclude relatively large, negatively charged, and rigid proteins from passage into the urinary space. Thus, although albumin and gamma globulin account for the preponderance of serum protein in normal humans (5.0 and 1.5 g/dL, respectively), less than 60 mg and 20 mg, respectively, is excreted in the urine daily. Serum proteins that weigh less than 20,000 daltons (low-molecular-weight proteins) and peptide hormones contained in plasma pass readily into the urinary space, but almost the entire
filtered load is later reclaimed in the proximal tubule.
Measurement of Urinary Protein
The urinary dipstick is the most common device for semiquantitative measurement of urinary protein. Although it can detect protein concentrations as low as about 10–15 mg/dL, it is relatively insensitive and unreliable at concentrations below 30 mg/dL, yielding negative or trace-positive results in more than half such samples tested (Rennie and Keen, 1967). Although the test is sensitive to small quantities of negatively charged proteins, such as albumin, it is insensitive to positively charged proteins, such as some immunoglobulin light chains, and to Tamm-Horsfall protein. Low-molecular-weight proteins (which are less negatively charged than albumin), even when present in abnormal amounts, do not usually reach a concentration high enough to give a clearly positive test result.
Urinary protein can also be estimated with precipitation. Urinary protein is precipitated either by adding 5% sulfo-salicylic acid, 10% trichloroacetic acid, or concentrated nitric acid to the urine or by heating the urine and adding 5% glacial acetic acid. Those methods detect positively charged proteins, as well as albumin, but they have the same limitations as the dipstick test in quantifying total protein; that is, small amounts of protein might not be detected in dilute urine, and normal amounts of protein might be detected in concentrated urine. For mass screening purposes, precipitation tests offer little advantage over the dipstick method and are more difficult to perform. Neither dipstick tests nor precipitation tests are useful in testing for abnormal low-molecular-weight proteinuria.
Neither the dipstick methods now in use nor the usual qualitative tests for acid precipitation of protein are sensitive enough to function as reliable screening tests for the detection of borderline or low concentrations of proteinuria (200–500 mg/g of creatinine) in random urine samples. For example, the sample sensitivity of two dipstick methods was less than 50% in consecutively acquired specimens, and the negative predictive value, or the ability to establish the absence of proteinuria, was only 64–69% (Allen et al., 1991). Quantitative assessment of protein excretion with measurement of the protein-to-creatinine ratio has been recommended to supplement the dipstick in screening for proteinuria in cases in which misclassification would lead to serious problems (Shaw et al., 1983). Interpretation of borderline positive results for protein in screening examinations is further clouded by the fact that functional proteinuria—elicited by upright posture, by exercise, and even by excitement—is frequently encountered, particularly in adolescents and young adults (Houser, 1987; Houser et al., 1986). Woolhandler et al. (1989) thought that screening healthy, asymptomatic young adults for proteinuria was not helpful, in that population-based studies showed that less than 1.5% of patients with a positive result for protein
on the dipstick test had a serious and treatable disorder of the urinary tract. However, the yield might well be much higher in selected populations, such as hospitalized patients, older subjects, or those exposed to environmental hazards.
Albuminuria
Albumin is a 69-kilodalton polyanionic macromolecule with a Stokes radius of 3.6 nm, and a pI of 4.8. In urine, it is considered a high-molecular-weight protein. Albumin is synthesized in the liver and has a relatively high concentration in the plasma (about 4 g/dL). Because this high concentration of albumin is maintained within the vascular space, it generates so-called ''oncotic pressure'', which prevents fluid from moving into the tissues and causing edema. Albumin is thought to exist almost entirely in monomeric form in biologic fluids. Some albumin is normally filtered by the glomeruli with low-molecular-weight proteins. Filtered protein is primarily reabsorbed in the proximal tubules by brush-border enzymes. Albumin has less affinity for the brush-border enzymes than does the low-molecular-weight protein beta 2-microglobulin. Absorption of beta2-microglobulin averages 99.7%, but that of albumin only 90%. In normal people, the fractional excretion of albumin is about 90 times higher than that of beta2-microglobulin (Peterson et al., 1969). Isolated albuminuria without increased excretion of low-molecular-weight proteins results from change in the glomerular filtration of high-molecular-weight proteins and thus has been termed glomerular proteinuria.
Various mechanisms have been proposed to explain increases in glomerular filtration of albumin. In advanced renal disease, when GFR is 25–30 mL/min, the remaining functional nephrons might have increased perfusion, which could disrupt the cellular integrity of capillary membranes and lead to increased albuminuria (Hostetter et al., 1982). Reduction in the fixed anionic charge of the glomerular filtration barrier enables greater leakage of serum albumin across the glomerular basement membrane. Nephrotic syndrome induced by puromycin aminonucleoside is associated with reduction of glomerular anionic sites (Michael et al., 1970). Conversely, if the serum protein itself is modified to be less negatively charged, it might result in increased filtration, as has been proposed for glycosylated albumin in diabetes (Ghiggeri et al., 1985). In general, then, the clinical finding of isolated urinary excretion of high-molecular-weight proteins, particularly albumin, is seen as a manifestation of disturbances of the glomerular filtration barrier.
Increased excretion of albumin is usually the result of glomerular injury but sometimes is the consequence of reversible hemodynamic changes. Exercise, fever, infusions of epinephrine or norepinephrine, emotional stress, prolonged assumption of the lordotic position, and congestive heart failure are often accompanied by mild to moderate albuminuria. Those stresses amplify the excretion of albumin when albuminuria is already present.
Proteinuria in excess of 1 g/g of creatinine, or 1 g/day in an adult, is almost always indicative of glomerular injury. Excretion of large amounts of abnormal, positively charged immunoglobulin light chains, as in multiple myeloma, constitutes the chief exception to this rule. Although, with the foregoing exception, albumin is always the predominant constituent, proteins of higher molecular weight are excreted in small amounts in proportion to the degree of injury to the glomerular barrier. Thus, in minimal-change childhood nephrosis, in which glomeruli appear normal with light microscopy, virtually no proteins larger than albumin appear in urine, but in inflammatory or infiltrative glomerular diseases, the proteinuria is "nonselective," so urine contains variable amounts of high-molecular-weight plasma proteins, such as immunoglobulin G.
Day-to-day variation of 35–50% in urinary albumin excretion is well documented (Giampetro and Clerico, 1990). Normalizing urinary albumin with creatinine (discussed earlier) can increase the sensitivity and specificity of the test, but it requires a second assay, which increases cost and imprecision. Besides the physiologic factors noted above, various disease states and a number of nephrotoxic agents can increase albuminuria as well.
Microalbuminuria
The standard detectability limits for screening albuminuria are far above the normal range; this decreases the rate of false-positive results and thereby approaches a specificity of 100% but substantially reduces the sensitivity (Steffes et al., 1989). The hallmark of overt diabetic nephropathy is dipstick-positive proteinuria, as seen with "Albustix" (Ames Company). However, by the time the specified albuminuria (250–300 mg/L of urine or 250–300 mg/24 hours) is present, the progression to end-stage diabetic renal failure might be inexorable. In the patient with Type I or insulin-dependent diabetes mellitus (IDDM), once persistent proteinuria of this degree develops, the progression to ESRD is predictable (Konen et al., 1990; Mathiesen et al., 1984). Before clinical (dipstick-positive) proteinuria appears, there is a period of increased albumin excretion not detectable by dipstick (Mogensen, 1987). The small amount of albumin excreted can be conveniently detected with radioimmune assays. This "microalbuminuria" is said by some to be a marker of the likelihood of diabetic nephropathy. However, its prognostic utility in individual cases is uncertain, in that many patients with diabetes and microalbuminuria do not develop dipstick-positive proteinuria even after many years. Microalbuminuria in the absence of hypertension and decreased creatinine clearance does not accurately elucidate the severity of the underlying glomerular lesion in patients with type I diabetes (Chavers et al., 1989).
There has been disagreement regarding the albumin excretion that constitutes microalbuminuria. In 1985, a consensus conference agreed to define microalbuminuria as a urinary excretion
rate (UAER) of greater than 20 μg/min but no higher than to 200 μg/min in an overnight or 24-hour sample (Mogensen et al., 1985–1986). A UAER of 20–200 μg/min is approximately equivalent to 30–300 mg/24 hr or 3–30 mg/mmol creatinine.
Low-Molecular-Weight Proteinuria
Virtually all filtered low-molecular-weight proteins are reabsorbed in convoluted and straight portions of the proximal tubule. Brush-border receptors have a considerably higher affinity for low-molecular-weight proteins than for albumin (which is why the concentration of these proteins in urine is so low), and a high absorptive capacity exists in relation to the normal filtered load for all low-molecular-weight proteins that have been tested (Maack et al., 1985). Nevertheless, with an increase in filtered load, urinary excretion generally increases well before the tubular maximum for absorption is reached (Waldmann et al., 1972).
Because low-molecular-weight proteins are reabsorbed solely and virtually completely in the proximal tubule, their appearance in urine in increased amounts is generally taken to indicate a reduction in proximal tubular function and an early sign of proximal tubular damage. But low-molecular-weight proteinuria can have other causes that lead to increases in the plasma concentration and glomerular filtration of the proteins. An increase in beta2-microglobulin occurs in lymphoproliferative malignancy. An increase in the plasma concentration can also be secondary to renal insufficiency; functional competition for absorption at brush-border sites by charged molecules, such as lysine, arginine, and aminoglycosides; and nonrenal febrile diseases.
One of the important low-molecular-weight proteins in urine is beta 2-microglobulin, whose molecular weight is 11800. For accurate assay results, urine must be made alkaline to prevent hydrolysis of the protein. The protein was isolated in 1968 by Beggard and Bearn from the urine of patients with two conditions characterized primarily by proximal tubular damage: Wilson's disease and chronic cadmium poisoning (Beggard and Bearn, 1968). Urinary beta2-microglobulin has been used often to detect proximal tubular injury in clinical and experimental settings and to test for toxic effects of environmental exposures and antibiotic and chemotherapeutic agents.
Normal adults produce 150–200 mg of beta2-microglobulin a day. It is cleared from the plasma almost completely by the kidney with a half-life of about 2 hours in persons with normal renal function. Serum concentration averages 2.0 mg/ml (range, 1.1–2.7 mg/ml), and the normal urinary excretion is less than 370 μg per day (Schardijn and Statius van Eps, 1987). An increase in beta2-microglobulin production occurs whenever nucleated-cell turnover increases and results, even in the absence of renal malfunction, in raised serum concentration and urinary excretion. When serum beta2-microglobulin exceeds 5 mg/ml, its urinary excretion is invariably high,
which means that the threshold for maximal tubular reabsorption has been exceeded (Bernard et al., 1988).
The same receptor on the brush-border membrane is likely to be involved in the tubular reabsorption of beta2-microglobulin and of albumin; however, the brush-border membrane has far less affinity for albumin than for beta2-microglobulin and other low-molecular-weight proteins. Proximal tubular injury, therefore, results in a disproportionate increase in the excretion of low-molecular-weight proteins like beta2-microglobulin, compared with that of albumin. In contrast, an increase in albuminuria without concomitant increase in urinary excretion of low-molecular-weight proteins signifies an increase in the glomerular filtration of albumin.
The urinary excretion of beta2-microglobulin varies throughout the day in a circadian rhythm, the maximum occurring around midday to early afternoon and the minimum around 4 a.m. (Koopman et al., 1987). This day-night variability must be taken into account when single, spot samples of urine are measured in clinical or epidemiologic surveys.
The normal range of excretion of beta2-microglobulin by adults can be expressed as micrograms of beta2-microglobulin per milligram of creatinine. In adults, the ratio of beta2-microglobulin clearance to creatinine clearance does not change with age (Evrin and Wibell, 1972). Urinary excretion of beta2-microglobulin does not depend on body mass, sex, water load, or moderate physical activity, but it has been shown to increase with furosemide-induced diuresis (Guarnieri et al, 1979; Poortmans and Jeanloz, 1976; Wibel and Karlsson, 1976).
Because most heavy metals accumulate in the kidney, especially in the proximal tubules, beta2-microglobulin excretion has been studied extensively as an early indicator of renal toxicity due to industrial exposure. Cadmium is a common pollutant in industrialized countries. Frank (glomerular) proteinuria has been recognized as a sign of renal dysfunction associated with chronic cadmium toxicity since 1948 (Friberg, 1948), but the earliest sign of cadmium toxicity is tubular proteinuria. The incidence and degree of beta2-microglobulinuria increase with the duration and intensity of exposure to airborne cadmium and with increasing urinary cadmium. Cadmium workers can have beta2-microglobulin excretion 100–1,000 times higher than normal people who have not been exposed. Inhabitants of areas exposed to cadmium in Sweden, Japan, and the United Kingdom had an increase in urinary excretion of beta2-microglobulin related to duration of exposure, dietary cadmium, and urinary cadmium content (Elinder et al., 1985).
Another low-molecular-weight protein excreted in urine is retinol-binding protein (molecular weight, 21400). It is more stable than beta2-microglobulin at acidic pH in urine, and its excretion has therefore been suggested as a practical and reliable test of tubular protein reabsorption.
Finally, alpha1-microglobulin has been proposed for evaluation of tubular func-
tion (Guder and Hofmann, 1991). In healthy adults, alpha1-microglobulin is present in the urine at approximately 20–100 times the normal concentration of beta2-microglobulin and of retinol-binding protein; this circumstance might facilitate its measurement. Like albumin excretion, its excretion increases after exercise, so exercise proteinuria might be tubular, as well as glomerular (Murakami and Kawakami, 1990). The diurnal variation in alpha1-microglobulin excretion is similar to that of beta2-microglobulin, but the changes are less marked than those of albumin. Excretion is usually lower at night than during the daytime.
The usefulness of alpha1-microglobulin was compared with that of urinary N-acetyl-beta-D-glucosaminidase (NAG) and albumin in 409 urine samples sent to a clinical chemistry laboratory for screening. The results were compared with the usual test-strip procedure (for pH, protein, leukocytes, blood, and glucose). Two-thirds of the samples had an abnormal result in at least one test. In this series, alpha1-microglobulin excretion was rarely increased without a simultaneous increase in urinary NAG activity (Hofmann and Guder, 1980).
Alpha1-microglobulin excretion might well be useful in monitoring early signs of renal toxicity after industrial exposures. Its ultimate utility in this field remains to be established.
Brush-Border Proteins
An early event in most forms of ischemic or toxic injury to the kidney is sloughing of the brush border of proximal tubules, particularly in the straight portion (S3) in the outer medulla and in the medullary rays of the cortex (Chewing and Swaminathan, 1989). Appearance of specific brush-border proteins in the urine might therefore be a sensitive early test for renal damage, and monoclonal antibodies that react specifically with such proteins have been developed (Birk et al., 1991). Examples of such tests include those for adenosine deaminase-binding protein (Birk et al., 1991), Na+-D-glucose cotransporter protein (Birk et al., 1991), intravillus brush-border proteins (Birk et al., 1991), and the intestinal type of alkaline phosphatase (Verpooten et al., 1989). Those techniques, as yet experimental and therefore expensive, have great promise because of their inherent specificity and sensitivity. They have yet to be applied to large populations in screening tests, and their practicality in comparison with other measures of proximal tubular damage, such as enzyme excretion, remains to be determined.
Tamm-Horsfall Protein
The so-called Tamm-Horsfall protein (THP) has been found to be the most abundant protein in normal human urine (Lynn et al., 1982) and the predominant protein in hyaline casts (Fletcher et al., 1970; McQueen, 1962; Rutecki et al., 1971). In humans, the daily urinary excretion of THP ranges from 20 to 200 mg with an average of about 2 mg/hr, or
about 50 mg/day. THP Is synthesized and secreted into the urine by cells that line the thick ascending limb of Henle's loop. This "urinary mucoprotein" was first described by Morner in 1895, but its function is still not clear (Kumar and Muchmore, 1990). Tamm and Horsfall described in 1950 the salt precipitation of a normal human urinary glycoprotein that inhibited myxovirus-induced hemagglutination (Tamm and Horsfall, 1950). The more recently described "uromodulin" (Muchmore and Decker, 1985) is identical in amino acid sequence with THP and has immunosuppressive properties.
THP is an 85-kD, 616-amino-acid mature protein with a 24-amino-acid leader sequence (Fletcher et al., 1970; Hession et al., 1987; Kumar and Muchmore, 1990). It is homologous with the human low-density lipoprotein receptor, epidermal growth factor (EGF), and GP-2, the major component of zymogen granule membranes of the exocrine pancreas (Hoope and Rindler, 1991). It is rich in cysteine and has numerous intrachain disulfide bonds. THP is about 30% carbohydrate by weight and about 1% lipid (Fletcher et al., 1970). The predominant carbohydrate-protein bonds are N (as opposed to O) linkages (Fletcher et al., 1970; Muchmore and Decker, 1987; Muchmore et al., 1987). Hydrophobicity plotting shows that THP does not have a classic transmembrane hydrophobic region; it appears to attach to the lipid bilayer via phosphatidyl inositol. It is likely to be released from the membrane by proteolytic or phospholipolytic cleavage (Rindler et al., 1990). THP has a low isoelectric point and has a tendency to form gels in aggregates of several million daltons. Gel formation is increased by the presence of albumin, acidic pH, high THP concentration, sodium and calcium ions, and possibly radiocontrast media (Kumar and Muchmore, 1990). Methods for determining THP in human urine include salt precipitation (as first noted by Tamm. and Horsfall), radioimmunoassay, radial immunodiffusion, electroimmunoassay, and lectin adherence.
THP has been found in the kidneys of numerous placental mammals but not marsupials or reptiles (Wallace and Nairn, 1971). The rate of THP excretion can differ in a given individual over the course of a day by as much as a factor of 18 (Hession et al., 1987). The pattern of excretion varies from person to person, with no obvious circadian rhythm. Eating and recumbency do not appear to influence THP excretion. Radioactive-tracer experiments indicate that THP is formed de novo in the renal tubules, rather than transported there; it has been identified in urine produced by isolated perfused kidneys (Cornelius et al., 1965). Most studies have localized THP in humans to the ascending part of Henle's loop, the early distal convoluted tubule, and tubular casts (Hoyer et al., 1974; Lewis et al., 1972; Pollak and Arbel, 1969; Schenk et al., 1971; Wallace and Nairn, 1971). There is conflicting evidence as to its presence in macula densa cells (Hoyer and Seiler, 1979; Sikri et al., 1981). In normal humans, THP is characteristically absent from glomeruli, proximal tubules, and the
interstitium. It appears to be produced by the aforementioned tubular cells, transported to the tubular lumen, and, as noted above, attached to the lipid bilayer via phosphatidyl inositol. The daily excretion of THP is about equal to its content in the kidneys, so the total amount of THP must be synthesized de novo each day (Schoel and Pfleiderer, 1987).
Localization of THP to the distal tubule and the gel-forming tendency of THP have led to speculation that it is partly responsible for the impermeability of the thick ascending limb to water (Kumar and Muchmore, 1990). In patients with chronic renal failure, THP excretion is diminished. Large amounts of the protein might be present in hyaline casts; this could be related to its distal secretion into relatively acidic tubular fluid. Changes in renal THP have also been extensively found in patients with glomerular nephritis, the nephrotic syndrome, and in renal-allo-graft recipients.
Although THP is the major protein in normal human urine, measures of its excretion have unknown utility as indexes of renal function or markers of renal injury.
MARKERS OF CYTOTOXICITY AND CELLULAR RESPONSE
Toxic agents have been implicated in the etiology of diseases in every major histopathologic category of glomerular and tubulointerstitial nephritis. For that reason, any marker of renal-cell damage or inflammation must be considered a possible indication of toxic insult. Toxic injury can affect the cells in any major compartment: glomeruli, tubules, interstitium, and vessels. A single agent can damage cells in more than one compartment. Furthermore, the structural and functional interdependence of cells in different compartments can complicate or confound the identification of primary targets of injury. Injurious effects can be acute, chronic, or both. Both acute and chronic damage can result from direct toxicity and from immunologic responses (allergic, autoimmune, and inflammatory) triggered by a toxicant. In addition, nonimmunologic factors, such as hemodynamic stress, can contribute to cell damage after exposure to toxicants. Furthermore, the cellular sites of injury can be different for acute and chronic effects of a single toxicant and can change during the course of a chronic disease, especially if immunologic factors become important.
Mechanisms of injury can be evaluated in vitro with tissue cultures, isolated kidney or nephron components, and cell-free extracts, but it is absolutely essential that nephrotoxicity be studied in vivo to elucidate the cell interactions and systemic factors that can trigger the response to injury or perpetuate a chronic disease. Studies of mercury nephropathy in rats, especially by the group of Druet (Dubey et al., 1991; Pelletier et al., 1987; Pelletier et al., 1988), documented this well. The rat model of mercury exposure is a paradigm of the potentially complex natural history of toxic injury to the kidney. The complex, long-term
effects of exposure to such drugs as adriamycin, cyclosporin, and puromycin have also been studied successfully in animal models by several laboratories. Those investigations provide valuable insights into the possible relationships between acute and chronic effects of nephrotoxicants, and might provide important clues to cell-specific markers of renal injury.
Abnormal changes within the kidney can involve endogenous cells, marrow-derived cells, and connective-tissue matrix. The endogenous cells of the kidney that can be affected by toxicants include those of glomeruli, tubules, interstitium, and vessels. Despite the microanatomic and functional heterogeneity of the cells those compartments, responses to injury can be divided into a few major categories: hypertrophy, proliferation, degeneration (detachment, vacuolization, lysis, necrosis, and apoptosis), altered metabolism (synthesis, secretion, and uptake), surface-membrane remodeling (changes in shape, charge, antigen, and receptor expression), regeneration, inclusion formation, alterations in cytoskeleton or organelle composition, and activity.
A substantial population of marrow-derived cells can be found in the glomeruli, interstitium, and perivascular tissue of normal kidneys. In pathologic states, those blood-borne cells can increase in number through infiltration and local proliferation, differentiate into functionally or phenotypically distinct cells, and become metabolically activated.
Abnormal functions of endogenous cells and marrow-derived cells can lead to alterations in the extracellular matrix of the kidney. The direct action of a toxicant and the accumulation of immune reactants, coagulation factors, etc., can also cause pathologic changes that affect the structure of the matrix (thickening, thinning, splitting, duplication, and disruption), its biochemical composition (inclusions and abnormal constituents), and its physical properties (charge and permeability).
Urinary Cells
Conventional light-microscopic examination of cells in urinary sediments does not permit precise distinctions between types of epithelial cells and leukocytes. Therefore, the cellular composition of urinary sediment has not proved useful as a marker of renal injury. That is unfortunate, in that accurate analysis of urinary cells is a potentially powerful tool for identifying the site, severity, and mechanism of renal damage.
Some recent innovations hold promise, but further technologic advances and clinical studies will be required before they can be applied in routine screening of urine samples. The use of monoclonal antibodies and immunohistochemical staining should make it possible to distinguish among epithelial cells arising from individual nephron segments or structures of the lower urinary tract. Similarly, cell-specific antibodies should allow precise and detailed characterization of macrophages and lymphocytes that reach the urine. The cytocentrifuge should prove valuable for
preparing cells for both conventional and histochemical staining (Schumann, 1986). Even more important might be the development of techniques for preparing urinary cells that were developed in the course of successful studies that used urinary cells in the diagnosis and management of bladder cancer. These techniques, when coupled with fast image-analysis systems, offer the potential for automated analysis to detect cells from specific regions of the kidney. Transmission electron microscopy could also aid in the identification of epithelial cells (Mandal, 1986; Mandal and Bennett, 1988). Methods of tissue culture might provide clinically useful information about the metabolism of cells isolated from urine (Racusen et al., 1991). Techniques of in situ hybridization have been widely disseminated in recent years for analyzing changes in gene expression that accompany tissue damage. Those methods of molecular biology have been applied successfully to the investigation of mechanisms of renal injury in tissue samples and should prove similarly useful in detecting abnormal gene expression or synthetic capacity among cells in urinary sediments.
Hematuria is an important and often early marker of renal injury. Analysis of the red cells in urine (number, structure, and cast formation) can sometimes provide clues about the nature and site of the lesions (Kohler et al., 1991; Pollock et al., 1989). However, despite persistent attempts to identify criteria that might increase the diagnostic value of red cells in urine, their presence remains a relatively nonspecific indication of injury.
Markers of Injury or Inflammation in Renal-Tissue Samples
With the widespread use of the kidney biopsy for diagnosis, a systematic approach to the evaluation of renal-tissue samples has been developed that facilitates the detection of changes in kidney architecture. Histologic abnormalities can be recognized and analyzed with considerable sophistication, rigor, and reliability. Conventional methods of light and electron microscopy permit ready identification of deviations from the normal appearance, configuration, and number of endogenous cells. Immunofluorescence and immunohistochemical staining procedures, which constitute a powerful adjunct for the microscopic examination of renal tissue, are now used routinely to identify antibodies, complement components, coagulation factors, mononuclear cells, and basement-membrane constituents. With the recent rapid dissemination of highly specific monoclonal antibodies and genetic probes, it is becoming possible to obtain detailed information on the metabolism of renal cells from appropriate studies of tissue specimens.
Conventional methods of histology have been especially useful in the identification and classification of glomerular damage. A major limitation has been that early (preclinical) stages of human glomerular damage have not been avail-
able for study. Histologic aspects of tubular injury have not been as comprehensively or formally described. That deficiency is especially unfortunate, inasmuch as tubular cells are most commonly the primary site of toxic injury. Optimal preservation of tubular cell structure requires techniques of perfusion fixation that can be applied in vivo to animals only. As a result, mild damage to the luminal membrane, slight alterations in tubular diameter, and other subtle features of tubular injury can be difficult to assess or even be completely overlooked in human tissue samples. Furthermore, samples obtained by biopsy often fail to provide adequate representation of the highly specialized segments of the tubular system. Finally, the interstitial cells that lie near the tubular cells remain mysterious. Until the microanatomic heterogeneity, functional specialization, and developmental origins of normal interstitial cells are better understood, it will be difficult to identify subtle deviations from normal conditions. Inflammation of the interstitium is usually easy to recognize, and immunohistochemical staining methods have made the mononuclear cell composition of interstitial infiltrates amenable to sophisticated analysis.
Markers of renal-cell injury have been studied more analytically in animals than in humans (see Table 4-11). The animal models cover a wide array of pathogenic mechanisms, including immune complex disease, specific antibody-mediated injury, heavy-metal exposure, drug toxicity, ischemia, surgical reduction of renal mass, hypertension, diabetes, and systemic autoimmunity. In addition to methods of microscopy, cell abnormalities associated with renal injury in animal models have been evaluated with tissue culture, isolated whole-kidney perfusion, tubular microperfusion, micropuncture, cell fractionation and extraction, and the study of kidney-slice preparations and isolated membrane vesicles. The biologic markers that have been linked to cell injury on the basis of studies of renal tissue can be divided, for the purposes of review, into several categories:
-
Immunologic factors:
-
Humoral—antibodies and antibody fragments; components of complement cascade, and coagulation factors.
-
Cellular—lymphocytes, mononuclear phagocytes, and other marrow-derived effectors (eosinophils, basophils, neutrophils, and platelets).
-
Lymphokines.
-
Major histocompatibility antigens.
-
Growth factors and cytokines: platelet-derived growth factor, epidermal growth factor, transforming growth factor (TGF), tumor-necrosis factor, interleukin-1, etc.
-
Lipid mediators: prostaglandins, thromboxanes, leukotrienes, and platelet activating factor.
-
Extracellular-matrix components:
-
Collagens.
-
Procollagen.
-
Laminin.
-
Fibronectin.
-
Adhesion molecules.
-
Reactive oxygen and nitrogen species.
-
Transcription factors and proto-oncogenes: c-myc, c-fos, c-jun, c-Ha-ras, c-Ki-ras, and Egr-1.
-
Tubule antigens, Tamm-Horsfall protein, brush-border molecules, and cystatin.
-
Heat shock proteins.
-
Endothelin.
Some methods permit precise identification of cell sites of response to injury. Proliferation, evaluated microscopically according to the uptake of appropriately labeled nucleic acid precursors, has been localized in individual cells or histologic compartments of the kidney in various animal models. Special tracers and staining methods have been used to recognize and localize alterations in charge distribution of cell and basement membranes. Theoretically, with appropriate probes (e.g., monoclonal antibodies and genetic probes) it should be possible to identify with high precision the cell sources of synthesis or the sites of accumulation of most of the molecules that reflect metabolic alterations produced by injury. In practice, however, relatively few markers have been unequivocally linked to cell-or site-specific injury. Technical problems are considerable. For example, it has been very difficult to distinguish the secretory activities of mesangial cells of the glomerulus from those of marrow-derived cells that are near and might be numerous in hypercellular glomeruli. In addition, metabolic responses to injury might be similar in cells in different compartments of the kidney and in exogenous and endogenous cells.
Potential sources of biologic markers of cell injury or inflammation in renal tissue samples are listed in Table 4-2. It can be seen, for instance, that cytokine production has been attributed to mesangial cells, macrophages, and tubular cells; the expression of major-histocompatibility-complex class II antigens is also a potential of all three cell types. A wide variety of hormone-like proteins and biologic response modifiers can be produced in the kidney in response to cell damage and tissue inflammation. Although marrow-derived mononuclear cells are a major and well-studied source of those molecules, many can also be produced by cells intrinsic to the kidney. The table summarizes a large and rapidly growing literature on possible intrarenal sources of some biologic markers of cell injury that might have clinical value. Glomerular sites of synthesis of individual molecules have been relatively easy to identify, because glomeruli are readily separated from other renal components for extraction, tissue culture, and other analytic procedures. Tubular, interstitial, and vascular cells have been less amenable to detailed investigation. Recent advances in tissue-culture methods, however, hold promise of more complete characterization of the metabolic and synthetic capacity of specialized renal cells outside the glomerulus.
Markers of Renal-Tissue Injury in Urine
Some of the potential markers of cell injury identified through studies of renal tissue have been detected in urine, but many of the findings have been isolated, inconclusive, or fragmentary. Urinary concentrations of some cytokines, arachidonic acid metabolites, adhesion molecules, growth factors, and connective-tissue matrix components have been measured in animal models and human diseases (see Table 4-1). That urinary concentrations of the markers are usually correlated with at least one histopathologic or pathophysiologic index of disease severity indicates the potential value of urine assays in detecting or monitoring for nephrotoxicity.
Results of studies with EGF suggest that its urinary excretion can be especially useful as a marker of effect (see Chapter 6). The origin of urinary EGF seems to be the kidney. That renal clearance of EGF exceeds that of inulin in rats and mice indicates renal secretion (Nielson et al. 1989). Removal of other sources of EGF does not affect its renal excretion, and removal of one kidney reduces urinary EGF excretion by half (Olsen et al., 1984). With the finding of its mRNA in the kidney, results of those studies strongly suggest that urinary EGF is derived from the kidney. Several recent studies in experimental renal failure and human renal disease demonstrate that both the renal production and the renal excretion of EGF fall after renal injury. Cisplatin (Safirstein et al., 1989) and aminoglycoside nephrotoxicity (Verstrepen et al., 1991) reduce renal production of the mRNA associated with the EGF precursor molecule prepro-EGF and reduce EGF excretion. Ischemia (Safirstein et al., 1990) markedly reduces prepro-EGF mRNA and excretion, as does unilateral or bilateral ureteral obstruction (Storch et al., 1992). In those studies, the decline in EGF excretion correlated very closely with the degree of renal impairment. The renal excretion of EGF falls in human diabetic renal disease (Mathiesen et al., 1988) and correlates well with the degree of renal damage. Urinary EGF excretion is low in patients soon after receipt of a renal allograft (Kvist and Nexo, 1989) and rises as renal function is restored. In experimental models of polycystic renal disease, prepro-EGF mRNA is reduced (Gattone et al., 1990). The assay of urinary EGF is simple, and urine samples can be collected under routine conditions and stored under refrigeration for long periods.
Urinary Enzymes
The modern era of using urinary enzymes in the investigation and diagnosis of renal injury or disease was initiated by Rosalki and Wilkinson, who reported increased lactate dehydrogenase (LDH) activity in the urine of patients with renal disease (Rosalki and Wilkinson, 1959). Acceptance of urinary enzymes, in contrast with serum enzymes, as a diagnostic tool has been slow; in his sentinel review of the application of urinary
enzymes in evaluating both nephrotoxicity and renal disease, Price (1982) concluded that ''the principal reason for the slow development of this field [urinary enzymes] is the difficulty involved in the assay of enzymes in a fluid which varies in volume, composition, and which is a hostile environment for many enzymes.'' In the 1990s, the difficulty might be rephrased: the major barriers to widespread acceptance of urinary enzymes as diagnostic markers include uncertainty about the exact location of the enzyme in the nephron and about how it reaches the urine. Questions also remain about pathologic correlates of urinary enzyme activity, its relationship with exposure dose and percentage of tissue destruction, and its therapeutic or prognostic importance.
Dubach, who has contributed much to the understanding of the diagnostic application of urinary enzymes, has concluded that "empiricism" dominates the field and that only by focusing on the definition of the cellular location of the enzyme can this application gain respect (Dubach and LeHir, 1984). This focus and the characterization of the mechanisms by which enzymes gain access to urine, are the principal tasks of the basic investigator. For the clinical investigator, the problem is "clarifying pathophysiological mechanisms for increased excretion of urinary enzymes." Dubach and LeHir (1984) discourage the use of urinary enzymes in screening for renal disease, because drugs, diagnostic procedures, and co-existing systemic diseases (e.g., sepsis and hyperthyroidism) and myocardial infarction can markedly influence urinary enzyme activity. However, enzymuria has proved useful in screening for selected circumstances of occupational exposure and should be used to evaluate new drugs or procedures with potential renal effects. A recent interest has been the early diagnosis of renal-transplant rejection and the differentiation of upper from lower urinary tract infections.
Theoretical and Diagnostic Importance
The theoretical basis for recommending the use of urinary enzymes in assessing renal injury is well reasoned. Enzymes are uniquely distributed along the course of the nephron; at least 10 separate segments have been defined (Guder and Ross, 1984). Furthermore, enzyme location in renal cells is restricted to specific subcellular components, thus providing further detail about injury site and potential mechanism. Access of plasma enzymes to the glomerular filtrate is limited by the permeability of the glomerular membrane.
In discussing the assessment of renal injury with urinary enzymes, Plummer et al. (1985) summarized the various possibilities that might explain how enzymes reach the urine. In addition to their low rate of filtration, the processes include the normal shedding from tubular cell surfaces and the release of enzymes that occurs with cell injury or death. Other cells in urine might contribute (i.e., bacteria, red cells, white cells, and lymphocytes), as might other
components of the genitourinary system (i.e., bladder, glandular secretions, semen, and tumors). Under experimental conditions, contamination from food, feces, etc. might also contribute enzymatic activity to urine.
Well over 100 urinary enzymes have been investigated for diagnostic use in various states of renal injury, although only a few have gained notable acceptance for routine clinical use. To be clinically useful, the baseline excretion rates of a urinary enzyme must be low and allow recognition of an increase without excess background noise. Recent advances in technology have improved both detection and the reproducibility of measurement, including the application of automation for processing large numbers of samples, such as might arise from field screening projects. Substantiation of the theoretical basis of urinary enzymes as a renal diagnostic tool has not come easily. To understand the unresolved problems, it is best to start by defining the criteria by which urinary enzymes should be judged if they are to be accepted as diagnostic markers.
Recently, Guder and Hofmann (1991) stipulated the following criteria for the diagnostic use of tubular enzymes or antigens. They divided the items to be evaluated into technical and biologic groups. The following five items were to be considered in judging the technical aspects of specific urinary enzymes as diagnostic tools: precision, standardization (accuracy), interferences, technical performance (automation), and cost. Six biologic items were to be considered: origin (in or outside the nephron), intracellular location, mechanisms of release into urine, stability in urine at 37°C, sampling conditions, and the influence of other factors (diet, blood pressure, and biologic variation).
The two major applications of urinary enzymes are monitoring for subtle renal dysfunction and clarifying mechanisms of nephrotoxicity. Only a few enzymes have been generally accepted as valuable urinary markers, including NAG, alanine aminopeptidase (AAP), and LDH. Others, such as intestinal alkaline phosphatase, are emerging, but they lack the wide application and reporting enjoyed by the first three. NAG has now been defined to have its highest activity in the straight (S3) location of the proximal tubule of humans, with less activity in the collecting-duct portion of the distal nephron (Schmid et al., 1986). That observation, coupled with the refinement of colorimetric assays, makes it one of the most useful and best studied of the diagnostic urinary enzymes. Both enzymes are stable in the frozen state. For acute changes—such as those induced by drugs, transplant rejection, and acute renal injury—the enzymes offer an excellent diagnostic aid, although baseline values are often required to ensure proper interpretation of the findings.
Disadvantages as Markers
Urine is readily available and convenient to sample, but it constitutes a
harsh environment for most enzymes because its low pH, slight buffering capacity, and the presence of many inorganic and organic compounds, which can act as either inhibitors or activators. To circumvent those problems, urine is stored at 4°C until collection is complete, and it is dialyzed or diluted before analysis whenever possible.
Unless a convenient reference standard, such as creatinine, is available, accurate timing and volume measurements of urine specimens for analysis are essential. The debate continues about whether the proper method for expressing urinary enzyme excretion is concentration in units per liter, with or without correction for creatinine, or rate of excretion in units per unit time. Because of diurnal variation, especially for NAG and AAP, the use of a concentration expression demands that similar collection intervals during the day be used if comparisons are to be useful.
Another source of difficulty in the use of urinary enzymes arises from lack of information on several factors: What is the influence of aging on the excretion of urinary enzymes? Does it follow the same pattern as creatinine? Does sex have any influence? Another deficiency of urinary enzyme studies is the absence of pathophysiologic correlations. In addition, the overlap between normal ranges and values recorded in patients with stable chronic renal disease provides poor specificity and sensitivity for the diagnosis of renal disease. Finally, identification of location in the nephron has been lacking, although this is changing with the advent of specific isoenzymes such as intestinal alkaline phosphatase (Verpooten et al., 1989).
MARKERS OF NEOPLASIA
General Considerations
By the time many cancers are detected on the basis of symptoms, it is already too late for effective intervention. Although conventional therapy might prolong life, most patients with metastatic disease eventually die of it. It is clear, therefore, that reducing cancer death rates will depend on prevention. Elimination of exposure can be effective, but it is of no use for those already exposed; such an approach cannot achieve significant cancer reduction except over long periods. Cancer usually has a roughly 20-year latent period in humans, and recent findings strongly suggest that carcinogenesis can be detected through biologic markers and inhibited by treatment with chemopreventive agents. Markers of effect play a crucial role in this process by identifying people who have demonstrable intermediate end points short of clinical disease. Detecting people in a more easily treatable preclinical phase shifts the emphasis from treatment to prevention.
Modern research is identifying hundreds of potential markers. If a marker is to be useful in the clinical setting, its accuracy must be sufficient to allow treatment decisions. The "gold standard" is the 5-year prospective study, but when the additional costs of devel-
oping a laboratory test with quality control suitable for widespread implementation are included, it is clear that only a very small number of markers can be subjected to the final test of the prospective study. Strategies will need to be developed that can quickly identify markers worthy of clinical study.
Proliferation
A hallmark of cancer initiation, promotion and progression is an increase in cell proliferation. Increased cell proliferation can promote the carcinogenic process itself by increasing the likelihood of inheritable changes that promote carcinogenesis. That is, cells are more likely to mutate during cell division and acquire invasive and metastatic potential. The frequency of mitotic figures and the presence of abnormal mitotic figures are good indicators of malignancy and are used in pathologic grading of tumors. But an increase in the number of proliferating cells is not always diagnostic of malignancy because many benign conditions—including hyperplasia, repair, inflammation, and stones—can also increase cell division. In addition, although tumor size and progression are correlated, bulky tumors do not necessarily invade and metastasize. For instance, many benign prostatic glands are larger than primary prostatic cancers, and many low-volume, high-grade prostatic cancers metastasize (Norming et al., 1989, 1992; Wheeless et al., 1991, 1993).
Tumors commonly have abnormal cell divisions that result in abnormal numbers of chromosomes, and therefore abnormal amounts of DNA, but it is difficult to estimate these with precision in hyperdiploid tumors when there are overlapping populations of cells. The hyperdiploid fraction is the most reliable predictor of bladder-cancer behavior and is accurate for determining proliferating cells in diploid tumors (Wheeless et al., 1991, 1993). The biologic characteristics of the tumor are not the only source of error in the determination of the fraction of cells in the synthetic phase of the cell cycle. Others include individual laboratory accuracy, variation in mathematical modeling programs, and percentage of apoptotic and necrotic cells that can influence dye binding, Tritiated-thymidine uptake assays that use autoradiographic techniques (Steel, 1977) to determine DNA synthesis are generally considered the "gold standard" for cell proliferation, and assays that use 5-bromodeoxyuridine incorporation are the next best (van Weerden et al., 1993; Waldman et al., 1993), but both are too complex for routine clinical studies. More recently, in vivo labeling has been used with iododeoxyuridine; this reflects the biology of invasion and metastasis more accurately.
Figure 4-1 depicts some of the most common proliferation-associated antigens and markers used to estimate proliferative rates and dissect the cell cycle. Until recently, proliferating-cell nuclear antigen, PCNA (Galand and Degraef, 1989; Raska et al., 1989; Thaete et al, 1989; van Dierendonck et al., 1991;
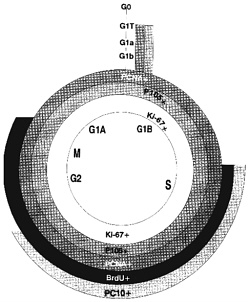
Figure 4-1. Markers of the cell cycle. Superimposed on the diagram of the cell cycle are indications of where different proliferation markers are positive. PCNA and p105 are positive in all cells that are not in G0, including the G1 transition phase. Ki-67 is positive in all but the transition area; BrdU and PC10 are positive during much more restricted portions of the cycle. Use of different markers can lead to different estimates of the fraction of proliferating cells.
Waldman et al., 1993) and p105 (Clevenger et al., 1987a,b) were the only markers useful for retrospective studies with paraffin tissue blocks. Cyclin, an auxiliary protein of DNA polymerase-δ, is perhaps the best-characterized marker of cycling cells, but even here there is no universal agreement (McCormick and Hall, 1992). Newer antibodies to recognize PCNA and other antibodies to proteins that mark the S phase of the cell cycle are under investigation (see below). PC10 (Figure 4-1) reportedly reacts only with cells in the S phase (Landberg and Roos, 1991) but might have a longer duration in the cell-cycle phase than previously thought (Scott et al., 1991). Ki-67 closely correlates with BrdUrd labeling, and the new anti-Ki-67 MIB1-3 antibodies (Key et al., 1993) are now available, allowing retrospective studies of paraffin-embedded tissue. Evaluation of data in the literature is difficult. Assay control standards have not consistently been used to assess the quality of each assay. The use of different assay methods by different investigators can result in discrepancies. And, different vendors offer different antibodies that might recognize different sites of a protein or even different epitopes. Clearly, the one feature of DNA ploidy analysis that consistently correlates with cancer survival involves cell-proliferative rates. Biologic markers to assess populations of cells in each stage of the cell cycle accurately should prove beneficial in evaluating the efficacy of chemotherapy and predicting tumor aggressiveness. Systematic studies with standard controls of well-established proliferative rates need to be performed to determine which technically feasible proliferative markers are clinically useful in predicting metastases or survival.
Renal-Cell Carcinoma
Several secondary chromosomal abnormalities occur in nonpapillary renal-cell carcinoma. Various aberrations, including deletions and duplications, have been reported in chromosomes 3, 5, 7, 8, 9, 14, and 20 and the Y chromosome. Those aberrations, used as markers, are presumed to be associated primarily with tumor progression and might reflect the marked genetic instability of tumors. Trisomy of chromosome 5 has been observed in about 15% of the cases. Abnormalities of chromosome 5, including segment loss and translocation, have also been associated with renal-cell carcinoma and the familial adenomatosis gene in sporadic colon cancers. The c-fos gene on chromosome 14 has also been observed to be aberrant in nonpapillary renal-cell carcinoma. Another common abnormality has been reported in chromosome 17, where deletions have been documented in high-stage nonpapillary renal-cell carcinoma. Chromosome 17 contains the important suppressor gene p53, which is associated with oncogenesis. Table 4-3 contains a list of various potential biologic markers of renal cancer.
Bladder Cancer
Conventional Markers in Bladder Cancer
The urinary epithelium consists mainly of a single type of cell, and exfoliation of these cells into urine provides a noninvasive source of both cellular and soluble markers. The cardinal sign of bladder cancer has been hematuria with or without irritative bladder symptoms. The hematuria can either be gross or microscopic. Most studies have shown that a majority of high-grade tumors have already progressed to metastasis by the time gross hematuria is evident, so its usefulness as a marker is slight.
Dipstick Testing
The sensitivity of dipstick and microscopic analysis for the detection of microhematuria is controversial, and the results afforded by the two methods have not always correlated. It has been estimated that a single-dipstick method for detecting blood in urine has a sensitivity of about 37% for detecting bladder cancer. A major consideration in the use of microhematuria as a marker of bladder cancer is that the microhematuria is intermittent and that in some cases neovascularization of the lesion must have occurred to a marked degree before the patient presents with gross hematuria. It can, however, be detected as long as 8 years before the detection of a tumor. Because of the lack of sensitivity of a single-dipstick test, Messing and colleagues (1990, 1992) introduced sequential dipstick analysis by the patient at home for 14 consecutive days. This method is inexpensive and has been estimated to detect about 80% of bladder cancers, although compliance is a relatively poor 45%. About 21% of the patient population aged 50 and older who smoke will have microscopic hematuria on at least one analysis, so many patients might require more extensive and high-cost testing to rule out the presence of bladder cancer. In re-testing patients who have initially tested negative, it was found that 6% of patients were positive for hematuria on the second screen, and 1% of these patients were found to have bladder cancer. These results suggest the need for methods of detecting bladder cancer that have a higher degree of sensitivity and specificity.
Cytologic Analysis
The routine evaluation of Papanicolaou cytology for bladder cancer has recently been reviewed (Farrow, 1990). Papanicolaou cytology under most circumstances has a sensitivity between 20 and 85%, depending on stage and grade. Sample type—i.e., bladder wash or voided urine—also affects the sensitivity and specificity of the test. Papanicolaou cytology has been found to be particularly useful for monitoring patients who have established high-grade disease but
has been generally ineffective in screening programs to detect bladder cancer in xenobiotic-exposed cohorts who are at risk for developing malignancy (Cartwright, 1986). Nearly 50% of such patients have been missed in conventional screening and have progressed to invasive disease. With an incidence of bladder cancer in the general population of 3/10,000, many persons need to be screened to detect one bladder-cancer case. Therefore, attempts have been made to automate urinary cytology; although some success has been achieved (Azzopardi and Evans, 1971; Bauer, 1988), it is still hard to distinguish atypia or dysplastic changes associated with inflammatory conditions from changes associated with malignant disease.
Karyotypic changes
Low-grade papillary tumors have been associated with changes in chromosome 9, and high-grade carcinomas and carcinoma in situ appear to develop along a second pathway that often involves alterations in suppressor oncogenes, such as p53. Whether those alterations are primary and initiate carcinogenesis or secondary and result from genetic instability remains to be determined. The genetic mutations in the p53 gene on chromosome 17 are frequent and varied. Whether specific mutations are associated with various types of carcinogenic exposure is a point for future investigation, which might shed light on the underlying mechanisms of carcinogenesis.
Markers in Occupationally Exposed Cohorts
Several cohorts are being monitored nationally and internationally for bladder cancer with markers of varied effectiveness (Davies et al., 1988; di Sant' Agnese, 1988; di Sant' Agnese and de Mesy Jensen, 1987; Doctor et al., 1986; Eaton et al., 1988). The markers include elements of conventional urinary cytology, the addition of DNA ploidy (to determine the presence of an excessive number of chromosome sets) and various forms of differentiation markers, growth factors and their receptors, and oncogenes and their protein products.
Table 4-4 outlines a number of markers that should be useful for bladder cancer. The most widely used marker in the genitourinary tract is quantitation of DNA ploidy, which has been applied to routine cytology with either flow cytometry or image analysis. The significance of cells that are atypical in appearance has been a major issue for cytologists particularly with respect to low-grade malignancies of the genitourinary tract. Experiments with acridine orange dye, Hoechst dye, and Feulgen staining have demonstrated that with the addition of tests of DNA ploidy some degree of increased sensitivity is gained in bladder-cancer detection.
Studies of bladder-field disease have identified several cellular markers that become abnormal at different times in the development of disease, including altered ploidy as a late event (Rao et al., 1993). A major group of potential markers is monoclonal antibodies to tumor-related antigens.
Prostatic Cancer
Prostatic cancer is the second-most common cancer of men; about 200,000 cases of prostatic cancer will be diagnosed in the United States in 1994. That is substantially more than in previous years and is almost certainly due to the introduction of prostate-specific antigen (PSA) testing. PSA is a protease specific to prostatic tissue that is secreted into the serum and constitutes a marker of effect. Its introduction has highlighted a number of important issues with regard to biologic markers of effect, including health-care costs, its effective use, its sensitivity and specificity, and the relationship between cryptic and active disease. Current research into the molecular and cellular biology of the prostate and of growth regulation are expected to result in new tests with higher specificity and sensitivity that should permit individual risk assessment and differentiation of indolent and active disease. The introduction of PSA without completing a prospective long-term followup study illustrates one of the major problems in prostatic cancer research in that such a study would have required 15 years for completion. Because the discovery of organ-confined disease is often life-saving, there is a reluctance to defer the application of a new technology until the results of a long-term study are available.
The complex organization of the prostatic architecture reflects the multiplicity of potential cellular interactions critical to cellular homeostasis. Any of the cellular types can abort normal regulatory control and directly or indirectly participate in tumorigenesis. Hormonal growth control has been the primary focus of investigational research and clinical therapy. However, in today's clinical setting, the tumor cells that progress and the eventual demise of the patient are hormone-independent and can reflect a reawakening of mechanisms that were active during embryogenesis. Hidden in the histopathologic architecture of the gland are neuroendocrine cells that are adjacent to basement membrane cells and associated stromal cells that support the functional epithelial cells. These neuroendocrine cells are the participants in supporting the biologic media so important to human fertility and reproductive success. The scientific challenge is to determine which cells are the primary targets of xenobiotics and which genetic factors are implicated in the deregulation of adult paracrine growth control and the emergence of autocrine independence.
Investigations at the cellular and molecular levels have begun to identify structural and biochemical changes associated with the emergence of the malignant phenotype. At the structural level, a series of graded dysplastic changes is now recognized as being premalignant. These changes are known as prostatic intraepithelial neoplasia (PIN). Investigations of molecular biologic markers using immunohistochemistry and quantitative morphology have shown a strong correlation between PIN and other recognized biologic markers of malignancy, such as aneuploidy. Quantification at the single-cell level and a definition of biochemical "cell talk" promise to define further the biochemi-
cal changes responsible for the histopathologic alterations and the selection of the deadly hormone-resistant clones. Each of the histopathologic manifestations of increased cellular proliferation, invasion, and metastasis reflects subtle quantitative alterations.
Serum Prostate-Specific Antigen
Biologic markers of disease have been detected primarily in the serum and are nonspecific for malignancy, reflecting quantitative alterations in normal cellular constituents. Until recently, acid phosphatase, an enzyme normally expressed in prostatic epithelial cells, was the principal serum biologic marker. Because of its poor specificity for detecting early disease, more recent efforts have focused on the evaluation of PSA (Wang et al., 1979). PSA is a glycoprotein found in the seminal plasma. Antibodies to this 30-kD molecule were produced by Wang et al. (1979). PSA is found only in prostatic tissues, benign prostatic hypertropby (BPH), and prostatic cancer. The gene coding for PSA has been sequenced and is on chromosome 19. Genetic deletions or mutations of this chromosome will result in clonal cells that do not predominantly express the protein so important for the liquefaction of seminal ejaculate. PSA production is limited to the epithelial cells, and its quantification within these cells establishes its potential as a cellular biologic marker for prostatic cancer. The chymotrypsin-like activity of the protein cleaves the seminal vesicle-specific antigen produced by the seminal vesicle cells. This interaction establishes the rationale for the theoretical development of perhaps more specific and sensitive assays in the future (see Chapter 6). It should be kept in mind that some cancers seem to have deleted the gene for PSA production, which might mean that they do not produce PSA or contain less of it than normal or BPH cells. However, PSA is still usually increased because it is not normally released into the serum unless the cell membranes are altered or damaged. Serum PSA can be increased in BPH or prostatic infection, in addition to cancer.
Because PSA is increased in patients with BPH and inflammatory conditions of the prostate, attempts have been made to improve the sensitivity and specificity of this assay for the diagnosis of prostatic cancer. Various thresholds were established before implementation of the assay in wide scale clinical testing. This has raised multiple issues concerning uncritical reliance on the PSA test in clinical medicine. The use of this assay has stimulated interesting questions related to technology transfer and assay evaluation; optimal methods for interpreting test results in light of PSA's poor specificity (age-adjusted PSA, PSA density, PSA velocity); the detection of clinically inactive or latent prostatic cancer; adaptation as a screening test without clinical trials to establish efficacy; and the cost-benefit relationship in the management of patients with prostatic cancer.
Prostatic Intraepithelial Neoplasia
A strong association between the presence of prostatic intraepithelial neoplasia (PIN) and high-grade prostatic cancer suggests that PIN can be a precursor of prostatic cancer. Using PIN tissue, McNeal and Bostwick (1986) have proposed a group of potential biologic markers of prostatic cancer (Table 4-5). Assessment of any of them awaits the development of more sensitive methods for detecting alterations in serum, prostatic secretions, or urine. Fine-needle aspiration of cells is also possible with needles smaller than those commonly used in venipuncture to obtain blood. A grading scale based on the distribution of vimentin and various keratins might prove helpful.
Morphometric analysis of PIN has revealed graded alterations in nuclear size, roundness, membrane ruffling, and nuclear chromatin similar to those in frank cancer. The greatest utility of such tissue might be as a resource to develop genotypic changes correlated with progression. One potential strong advantage of the use of such tissue is that some phenotypic changes that can predict progression are seen in otherwise normal cells of the field; this could allow detection of a cancer in the prostate, even if the lesion itself cannot be sampled. That feature might be applicable to the design of programs to screen persons at risk with fine needle aspiration and to use more specific core biopsies for confirmation.
Cytokeratins are used mainly to identify the origins of cells in complex epithelia. Research on cytokeratins has focused on delineating the integrity of the basement membrane adjacent to the prostatic epithelial cells in normal tissue, benign lesions, premalignant lesions, PIN, and malignant lesions. Studies with monoclonal antibodies, such as MH-903 (Shah et al., 1991), revealed disruption of the basement membrane in 39 of 40 cancer lesions with a graded increase in frequency noted in PIN.
DNA Ploidy and Prostatic Cancer
DNA ploidy can be determined with such techniques as flow cytometry and image analysis. Image analysis facilitates rare-event detection, correlates with cytologic characteristics, and tends to be more precise in biochemical quantification of epitopes (complex antigenic molecules). Flow cytometry is particularly useful for studying suspensions of cells with recognized homogeneity—i.e., blood cells as opposed to mixtures of stromal and epithelial cells found in the prostate. The lack of standardization of sample collection and processing and signal analysis continues to hinder the usefulness of these approaches to defining ploidy, but further refinement of ploidy studies and combination of ploidy studies with antibodies to various proliferation markers are possible.
A major limitation of marker research
in prostatic cancer is the requirement for long-term longitudinal followup of patients. Archival specimens that are available might or might not have been appropriately fixed to maintain the quantitative or qualitative characteristic of the reacting epitope. Aneuploidy reflects genetic instability and marked tumor heterogeneity. Fluorescent in situ hybridization studies should improve the sensitivity of ploidy analysis and lead to a redefinition of ploidy changes in the future. The identification of markers of specific events in cellular proliferation, invasion, and metastasis should supplant the rather crude measure of DNA ploidy based on flow cytometry or image analysis.
Cytoskeletal and Nuclear-Matrix Proteins
Recent evidence suggests that the actin filaments of the cytoskeleton and nuclear matrix might be useful as early markers of tumorigenesis (Pienta et al., 1989; Partin et al., 1993; Rao et al., 1990, 1991, 1993). Recently, Partin et al. (1993) identified a nuclear-matrix protein uniquely present in all of 14 prostatic cancers but absent from normal prostates and benign-prostatic-hypertension (BPH) tissues. Characterization of the protein revealed an isoelectric point of 6.58 and a molecular weight of 56000.
Tumor-Suppressor Genes
Prostatic cancer can be latent (or occult) or progressive (or biologically active). Latent disease is identified with great frequency at autopsy. It is not known whether the biologically active form develops along a separate oncogenic pathway or occurs as an additional mutation in the low-grade form of the disease.
In addition to oncogenes and growth factors, cancer research has focused on the tumor-suppressor genes. Several tumor-suppressor genes have been identified in prostatic cancer, including Rb and p53. Various methods are available for detecting tumor-suppressor genes. The importance of p53 in relation to growth control was delineated by Gumerlock and DeVere White (Chi et al., 1994), who demonstrated a biologic correlation between p53 mutations and concentrations of IL-6, a cytokine known to be important in cellular proliferation. Growing evidence suggests that changes in the p53 expression occur late in tumorigenesis, are associated with local invasions, and reflect marked tumor heterogeneity. It remains to be determined whether the marker is a stronger marker for predicting tumor invasion and metastasis than is DNA ploidy or tumor grade. Data on Rb are scant, compared with data on p53.
Growth Factors
-
Nerve growth factor. One of the ex-
-
citing advances in prostatic cancer is the recognition of the potential importance of neuroendocrine cells, the associated growth factors, and their potential neuroendocrine function. Cohen and Ellwein (1991) pointed out the importance of neuroendocrine cells as a component of the ducts and acini. They reported that half of all clinically manifest tumors show neuroendocrine differentiation, and suggested that the cells are of greater prognostic value than conventional histopathologic grading systems. Cultured stromal and epithelial cells from prostatic cancer contain a protein-like nerve growth factor (NGF) tissue. The NGF-like protein is localized to the stroma in normal prostatic tissue, which has undergone benign hypertrophy, and cancerous tissue. However, NGF receptors reside primarily on the epithelial component of the prostate. The neuroendocrine cells in the prostate can be stained with chromogranin A; in benign hypertrophy, these cells also stain positive for the androgen receptor. Cohen hypothesized that the cells lacking the androgen receptor might be important in the evaluation of prostatic cells that lack neuroendocrine regulation (Cohen et al., 1991 a).
-
Epidermal growth factor. The DU145 prostate cell line has epidermal growth factor (EGF) and EGF receptor, which provide an autocrine loop for growth control of these cells (Connolly and Rose, 1990). An anti-EGF-receptor antibody reduces growth in these cells. However, no increase in urinary EGF excretion was found in males with prostatic or bladder cancer. Mattila and others found that adenocarcinoma did not stain for EGF in 15 of 20 cases (Mattila et al., 1988).
-
Insulin-like growth factor. There might be a complex interaction between the insulin-like growth factors (IGF-1, IGF-2) and EGF receptors (Connolly and Rose, 1992). In vitro results with the DU145 human prostatic-cancer cell line suggest an interrelationship between the response mediated by IGF receptors and the autocrine EGF response. Results of a second set of experiments involving a rat transplantable prostatic-cancer line that metastasizes to bone reveal the presence of the IGF-1 receptor and the absence of the IGF-2 receptor (Polychronakos et al., 1991). Prostatic epithelial cells in tissue cultures were found to respond to IGF-1 and not IGF-2 or insulin. The effect of IGF-1 might be modulated by a 24-kilodalton IGF-binding protein (Cohen et al., 1991 a). Recent studies suggest that fibroblasts from BPH express increased mRNA for IGF-2. The importance of IGF-2 remains to be determined. The quantity and presence of IGF-binding protein is potentially an important and rate-limiting factor.
-
Transforming growth factor alpha. Transforming growth factor alpha (TGF alpha) has been identified in the premalignant expression in four of 27 benign and 18 of 34 malignant biopsies. Positive staining has also been identified in premalignant lesions and within the stromal elements. TGF alpha might enhance the detection of premalignant
-
lesions (Lloyd et al., 1992). In tissue sections from the prostate, TGF alpha is preferentially expressed in prostatic-cancer cells in comparison with EGFR, which stains primarily the basal cells in both BPH and prostatic cancer.
MARKERS OF INTERSTITIAL CYSTITIS
Several causes of interstitial cystitis (IC) have been suggested. The various suggestions are not necessarily mutually exclusive, and the syndrome could have multiple etiologies. Each proposed etiology tends to be associated with a marker. One difficulty has been the inadequacy of diagnostic criteria. Spontaneous remission is common in the disease, and it has been difficult to define specific markers or to monitor the effects of treatment.
The suggested etiologies of IC were recently reviewed by Messing (1989). Table 4-6 lists the proposed etiologies, briefly summarizes the evidence for and against each, and indicates the potential markers that might be useful. The suggested etiologies include infection, obstruction of vascular and lymphatic channels, neuropathy, endocrinopathy, inflammation, autoimmunity, deficiencies in the bladder protective mechanisms, and the presence of toxic substances in urine.
Several recent studies have linked bladder damage with various mechanisms of inflammation. Elgebaly and co-workers (1992) found that high concentrations of neutrophil chemotactic factors were released after bladder injury by an acidic solution (pH 4.5) in a rabbit model and that this preceded an inflammatory response with high concentrations of neutrophils in the bladder tissue. They hypothesized an early step in an inflammatory response that eventually produces IC. Of great interest was the finding that 11 patients with IC had high urinary concentrations of neutrophil chemotactic factors; but these were not found in patients with diseases other than IC or in interstitial-cystitis patients treated with the anti-inflammatory agent dimethyl sulfoxide (DMSO).
A recent study suggested a further link among inflammation, symptoms, and altered innervation in IC. A population of interstitial-cystitis patients—selected to have a consistent set of symptoms, including mastocytosis—showed nerve content in submucosa and muscle 4 times greater than that in controls; much of the additional nerve content was ascribable to nonadrenergic noncholinergic fibers (Hohenfellner et al., 1992). Recent advances in neurochemistry with in situ identification of neuropeptides and other neurotransmitters have made it possible to readily identify the functional system to which nerves belong (Hohenfellner et al., 1992). The authors (Hohenfellner et al., 1992) point out the existence of links between the nervous system and inflammatory tissue reactions, which are referred to as neurogenic inflammation, in that increased sympathetic outflow can lead to increased local mast-cell populations and pain; they report similar findings in autoimmune diseases,
such as rheumatoid arthritis and inflammatory bowel disease.
Although the presence of mast cells in the detrusor muscle has been a variable feature considered by some to be an important diagnostic factor and by others to have no importance (Yun et al., 1992), an interesting study showed that urinary histamine concentrations after hydrodistention more than doubled in interstitial-cystitis patients; in patients without this diagnosis, there was no significant increase. (There was no significant difference in urinary histamine concentration before hydrodistention.) It is not clear how histamine released from mast cells, which are found in the muscularis well below the urothelial surface, would be able to reach the urine.
In contrast, functional characteristics of peripheral lymphocytes examined with flow cytometry did not support an autoimmune etiology (Miller et al., 1992). There was no discernible difference between normal and interstitial-cystitis patients with respect to the distribution of lymphocyte immunophenotypes before stimulation, after incubation with and without autologous urine and with and without mitogenic stimulation, or in activation of T cells. The investigators concluded that no primary immunologic disorder was evident in patients with IC and that urine, which might leak into the bladder if the urothelium were leaky, does not stimulate the immune system. However, studies of lymphocytes in bladder tissue showed that CD4-positive lymphocytes (helper T cells) predominated over CD8-positive lymphocytes (suppressor/cytotoxic T cells) in the lamina propria in IC and other forms of cystitis; in the urothelium, CD8-positive lymphocytes predominated in IC and CD4-positive lymphocytes predominated in bacterial and mechanical cystitis (MacDermott et al., 1991). That suggested that the urothelium was not involved in the inflammatory process in IC, and the authors therefore suggested that the initiating factor did not originate in the bladder lumen. Those findings seem to contradict findings of a slightly earlier study that produced distinct evidence of persistent inflammatory reactions in both peripheral and bladder lymphocytes (Harrington et al., 1990).
A recent study of markers of cellular activation in urothelial cells showed that urothelial cells from interstitial-cystitis patients expressed increased HLA-DR but not increased ICAM-l or IL-là (Liebert et al., 1993). Urothelial cells in culture respond to cytokine stimulation in the same way as most epithelial cells—that is, ICAM-l and HLA-DR increase simultaneously. The authors concluded that the simultaneous increase in ICAM-l and HLA-DR, although not peculiar to IC, might be a useful marker of this condition. The marker might indicate an unusual type of activation of the urothelial cells in IC.
Further evidence has also accumulated to support the theory that the urothelium becomes deficient in the protective layer of glycosaminoglycan. An extensive investigation of urinary concentrations of macromolecular uronate (a measure of glycosaminoglycan and proteoglycan content) as a marker
of IC showed that, as a group, subjects with the disorder had markedly less urinary macromolecular uronate than did normal controls. The median values in the two populations differed by a factor of 2. As suggested by earlier work with the acid-damaged rat-bladder model, the decrease is consistent with binding of glycosaminoglycan to damaged bladder epithelium, rather than with a specific effect of IC. In preliminary studies with a relatively unselected patient group at two centers, 58% sensitivity and 79% specificity were obtained with a diagnostic threshold of macromolecular uronate of 40 nmol/mL (Nickel et al., 1993). An investigation of the ultrastructure of the extensive cell-surface coating of the bladder-surface macromolecules with an antibody against bladder mucin to stabilize the layer showed no discernible difference in the depth or ultrastructure of the layer coating the umbrella-cell layer of urothelium. Any differences must therefore be in composition and would not affect structure.
Whether or not the layer is abnormal, the bladder epithelium in IC was again shown to be much more permeable than normal. In an extensive study of 31 normal persons and 56 with IC, a highly significant difference in bladder-surface permeability to urea was demonstrated between interstitial-cystitis patients and control urology patients (Fowler et al., 1988). In contradiction of an earlier report, no evidence of increased permeability to Tamm-Horsfall protein was found in the bladders of interstitial-cystitis patients. It should be noted that permeability to high-and low-molecular-weight substances might be quite different. A potential link between changes in permeability to low-molecular-weight substances and inflammation was suggested by results of a recent study that showed in a mouse model of autoimmune cystitis that permeability differences were similar to those reported by Parsons in humans (Parsons et al., 1991).
SUMMARY
The ideal cytologic marker of nephrotoxicity would represent a nonspecific, if not universal, cellular response to injury. Such a marker should be produced in the kidney and secreted into urine in a readily detectable form. Substantial changes in urinary concentration of the marker should correlate well with patho-physiologic or histopathologic manifestations of renal injury. The marker should be expressed soon after injury is sustained. Persistence of marker expression would increase its clinical value. The marker should be relatively easy to measure. It should be stable in storage, resistant to degradation, and unambiguously identifiable. In the search for suitable markers, more emphasis should be placed on the response to injury of tubules and interstitium, because these compartments appear to be the major sites of susceptibility to toxic injury. Finally, extensive use must be made of appropriate animal models to evaluate potential markers because complex responses of intact organisms (vis-a-vis) isolated systems) can influence response to injury, inflammation, and repair in vivo.
Several markers that fulfill many of the above criteria have already been identified. Urinalysis and clearance measurements will continue to provide important functional markers of renal injury. Of particular use in that regard would be a nonisotopic technique for analyzing iodothalamate or Cr-EDTA, both markers of glomerular filtration rate.
There is no ''ideal'' marker, i.e., a single marker able to provide all the information necessary to identify people at risk. The main priority for research should be the identification of strong markers that define preclinical, potentially dangerous disease. Addressing disease at this point minimizes costs, morbidity, and mortality and is now possible because of the availability of biologic markers. To achieve this, the following should be emphasized.
-
Interdisciplinary research will be needed in which clinical medicine, basic science, and statistics are combined. None of these fields is capable of proceeding alone.
-
Because strong markers are necessary for accurate clinical decision-making, funding of marker research should require that small studies demonstrating a high degree of separation of populations of interest be undertaken early in the marker-development process.
-
Multiple marker profiles are likely to be necessary to provide all the information needed for individual risk assessment.
-
Attention needs to be given to quality control and suitability of the method to use in a routine environment before large-scale clinical trials with a marker are attempted.
TABLE 4-1 Potential Markers of Cell Injury or Inflammation in the Kidneya
|
|
Detected As |
|
|
|
Kidney Tissue Siteb |
|
|||
|
Category |
RNA |
Product |
Disease |
Referenceb |
Species |
Glomeruli |
Tubules |
Other |
Urine |
|
CYTOKINES |
|||||||||
|
Tumor-necrosis factor |
|
x |
Purine amino-nucleoside nephrosis |
Diamond and Pesek, 1991 |
Mouse |
x |
|
|
|
|
|
|
x |
Immune-complex glomerulo-nephritis |
Noble et al., 1990 |
Rat |
x |
|
|
x |
|
|
|
x |
Anti-glomerular-basement-membrane nephritis |
Tipping et al., 1991a |
Rabbit |
x |
|
|
|
|
|
x |
x |
Lupus nephritis |
Boswell et al., 1988 |
Mouse |
x |
x |
|
|
|
|
|
x |
Polycystic kidneys |
Gardner et al., 1991 |
Human |
|
|
Cyst fluid |
|
|
Interleukin-l |
|
x |
Purine amino-nucleoside |
Diamond and Pesek, 1991 |
Rat |
x |
|
|
|
|
|
x |
x |
Immune-complex glomerulo-nephritis |
Noble et al., 1990 Werber et al., 1987 |
Rat |
|
|
|
x |
|
|
Detected As |
|
|
|
Kidney Tissue Siteb |
|
|||
|
Category |
RNA |
Product |
Disease |
Referenceb |
Species |
Glomeruli |
Tubules |
Other |
Urine |
|
|
|
x |
Anti-glomerular-basement-membrane |
Matsumoto and Hatano, 1989 |
Rat |
x |
|
|
|
|
|
|
x |
nephritis |
Tipping et al., 1991b |
Rabbit |
|
|
|
|
|
|
x |
x |
Lupus nephritis |
Boswell et al., 1988 |
Mouse |
x |
|
|
|
|
|
|
x |
Crescentic glomerulonephritis |
Matsumoto et al., 1988 |
Human |
x |
|
|
|
|
|
|
x |
Polycystic kidneys |
Gardner et al., 1991 |
Human |
|
|
Cyst fluid |
|
|
Interleukin-2 |
|
x |
Polycystic kidneys |
Gardner et al., 1991 |
Human |
|
|
Cyst fluid |
|
|
Interleukin-6 |
x |
x |
Mesangial proliferative glomerulo-nephritis |
Horii et al., 1989 |
Human |
x |
|
|
|
|
|
|
x |
Interstitial nephritis |
Fukatsu et al., 1991 |
Human |
|
x |
|
|
|
Monocyte chemotactic peptide |
x |
|
Renal ischemia |
Safirstein et al., 1991 |
Rat |
|
x |
|
|
|
|
Detected As |
|
|
|
Kidney Tissue Siteb |
|
|||
|
Category |
RNA |
Product |
Disease |
Referenceb |
Species |
Glomeruli |
Tubules |
Other |
Urine |
|
GROWTH FACTORS |
|||||||||
|
Platelet-derived growth factor |
x |
x |
Mesangial proliferative glomerulo |
Gesualdo et al., 1991 |
Human |
x |
|
|
|
|
|
x |
x |
nephritis |
Iida et al., 1991 |
Mouse |
x |
|
|
|
|
|
|
x |
|
Yoshimura et al., 1991 |
Rat |
x |
|
|
|
|
|
x |
x |
Partial nephrectomy |
Floege et al., 1992a |
Rat |
x |
|
|
|
|
|
x |
|
Ureteral obstruction |
Fries and Collins, 1992 |
Mouse |
|
|
Ureter |
|
|
|
x |
|
Lupus nephritis |
Nakamura et al., 1992 |
Mouse |
|
|
|
|
|
Insulin-like growth factor 1 |
x |
x |
Partial nephrectomy |
Lajara et al., 1989 |
Rat |
|
x |
|
|
|
|
|
x |
|
Stiles et al., 1985 |
|
|
|
|
|
|
|
Detected As |
|
|
|
Kidney Tissue Siteb |
|
|||
|
Category |
RNA |
Product |
Disease |
Referenceb |
Species |
Glomeruli |
Tubules |
Other |
Urine |
|
|
x |
|
Diabetes |
Flyvbjerg et al., 1990 |
Rat |
|
|
|
|
|
Transforming growth factor beta |
|
x |
Antiglomerular-basement-membrane nephritis |
Noh et al., 1991 |
Rabbit |
x |
|
|
x |
|
|
x |
|
Mesangial proliferative glomerulo-nephritis |
Okuda et al., 1990 |
Rat |
x |
|
|
|
|
|
x |
|
Purine amino-nucleoside nephrosis |
Jones et al., 1991 |
Rat |
|
|
|
|
|
Epidermal growth factor |
|
x |
Aminoglycoside nephrotoxicity |
Nonclereq et al., 1991 |
Rat |
|
x |
|
xc |
|
|
x |
x |
Cisplatin nephrotoxicity |
Safirstein et al., 1991 |
Rat |
|
x |
|
xc |
|
|
x |
x |
Renal ischemia |
Safirstein et al., 1989 |
Rat |
|
x |
xc |
|
|
|
|
x |
Diabetes |
Mathiesen et al., 1988 |
Human |
|
|
|
xc |
|
|
|
|
Ureteral obstruction |
Storch et al., 1992 |
Rat |
|
x |
|
|
|
|
Detected As |
|
|
|
Kidney Tissue Siteb |
|
|||
|
Category |
RNA |
Product |
Disease |
Referenceb |
Species |
Glomeruli |
Tubules |
Other |
Urine |
|
Epidermal growth factor (continued) |
x |
x |
Polycystic kidneys |
Gattone et al., 1990 |
Mouse |
|
x |
|
|
|
MATRIX COMPONENTS |
|||||||||
|
Collagens |
x |
x |
Purine amino-nucleoside nephrosis |
Jones et al., 1991 |
Rat |
x |
x |
Interstitium |
|
|
|
x |
x |
Cyclosporin A nephrotoxicity |
Wolff et al., 1990 |
Mouse |
|
x |
Interstitium |
|
|
|
x |
x |
Lupus nephritis |
Nakamura et al., 1991 |
Mouse |
x |
|
Interstitium |
|
|
|
x |
x |
Mesangial proliferative gloerulo-nephritis |
Floege et al., 1991 |
Rat |
x |
|
|
|
|
|
x |
x |
Antiglomerular-basement-membrane nephritis |
Merritt et al., 1990 |
Rabbit |
|
|
|
|
|
|
Detected As |
|
|
|
Kidney Tissue Siteb |
|
|||
|
Category |
RNA |
Product |
Disease |
Referenceb |
Species |
Glomeruli |
Tubules |
Other |
Urine |
|
|
x |
x |
Partial nephrectomy |
Floege et al., 1992b |
Rat |
x |
|
|
|
|
|
|
x |
Proliferative nephritis |
Yoshioka et al., 1989 |
Human |
x |
|
|
|
|
|
x |
x |
Polycystic kidneys |
Ebihara et al., 1981 |
Mouse |
|
|
Around cysts |
|
|
Laminin |
x |
x |
Purine amino-nucleoside nephrosis |
Jones et al., 1991 |
Rat |
x |
x |
Interstitium |
|
|
|
x |
x |
Lupus nephritis |
Nakamura et al., 1991 |
Mouse |
x |
|
Interstitium |
|
|
|
x |
x |
Mesangial proliferative glomerulo-nephritis |
Floege et al., 1991 |
Rat |
x |
|
|
|
|
|
x |
x |
Polycystic kidneys |
Ebihara et al., 1991 |
Mouse |
|
|
Around cysts |
|
|
Fibronectin |
x |
x |
Purine amino-nucleoside nephrosis |
Jones et al., 1991 |
Rat |
x |
x |
Interstitium |
|
|
|
|
x |
Partial nephrectomy |
Floege et al., 1992b |
Rat |
x |
|
|
|
|
|
Detected As |
|
|
|
Kidney Tissue Siteb |
|
|||
|
Category |
RNA |
Product |
Disease |
Referenceb |
Species |
Glomeruli |
Tubules |
Other |
Urine |
|
Fibronectin (continued) |
|
x |
Mesangial proliferative glomerulo-nephritis |
Okuda et al., 1990 |
Rat |
x |
|
|
|
|
Proteoglycans |
|
x |
Purine aminonucleoside nephrosis |
Jones et al., 1991 |
Rat |
xc |
x |
|
|
|
|
x |
x |
Lupus nephritis |
Nakamura et al., 1991 |
Mouse |
x |
|
|
|
|
|
|
x |
Partial nephrectomy |
Floege et al., 1990 |
Rat |
x |
|
|
|
|
|
|
x |
Mesangial proliferative glomerulo-nephritis |
Okuda et al., 1990 |
Rat |
x |
|
|
|
|
|
|
x |
Polycystic kidneys |
Ebihara et al., 1981 |
Mouse |
|
|
Around cysts |
|
|
PROCOAGULANT ACTIVITY |
|
x |
Antiglomerular basement-membrane nephritis |
Wiggins et al., 1985 |
Rabbit |
x |
|
|
x |
|
|
Detected As |
|
|
|
Kidney Tissue Siteb |
|
|||
|
Category |
RNA |
Product |
Disease |
Referenceb |
Species |
Glomeruli |
Tubules |
Other |
Urine |
|
|
|
x |
Mercury chloride nephropathy |
Kanfer et al., 1987 |
Rat |
x |
|
|
|
|
|
|
x |
Proliferative glomerulo-nephritis |
Tipping et al., 1998 |
Human |
|
|
|
x |
|
|
|
x |
Acute serum-sickness glomerulo-nephritis |
Tipping et al., 1987 |
Rabbit |
x |
|
|
|
|
LIPID MEDIATORS |
|||||||||
|
Prostanoids (cyclo-oxygenase products) |
|
x |
Mesangial prolifera-tive glomerulo-nephritis |
Gesualdo et al., 1992 Lianos et al., 1991 Stahl et al., 1990 |
Rat |
x(TxB2 )d |
|
|
|
|
|
|
x |
Membranous glomerulo-nephritis |
Rahman et al., 1988a |
Rat |
x(TxB2 )d |
|
Platelets |
|
|
|
|
x |
Lupus nephritis |
Kelley et al., 1986 |
Mouse |
|
|
|
|
|
|
|
|
Patrono et al., 1985 |
Human |
|
|
|
|
|
|
|
Detected As |
|
|
|
Kidney Tissue Siteb |
|
|||
|
Category |
RNA |
Product |
Disease |
Referenceb |
Species |
Glomeruli |
Tubules |
Other |
Urine |
|
Leukotrienes (lipoxygenase products) |
|
x |
Antiglomerular basement-membrane nephritis |
Fauler et al., 1989 Lefkowith et al., 1992 Lianos et al., 1985 Rahman et al., 1988b |
Rat |
x(LTB4, 12 HETE) |
|
|
x(LTB4 ) |
|
|
|
x |
Mesangial proliferative nephritis |
Oberle et al., 1992 |
Ratx |
(LTB4, 12 HETE) |
|
Platelets |
|
|
|
|
x |
Membranous glomerulo-nephritis |
Rahman et al., 1988b |
Rat |
x(LTB4 ) |
|
|
|
|
|
|
x |
Lupus nepbritis |
Spurney et al., 1991 |
Mouse |
x(LTB4, LTC4 ) |
|
|
|
|
Platelet-activating factor |
|
x |
Membranous glomerulo-nephritis |
Noris et al., 1991 |
Human |
|
|
|
x |
|
|
Detected As |
|
|
|
Kidney Tissue Siteb |
|
|||
|
Category |
RNA |
Product |
Disease |
Referenceb |
Species |
Glomeruli |
Tubules |
Other |
Urine |
|
|
|
x |
Antiglomerular basement-membrane nephritis |
Bertani et al., 1987 Lions and Zanglis, 1990 |
Rat |
x |
|
|
|
|
REACTIVE SPECIES OF OXYGEN AND NITROGEN |
|||||||||
|
Oxygen(O-2, H2 O2, OH) |
|
x |
Immune-complex glomerulo-nephritis |
Cook et al., 1987 |
Rat |
x |
|
|
|
|
|
|
x |
Mesangial proliferative nephritis |
Oberle et al., 1992 |
Rat |
x |
|
|
|
|
|
|
x |
Antiglomerular basement-membrane nephritis |
Boyce et al., 1989 |
Rabbit |
x |
|
|
|
|
Nitrogen(NO-2, NO-2, NO) |
|
x |
Antiglomerular basement-membrane nephritis |
Cattell et al., 1990 |
Rat |
x |
|
|
x |
|
MAJOR HISTOCOMPATIBILITY ANTIGENS |
|
x |
Immune-complex glomerulo-nephritis |
Noble et al., 1990 |
Rat |
x |
|
|
|
|
|
Detected As |
|
|
|
Kidney Tissue Siteb |
|
|||
|
Category |
RNA |
Product |
Disease |
Referenceb |
Species |
Glomeruli |
Tubules |
Other |
Urine |
|
MAJOR HISTOCOMPATIBILITY ANTIGENS (continued) |
|
x |
Puromycin aminonucleoside nephrosis |
Schreiner et al., 1984 |
Rat |
x |
|
|
|
|
|
|
x |
Antiglomerular-basement-membrane nephritis |
Schreiner et al., 1984 |
Rat |
x |
|
|
|
|
|
|
x |
Mercury chloride nephropathy |
Aten et al., 1988 |
Rat |
|
x |
Interstitial cells |
|
|
|
x |
x |
Lupus nephritis |
Boucher et al., 1986 Halloran et al., 1988 |
Mouse |
|
x |
Interstitial |
|
|
|
|
x |
|
Wuthrich et al., 1989 |
Human |
|
x |
|
|
|
|
x |
x |
Renal ischemia |
Shoskes et al., 1990 |
Mouse |
|
x |
Interstitial cells |
|
|
|
Detected As |
|
|
|
Kidney Tissue Siteb |
|
|||
|
Category |
RNA |
Product |
Disease |
Referenceb |
Species |
Glomeruli |
Tubules |
Other |
Urine |
|
|
|
x |
Proliferative glomerulonephritis |
Müller et al., 1987 |
Human |
|
x |
Interstitial cells |
|
|
TRANSCRIPTION FACTORS |
x |
|
Ischemia |
Ouellette et al., 1990 |
Rat |
|
x |
|
|
|
|
x |
|
|
Rosenberg and Paller, 1971 |
Rat |
|
x |
|
|
|
|
x |
|
|
Safirstein et al., 1990 |
Mouse |
|
x |
|
|
|
|
x |
|
Polycystic kidneys |
Cowley et al., 1987 |
Mouse |
|
x |
|
|
|
|
x |
|
Folic acid toxicity |
Cowley et al., 1987 |
Mouse |
|
x |
|
|
|
|
|
|
|
Cowley et al., 1989 |
|
|
|
|
|
|
|
|
|
|
Kujubu et al., 1991 |
|
|
|
|
|
|
|
x |
|
Partial nephrectomy |
Aulitzky et al., 1992 |
Mouse |
|
|
|
|
|
|
Detected As |
|
|
|
Kidney Tissue Siteb |
|
|||
|
Category |
RNA |
Product |
Disease |
Referenceb |
Species |
Glomeruli |
Tubules |
Other |
Urine |
|
MISCELLANEOUS |
|||||||||
|
Complement C5b-9 |
|
x |
Membranous glomerulonephritis |
Pruchno et al., 1989 |
Human |
x |
|
|
x |
|
|
|
x |
|
Schulze et al., 1991 |
Rat |
x |
|
|
x |
|
Endothelin |
|
x |
Proliferative glomerulonephritis |
Ohta et al., 1991 |
Human |
|
x |
|
x |
|
Vimentin |
|
x |
1,2-Dichlorovinyl cysteine toxicity |
Wallin et al., 1992 |
Rat |
|
x |
|
|
|
|
|
x |
Daunomycin nephrosis |
Gröne, et al., 1987 |
Rat |
|
x |
|
|
|
|
|
x |
Mercury chloride toxicity |
Gröne, et al., 1987 |
Rat |
|
x |
|
|
|
Intercellular adhesion molecule 1 |
x |
x |
Lupus nephritis |
Wuthrich et al., 1990 |
Mouse |
x |
x |
Vessels |
|
|
Cystatin |
|
x |
Isoproterenol treatment |
Cohen et al., 1990 |
Rat |
|
x |
|
|
|
|
Detected As |
|
|
|
Kidney Tissue Siteb |
|
|||
|
Category |
RNA |
Product |
Disease |
Referenceb |
Species |
Glomeruli |
Tubules |
Other |
Urine |
|
|
|
x |
Sodium chromate nephrotoxicity |
Colle et al., 1984 Esnard et al., 1988 |
Mouse |
|
|
|
x |
|
Heat-shock proteins |
|
x |
Mercury chloride toxicity |
Goering et al., 1992 |
Rat |
|
x |
|
|
|
|
x |
x |
Ischemia |
Emami et al., 1991 Sawczuk et al., 1987 |
Rat |
|
x |
|
|
|
|
|
x |
Heat stress |
Emami et al., 1991 |
Rat |
|
x |
|
|
|
Clusterin |
x |
x |
Prostatic involution |
Bandyk et al., 1990 |
Rat |
|
|
Prostatic epithelium |
x |
|
|
|
|
|
Buttyan et al., 1989 |
Rat |
|
|
|
|
|
|
x |
x |
Ureteral obstruction |
Buttyan et al., 1989 |
Rat |
x |
|
|
|
|
|
x |
|
Ischemia |
Rosenberg and Paller, 1971 |
Rat |
|
|
|
|
|
|
|
x |
Gentamicin toxicity |
Aulitzky et al., 1992 |
Rat |
|
|
|
x |
TABLE 4-2 Potential Sources of Biologic Markers of Cell Injury or Inflammation in Renal-Tissue Samples
|
Microanatomic Compartment |
Molecules* |
|
Glomerular mesangium |
PDGF, IL-1, IL-6, IL-8, PAF, IGF-1, TNFα, MCP-1, TGFβ, endothelin, prostaglandins, O2 and NO metabolites, MHC antigens, adhesion molecules |
|
Tubular epithelium |
TNFα, endothelin, MHC antigens, EGF, uromodulin, adhesion molecules |
|
Endothelium |
PDGF, PAF, MHC antigens, endothelin, adhesion molecules |
|
Bone-marrow-derived cells (glomerular mesangium, interstitium, infiltrates) |
PDGF, IL-1, IL-6, TNFα, TGFβ, PDGF, PAF, IGF-1, MHC antigens, eicosanoids, O2 and NO metabolites |
|
* Abbreviations: MHC = major histocompatibility; PAF = platelet-activating factor; PDGF = platelet-derived growth factor; IL = interleukin; IGF = insulin-like growth factor; TNF = tumor-necrosis factor; TGF = transforming growth factor; EGF = epidermal growth factor; MCP = monocyte chemotactic peptide A wide variety of hormone-like proteins and biologic-response modifiers can be produced in the kidney as a response to cell damage and tissue inflammation. Although bone-marrow-derived mononuclear cells are a major and well-studied source of those molecules, many might be produced by intrinsic kidney cells as well. This table summarizes a large (and rapidly growing) literature documenting possible intrarenal sources of some biologic markers of cell injury that might have clinical value. Glomerular sites of synthesis of individual molecules have been relatively easy to identify because glomeruli are readily separated from other kidney tissue components for extractions, tissue culture, and other analytic procedures. Tubular, interstitial, and vascular cells have been less amenable to detailed investigation, although recent advances in tissue-culture methods suggest that the metabolic and synthetic capacity of the specialized kidney cells outside the glomerulus will soon be more completely characterized. |
|
TABLE 4-3 Potential Biologic Markers of Renal Cancer
|
Marker |
References |
|
Clinical and pathologic markers |
|
|
Nuclear grade |
Fuhrman et al., 1982; Medeiros et al., 1988; Madeiros and Weiss, 1990; Selli et al., 1983 |
|
Tumor size |
Fuhrman et al., 1982; Medeiros et al., 1988; Madeiros and Weiss, 1990; Selli et al., 1983 |
|
Tumor stage |
Fuhrman et al., 1982; Libertino et al., 1987; McNichols et al., 1981; Medeiros et al., 1988; Robson et al., 1969; Skinner et al., 1971; Waters and Richie, 1979 |
|
Morphometric markers |
|
|
Nuclear abnormalities |
Tosi et al., 1986 |
|
Quantitative morphometry |
Tarnowski et al., 1993; Unger et al., 1993; vanden Houte et al., 1991 |
|
Proliferative markers |
|
|
BrDU |
Rew et al., 1991 |
|
DNA ploidy |
Baisch et al., 1985, 1990; Bringuier et al., 1993; el-Naggar, et al., 1994; Grignon et al., 1989; Kloppel et al., 1986; Kumar and Kumar et al., 1993; Lanigan et al., 1993; Leyh et al., 1992; Ljungberg et al., 1956; Oosterwijk et al., 1988; Rainwater et al., 1987, 1991; van Leeuwen et al., 1987; Veloso et al., 1992; Yoshida et al., 1986 |
|
Ki-67 |
Baretton, et al., 1991; Chow et al., 1993; de Riese et al., 1993; Kaiser et al., 1991 |
|
PCNA |
Delahunt et al., 1993; Hiaish et al., 1993; Lipponen et al., 1994; Tanioka et al., 1993 |
|
Ploidy S-phase |
al-Abadi and Nagel 1988; Baretton et al., 1991; Ellis et al., 1992; Kieseweter et al., 1987; Larsson et al., 1993; Masters et al., 1992; Rew et al., 1991; Tanioka et al., 1993; Yu et al., 1991, 1993 |
|
Marker |
References |
|
Growth factors |
|
|
EGF and EGF receptor |
Chow et al., 1993; Fuse et al., 1992; Ishikura et al., 1991; Kaiser et al., 1991; Kimball et al., 1984; Kotake and Kinouchi 1994; le Coutre et al., 1992; Narayan and Roy, 1992; Tokito et al., 1991; Volm et al., 1993; Weidner et al., 1990 |
|
Endothelin-2 (ET-2) |
Ohkubo et al., 1990; Onda et al., 1991; Shinmi et al., 1993; Tokito et al., 1991; Yorimitsu et al., 1992 |
|
fgf |
Fujimoto et al., 1991; Herrera, 1991 |
|
tgf-alpha and tgf-beta |
Gomella. et al., 1989; Herrera et al., 1991; Kimball et al., 1984; Kotake and Kinouchi, 1994; le Coutre et al., 1992; Mydlo et al., 1989; Petrides et al., 1990; Thalacker and Nilsen-Hamilton, 1987 |
|
tnf |
Dosquet et al., 1994; Muraki and Nakazano, 1992; Wade et al., 1989 |
|
IFN |
Hoogstraten et al., 1982; Nagata, 1993 |
|
IGF |
Martinerie and Perbal, 1991; Zumkeller et al., 1993 |
|
p170-glycoprotein |
Eguchi et al., 1992; Rochlitz et al., 1992 |
|
p-glycoprotein |
Inoue et al., 1989; Lizard et al., 1992; Moll et al., 1993; Moriyama et al., 1991; Nakagawa et al., 1994; Sato et al., 1990; Volm et al., 1993; Yamazaki et al., 1988, 1991 |
|
Oncogenes |
|
|
c1 4-2 |
Boldog et al., 1991 |
|
c-etsl |
Wemert et al., 1992 |
|
erb (c-erbB-2) |
Herrera, 1991; Lipponen et al., 1994; Lunec et al., 1992 |
|
Marker |
References |
|
fos, abl |
Peter, 1991; Sunderman et al., 1990 |
|
myc |
Drabkin et al., 1985; Gemmill et al., 1989; Kinouchi et al., 1989; Kotake and Kinouchi, 1994; Martinerie et al., 1992; Weidner et al., 1990; Yao et al., 1988 |
|
neu |
Rotter et al., 1992; Toyoshima, 1990 |
|
ras (p2l) |
Karthaus et al., 1987; Kumar et al., 1991; Mannens et al., 1987; Nanus et al., 1989; Ohgaki et al., 1991; Trapman, 1992; Volm et al., 1993; Waber et al., 1993; Weiss et al., 1991 |
|
src |
Nanus et al., 1991 |
|
Tumor-suppressor genes |
|
|
p53 |
Bot et al., 1994; Brooks et al., 1993; Haber and Buckler 1992; Lipponen et al., 1994; Suzuki and Tamura 1993; Suzuki et al., 1992; Trapman, 1992; Weghorst et al., 1994 |
|
Rb |
Brooks et al., 1993; Horikawa and Oshimura, 1991; Sabatier et al., 1989; Strong, 1993; Trapman; 1992; Waber et al., 1993 |
|
Cytogenetics |
|
|
CA50 |
Hershman et al., 1987 |
|
CEA |
Akaza et al., 1987; Blouin et al., 1989; Cisternino et al., 1986; Lanzafame et al., 1986; Martin et al., 1976; Popper et al., 1987; Uchida et al., 1986 |
|
Marker |
References |
|
Chromosome 3 |
Anglard et al., 1991; Boldog et al., 1991; Brauch et al., 1990; Dietrick and Droz, 1992; Erlandsson et al., 1990, 1991a,b; Fournet et al., 1992; Fuzesi and Cober 1992; Glenn et al., 1991; Hoogstraten et al., 1982; Kohno et al., 1993; Kovacs et al., 1989a, 1991a; Ljungberg et al., 1991; Presti et al., 1991, 1993; Sugao et al., 1992; Szymanski et al., 1993; Teyssier and Ferre, 1990; van der Hout et al., 1993; Yamakawa et al., 1991 |
|
Chromosome 5 |
Hino et al., 1993; Jordan et al., 1989; Kovacs et al., 1987; Morita et al., 1991; Presti et al., 1991 |
|
Chromosome 7 |
Dal Cin et al., 1992; Emanuel et al., 1992; Hughson et al., 1993; Kovacs et al., 1991 b; Limon et al., 1990; Ljungberg et al., 1991; Maloney et al., 1991; Miles et al., 1988; Nordenson et al., 1988; Sugao et al., 1992; Weaver et al., 1988; Yoshida et al., 1988 |
|
Chromosome 16 |
Green et al., 1994; Grundy et al., 1994; Huff et al., 1992; Maw et al., 1992 |
|
Chromosome 17 |
Anglard et al., 1991; Bergerheim et al., 1989; Haugen et al., 1990; Kovacs, 1989; Kovacs et al., 1991b; Ogawa et al., 1992; Presti et al., 1991; Reiter et al., 1993 |
|
Chromosome Y |
Dal Cin et al., 1989; Jordan et al., 1989; Kovacs et al., 1991b; Walker et al., 1992 |
|
Chromosome 12 |
Annab et al., 1992; Parshad et al., 1992 |
|
Chromosome 14 |
Boehm et al., 1988; Davis et al., 1991; Finver et al., 1989; Fournet et al., 1992; Royer-Pokora et al., 1989 |
|
Chromosome 18 |
Casalone et al., 1992; Grollino et al., 1993; Presti et al., 1991 |
|
Chromosome 20 |
Kovacs et al., 1989b |
|
Chromosome 21 |
Nanus et al., 1989 |
|
Marker |
References |
|
Cytokeratins |
Blouin et al., 1989; Dierick et al., 1991; Droz et al., 1990; Kaiser et al., 1991; Kumar and Kumar, 1993; Kumar et al., 1988; Popper et al., 1987; Schroder et al., 1992 |
|
Double minutes |
Moriyama-Gonda et al., 1991 |
|
Exo-l |
Klingel et al., 1992 |
|
Fibronectin |
Kloppel et al., 1986 |
|
Glutathione S-transferase |
Grignon et al., 1994; Kurokawa et al., 1990; Sabatier et al., 1989; Volm et al., 1993 |
|
IL-6 |
Koo et al., 1992; Miki et al., 1989; Sabatier et al., 1989; Takenawa et al., 1991 |
|
leu-7 |
Schroder et al., 1992 |
|
PDGF |
Ambrus et al., 1992 |
|
Pepsinogen II (PG II) |
|
|
Polyamines |
Balitskaia et al., 1992; Koide, 1992 |
|
Tissue plasminogen activator (TPA) |
Blouin et al., 1989; Gohji et al., 1990; Hata, 1989; Popper et al., 1987; Yamazaki et al., 1988, 1991 |
|
Tumor-associated antigens |
|
|
C219 |
Rochlitz et al., 1992 |
|
Uromonoclonals |
Bander et al., 1989; Blouin et al., 1989; Cohen et al., 1988; Gu et al., 1991; Hashimura et al., 1989; Kerr et al., 1990; Yagoda and Bander, 1989 |
|
Serum markers |
|
|
CRP |
Blay et al., 1992 |
|
Erythropoietin |
Da Silva et al., 1990; Rigatti et al., 1990 |
|
fgf |
Fujimoto et al., 1991 |
|
gamma-Enolase |
Takashi et al., 1988 |
TABLE 4-4 Potential Biologic Markers of Bladder Cancer
|
Marker |
References |
|
Clinical and pathologic markers |
|
|
Dysplasia |
Berman et al., 1991 |
|
Host inflammatory response |
Levin et al., 1991; Nouri et al., 1991; Tomita et al., 1990 |
|
Morphologic variants of cancer |
Christopher et al., 1991; Fossa, 1992 |
|
Tumor volume |
Herr, 1992; Lee et al., 1993 |
|
Tumor stage |
Escudero Barrilero et al., 1991 |
|
Tumor grade, WHO |
Jordan et al., 1987 |
|
Morphometric markers |
|
|
Chromatin abnormalities |
Van Velthoven et al., 1994 |
|
Nuclear abnormalities |
Lipponen and Eskelinen, 1990; Lipponen et al., 1991a, 1992; Nielsen et al., 1988; Sanchez-Fernandez de Sevilla et al., 1992; van der Poel et al., 1991 |
|
Nucleolar abnormalities |
Cairns et al., 1989; Hitmair et al., 1994; Neilsen et al., 1988 |
|
Proliferative markers |
Cohen et al., 1993 |
|
BrDU |
Hattori et al., 1988; Waldman et al., 1993 |
|
Ki-67 |
Mulder et al., 1992 |
|
p105 |
Horowitz et al., 1990 |
|
PCNA |
Malmstrom et al., 1992; Waldman et al., 1993 |
|
Ploidy S-phase fraction |
Lipponen et al., 1991b; Wheeless et al., 1993 |
|
Ploidy analysis and genetic markers |
Trapman, 1992 |
|
Chromosome I |
Borland et al., 1992; Hopman et al., 1991 |
|
Chromosome 3 |
Kao et al., 1919; Klingelhutz et al., 1992 |
|
Chromosome 5 |
Borland et al., 1992 |
|
Marker |
References |
|
Chromosome 7 |
Berrozpe et al., 1990; Borland et al., 1992; Hopman et al., 1991; Waldman et al., 1991 |
|
Chromosome 9 |
Borland et al., 1992; Hopman et al., 1991; Tsai et al., 1990 |
|
Chromosome 11 |
Borland et al., 1992; Fearon et al., 1985; Hopman et al., 1991; Kao et al., 1919; Proctor et al., 1991; Tsai et al., 1990 |
|
Chromosome 17 |
Borland et al., 1992; Olumi et al., 1990; Tsai et al., 1990 |
|
DNA ploidy |
Bonner et al., 1993; Gerber et al., 1991; Hemstreet et al., 1991; Koss and Czerniak; 1992; Montironi et al., 1987; van der Poel et al., 1991; West et al., 1987; Wheeless et al., 1993 |
|
erb-B2 |
Coombs et al., 1991; Gardiner et al., 1992; Lunec et al., 1992; Moriyama et al., 1991b; Serio, 1991; Wright et al., 1991 |
|
Loss of heterozygosity |
Brewster et al., 1994; Cairns et al., 1991; Ishikawa et al., 1991; Oka et al., 1991 |
|
myc |
Kotake et al., 1990 |
|
neu (p185) |
Rao et al., 1993; Wood et al., 1991 |
|
p53 |
Borland et al., 1992; Fujimoto et al., 1992; Lunec et al., 1992; Morkve and Hostmark, 1991; Oka et al., 1991; Sidransky et al., 1991; Trapman, 1992; Wright et al., 1991 |
|
ras (p21) |
Borland et al., 1992; Enomoto et al., 1990; Grimmond et al., 1992; Miao et al., 1991; Nagata et al., 1990; Pratt, et al., 1992; Saito, 1992; Theodorescu et al., 1991; Wang, 1991 |
|
Rb |
Borland et al., 1992; Cairns et al., 1991; Goodrich et al., 1992; Horowitz et al., 1990; Ishikawa et al., 1991; Trapman, 1992 |
|
src |
Fanning et al., 1992 |
|
Marker |
References |
|
Growth factors |
|
|
e-cadherin |
Bringuier et al., 1993 |
|
EGF and EGF receptor |
Fuse et al., 1992, Harney et al., 1991 a,b; Ishikura et al., 1991; Kageyama et al., 1991; Messing et al., 1987; Neal et al., 1989, 1990; Rao et al., 1993; Smith et al., 1989; Theodorescu et al., 1991; Wood et al., 1992 |
|
fgf |
Ravery et al., 1992; Valles et al., 1990 |
|
P-glyprotein |
Kageyama et al., 1991; Moriyama et al., 1991a |
|
Plasminogen activator |
Hasui et al., 1992; Hiti et al., 1990; See, 1992 |
|
tgf-beta and tgf-alpha |
Hiti et al., 1990; Kawamata et al., 1992 |
|
tnf |
Hitti et al., 1990 |
|
Differentiation |
|
|
amf |
Javadpour and Guirguis, 1992; Nabi et al., 1992 |
|
Cytokeratin |
Basta et al., 1988; el-Mohamady et al., 1991; Helmy et al., 1991; Konchuba et al., 1992; Schaafsma et al., 1990; Sumi et al., 1990 |
|
ECP |
Lose and Frandsen, 1989 |
|
EMA |
Ring et al., 1990 |
|
F-actin |
Rao et al., 1991, 1993 |
|
G-actin |
Rao et al., 1993 |
|
PNA, WGA |
Orntoft et al., 1988 |
|
Blood-group antigens |
|
|
ABH |
Das and Glashan, 1988; Das et al., 1986; Limas, 1990; Malmstrom et al., 1991; Orntoft et al., 1988; Sanders et al., 1991; Tichy et al., 1991; Yamada et al., 1991 |
|
Marker |
References |
|
Due ABC 3 |
Decken et al., 1992 |
|
HLA |
Cordon-Cardo et al., 1991; Eryigit and Kirkali, 1990; Levin et al., 1991, 1992; Nouri et al., 1990; Tomita et al., 1990 |
|
Lewis-X |
Limas, 1991; Matsusako et al., 1991 |
|
Lewis antigens |
Fradet et al., 1990a; Langkilde et al., 1991a,b; Limas, 1991; Matsusako et al., 1991 |
|
Tumor-associated antigens |
|
|
10D1 |
Hijazi et al., 1989 |
|
12F6 |
Hijazi et al., 1989 |
|
19A211 |
Cordon-Cardo et al., 1992; Fradet et al., 1990a |
|
2A6 |
Messing et al., 1984 |
|
2E1 |
Messing et al., 1984 |
|
3-48-2, 48-1, 3-50-3 |
Summerhayes et al., 1985 |
|
3-71-1, 94-3 |
Summerhayes et al., 1985 |
|
3C6 |
Summerhayes et al., 1985 |
|
3G2-C6 |
Lin et al., 1988; Young et al., 1985 |
|
4-72-2 |
Summerhayes et al., 1985 |
|
486P 3/12 |
Arndt et al., 1987; Huland et al., 1990, 1991 |
|
6D1 |
Hijazi et al., 1989 |
|
7C12 |
Hijazi et al., 1989 |
|
8-30-3, 771-, 2-94-2 |
Summerhayes et al., 1985 |
|
9A7 |
Messing et al., 1984 |
|
AN43 |
Liebert et al., 1989 |
|
BB369 |
Liebert et al., 1989 |
|
Marker |
References |
|
BIUH4, BIUH6, BIUH9 |
Guo, 1992 |
|
BL 2-10D1 |
Longin et al., 1989 |
|
BLCA-8 |
Lose and Frandsen, 1989; Walker et al., 1989 |
|
C3 |
Young et al., 1985 |
|
CA50 |
Morote et al., 1990 |
|
CEA |
Boileau et al., 1987; Morote et al., 1990; Piana et al., 1991 |
|
DD23 |
Bonner et al., 1995; Grossman et al., 1992 |
|
G4,E7 |
Chopin et al., 1985 |
|
GF 26.7.3 |
Baricordi et al., 1985 |
|
HBA4, HBE3 |
Masuko et al., 1984 |
|
HBE10 |
Masuko et al., 1984 |
|
HBF2 |
Masuko et al., 1984 |
|
HBG9 |
Masuko et al., 1984 |
|
HBH8 |
Masuko et al., 1984 |
|
J143 |
Fradet et al., 1984, 1986 |
|
M344 |
Bonner et al., 1993; Cordon-Cardo et al., 1992; Fradet et al., 1987; Rao et al., 1993 |
|
Mano 4/4 |
Arndt et al., 1987 |
|
OM5 |
Fradet et al., 1984, 1986, 1990b |
|
P7 A 5-4 |
Ben-Aissa et al., 1985 |
|
RBS-31, RBS-85, RBA-1, HBP-1 |
Masuko et al., 1989 |
|
SK 4H-12 |
Ben-Aissa et al., 1985 |
|
T16 |
Bretton et al., 1989; Fradet et al., 1984, 1986, 1990b |
|
T23 |
Fradet et al., 1984, 1986 |
TABLE 4-5 Potential Biologic Markers of Prostatic Cancer
|
Marker |
References |
|
Clinical and pathologic markers |
|
|
Atypical adenomatous hyperplasia |
Bostwick et al., 1993 |
|
Hyperplasia metaplasia atrophy |
Morote et al., 1986 |
|
Host inflammatory response |
van Weerden et al., 1993 |
|
Morphologic variants of cancer |
Davies et al., 1988; Lloyd et al., 1992; Partin et al., 1989 |
|
Prostatic intraepithelial neoplasia |
Montironi et al., 1990 |
|
Tumor grade, (Gleason grade, nuclear grade) |
Abrahamsson et al., 1987 |
|
Tumor stage |
Azzopardi and Evans, 1971; Thompson, 1990 |
|
Tumor volume |
Helpap, 1988 |
|
Morphometric markers |
|
|
Chromatin abnormalities |
Shah et al., 1987 |
|
Nuclear abnormalities |
Shah et al., 1987; Umbas et al., 1992 |
|
Nuclear abnormalities |
Wenk et al., 1977 |
|
Nuclear organizer region |
McNeal et al., 1988a |
|
Proliferative markers |
|
|
BrDU |
Abrahamsson et al., 1989; Ercole et al., 1987 |
|
Ki-67 |
Ercole et al., 1987; Shah et al., 1991; Thompson, 1990 |
|
PCNA |
Sherwood et al., 1990 |
|
Ploidy S phase |
Gittes, 1987; Grignon and Wright, (in press); Sporn, 1992; Stege et al., 1992 |
|
Thymidine labeling |
Lovern et al., 1975 |
|
Growth factors |
|
|
egfr |
Eaton et al., 1988; McManus et al., 1976; Sacks et al., 1975 |
|
Marker |
References |
|
fgf |
Schiebler et al., 1992; Visakorpi et al., 1991 |
|
IGF, NGF, PDGF, KGF |
Visakorpi et al., 1991 |
|
tgf |
Fjellestad-Paulsen et al., 1988; Ito et al., 1988; Mellon et al., 1992; Schiebler et al., 1992; Tsukamoto et al., 1988 |
|
tnf |
Fruehauf and Sinha, 1992 |
|
Oncogenes |
|
|
erb (c-erbB-2) |
McManus et al., 1976 |
|
myc |
Schiebler et al., 1992; Voeller et al., 1991 |
|
neu (p 185) |
Bostwick et al., 1994; Kuhn et al., 1993; Latil et al., 1994; Sadasivan et al., 1993; Veltri et al., 1994; Zhau et al., 1994 |
|
ras (p21) |
Amico et al., 1991; Morote Robles and Ruibal Morell, 1987; Schiebler et al., 1992; Yoshiki et al., 1987 |
|
src, fos, abl |
Visakorpi et al., 1991 |
|
Tumor-suppressor genes |
|
|
p53 |
Amico et al., 1991; Epstein and Lieberman, 1985; McManus et al., 1976; Voeller et al., 1991 |
|
Rb |
Amico et al., 1991 |
|
Neuroendocrine differentiation |
|
|
ACTH |
Bauer, 1988; Eble and Epstein, 1990; Fox et al., 1993; Fukutani et al., 1983; Hagood et al., 1991; Nemoto et al., 1990; Park et al., 1987; Purnell et al., 1984; Rubenstein et al., 1988; Sellwood et al., 1969; Tarle and Rados, 1991; Vuitch and Mendelsohn, 1981 |
|
ADH |
Doctor et al., 1986; Guinan et al., 1989; Newmark et al., 1973 |
|
Aldosterone |
Clar-Blanch et al., 1992 |
|
Marker |
References |
|
alpha-HCG |
Eble and Epstein, 1990 |
|
Argentaffin |
Turbat-Herrera et al., 1988, Weaver et al., 1992 |
|
beta-Endorphins |
Eble and Epstein, 1990; Nemoto et al., 1990 |
|
beta-HCG |
Eble and Epstein, 1990; Maddy et al., 1989; Nabi et al., 1992; Sesterhenn et al., 1991; Sukumar et al., 1991; Tawfic et al., 1993; Webster et al., 1959 |
|
BOM |
Helpap, 1980; Purnell et al., 1984 |
|
Bombesin (GRP) |
Maddy et al., 1989 |
|
Calcitonin |
Bauer, 1988; Eble and Epstein, 1990; Eskelinen et al., 1991; Fox et al., 1993; Fuse et al., 1991; Heim et al., 1977; Helpap, 1980; Maddy et al., 1989; Purnell et al., 1984; Sarkar et al., 1992 |
|
CGRP |
Fuse et al., 1991 |
|
Chromogranin |
Bostwick et al., 1993; Maddy et al., 1989 |
|
Corticotropin |
Fox et al., 1993 |
|
Enkephalin |
Eble and Epstein, 1990 |
|
Glucagon |
Eble and Epstein, 1990; Maddy et al., 1989; Purnell et al., 1984 |
|
Glucocorticoids |
Clar-Blanch et al., 1992 |
|
HIAA |
Radjaipour et al., 1994 |
|
Lipofuscin |
Weaver et al., 1992 |
|
Neuron-specific enolase |
Maddy et al., 1989; Shalitin et al., 1991 |
|
Parathormone |
Fuse et al., 1991; Purnell et al., 1984 |
|
Prolactin |
Maddy et al., 1989 |
|
Marker |
References |
|
Serotonin |
Broder et al., 1977; Eble and Epstein, 1990; Eskelinen et al., 1991; Helpap, 1980; Maddy et al., 1989; Purnell et al., 1984; Sassine and Schulman, 1992 |
|
Somatostatin |
Eaton, et al., 1988; Eble and Epstein, 1990; Eskelinen et al., 1991; Maddy et al., 1989; Purnell et al., 1984 |
|
TSH |
Eble and Epstein, 1990; Maddy et al., 1989 |
|
Other proteins |
|
|
amf |
Coombes et al., 1974; Mahadevia et al., 1983; Watanabe et al., 1988 |
|
CA50 |
di Sant' Agnese and de Mesy Jensen, 1987; |
|
Cadherins |
Delaere et al., 1988; Scrivner et al., 1991 |
|
Cathepsin B |
Buck et al., 1992; Guenette et al., 1994; Hasnain et al., 1992 |
|
CEA |
di Sant' Agnese and de Mesy Jensen, 1987; Milani et al., 1986; Morote et al., 1990; Papapetrou et al., 1980 |
|
Cytokeratins |
Boag and Young, 1992; Jarrett et al., 1964; Partin et al., 1993; Perlman and Epstein, 1990; Shulkes et al., 1991 |
|
Glutathione S-transferase |
Capella et al., 1981 |
|
Inhibin |
Fekete et al., 1989 |
|
leu-7 |
Grasso, 1952 |
|
nmp |
Kleer et al., 1993 |
|
5'-Nucleotidase |
Pretlow et al., 1994 |
|
Ornithine decarboxylase |
Wu et al., 1994 |
|
PD-41 |
Bostwick, 1990 |
|
Pepsinogen II (PG II) |
Grasso, 1952 |
|
Marker |
References |
|
Polyamines |
Doctor et al., 1986; Manteuffel-Cymbrorwska, 1993; Ryzlak et al., 1992 |
|
Tissue inhibitor metalloproteinases (TIMPI–III) |
Baker et al., 1994; Knox et al., 1993; Stearns and Wang, 1994; Stetler-Stevenson et al., 1993 |
|
Tissue plasminogen activator (TPA) |
Grasso, 1952 |
|
Type IV collagenase |
Epstein and Woodruff, 1986 |
|
Blood-group antigens |
|
|
A and B |
Bussemakers et al.,1991 |
|
Lewis-X antigen |
Bussemakers et al., 1991 |
|
Serum markers |
|
|
gamma-Seminoprotein |
Akimoto, et al., 1988; Anonymous, 1985; McNeal et al., 1988b; Molland, 1978; Oesterling, 1991; Tetu et al., 1989; Trapman, 1992; Wang and Kawaguchi, 1987 |
|
p2l (not ras) |
Beckett et al., 1993 |
|
PAP |
Bostwick, 1989; Cantrell et al., 1981; Gleason, 1990; McNeal et al., 1988b; Miki et al., 1980; Oesterling, 1991; Piana et al., 1991; Sade and Barrack, 1991; Steiner and Barrack, 1992; van Dalen et al., 1988; Weber and Rohner, 1987; Wise et al., 1965 |
|
PSA |
Bookstein et al., 1993; Cantrell et al., 1981; di Sant' Agnese, 1988, 1992; Gleason, 1990; Miki et al., 1980; Nagle et al., 1991; Ohashi et al., 1987; Rojas-Corona et al., 1987; Sherwood et al., 1991; Shinoda et al., 1988; Stamey et al., 1987; Steiner and Barrack, 1992; Tinari et al., 1993; van Dalen et al., 1988; Yogi et al., 1991 |
TABLE 4-6 Etiology, Evidence, and Potential Markers of Interstitial Cystitis
|
|
Evidence |
|
|
|
Etiology |
Pro |
Con |
Potential Markers |
|
Infection |
Finding of fastidious organisms |
Failure to respond to antimicrobials; no findings of positive markers |
Antibodies, genome, or immunohistochemical detection of proteins of infectious agent |
|
Obstruction of vascular and lymphatic channels |
Fibrosis, submucosal edema; onsets related to pelvic infection or operations |
Experimental models do not produce IC; surgical treatments for IC will produce blockage |
Fibrosis; submucosal edema |
|
Neuropathy |
Pain, focal neural inflamtion; response to amitriptyline; afferent fibers or neurotransmitters can control inflammatory response directly or through mast cells |
Perineural inflammation not found in other studies; clinical therapy highly unpredictable |
Focal inflammation in and around intramural and perivesical nerve bundles; neurotransmitter levels and receptors; mast cells |
|
Endocrinopathy |
Association with oophorectomy, sex bias, small numbers in premenopausal and postmenopausal women |
Symptomatic response to hormonal therapy unpredictable |
Endocrine receptors and levels |
|
Psychoneurosis |
Neurotic behavior pattern |
Behavior seems to be a result of disease |
- |
|
|
Evidence |
|
|
|
Etiology |
Pro |
Con |
Potential Markers |
|
Inflammation |
Similarities to systemic lupus and other autoimmune disorders; chronic inflammation in pathology; some responses to steroids, NSAIDS, and immunosuppressants; positive FANA at times; Ig deposits in bladder |
Ig deposits nonspecific in origin; inflammation in bladder frequently not present; phenotypes of inflammatory cells in bladder; variable response to immunosuppressant therapy; relief on diversion |
Immune mediators; immunecell typing; specific antibody levels |
|
Deficiencies in bladder lining |
''Leaky'' epithelium in IC, also produced in normal subjects by protamine and reversed by heparin; decreased GAG excretion in IC patients; increased GAG produced by hydro-distention; ultrastructure shows loose urothelium |
GAG treatment not always effective; deficiency never demonstrated directly |
Decreased GAG in urine; altered GAG on umbrella cells |
|
Toxic substances in urine |
Diversion relieves symptoms; increased serum anti-THP IgG; cytotoxic urine |
Some evidence suggests defect is from inside bladder |
Antibodies vs. urinary constituents |


