
3
POPULATION GROWTH AND DISTRIBUTION
As in other parts of Africa, the population of Senegal has been increasing rapidly over the past several decades. This chapter traces the growth and distribution of the population of Senegal over the last 30 years and discusses briefly both interregional and international migration. From administrative counts, which probably underestimate the true size of the population, it is estimated that Senegal's population increased from about 1.1 million in 1904 to 2.3 million in 1958, or at an annual rate of 1.3 percent over the period 1904-1958 (Becker and Mbodji, 1994). Estimates of the total population based on data from the 1960-1961 Demographic Survey [1], the 1970-1971 National Demographic Survey [2], as well as from the 1976 [17] and 1988 [18] censuses, allow us to analyze this growth at both the national and regional levels.
Overview Of National Population Trends
Between 1960 and 1988, the population of Senegal more than doubled from 3.1 to 6.9 million. The annual growth rate between these dates was 2.9 percent. Growth rates for the periods 1960-1970, 1970-1976, and 1976-1988 are shown in Table 3-1. The erratic nature of the series, increasing from 2.3 to 4.2 percent, then decreasing to 2.7 percent, may be due to the unreliability of survey data (see the section Overall Levels and Trends under Levels and Trends of Fertility in Chapter 4 and Sources and Quality of Data in Chapter 5 for general discussions concerning the sources and quality
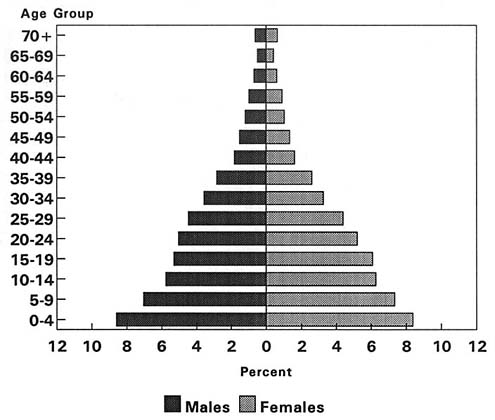
FIGURE 3-1 Population pyramid, Senegal, 1988. SOURCE: 1988 census (unpublished tables).
of data used in this report), and therefore should be interpreted with caution. When longer intervals, such as 1960-1988 or 1970-1988, are taken into consideration, the annual average growth rate remains close to 3 percent.
The importance of Dakar in terms of population growth and population distribution within Senegal cannot be overestimated. Dakar, which has the smallest geographic area of any of the ten administrative regions, had the largest population in 1988, the highest growth rate since the 1976 census, and it was the only region that recorded more than 1 million inhabitants in the 1988 census.
The relatively young age structure of the national population is apparent in Figure 3-1. Over the past several decades, the proportion of the population in the younger ages has been increasing slowly. In 1960, 42.7
TABLE 3-1 Regional Populations and Growth Rates, Senegal, 1960, 1970, 1976, 1988
percent of the population was under the age of 15; this proportion had increased to 47.2 percent in 1988.
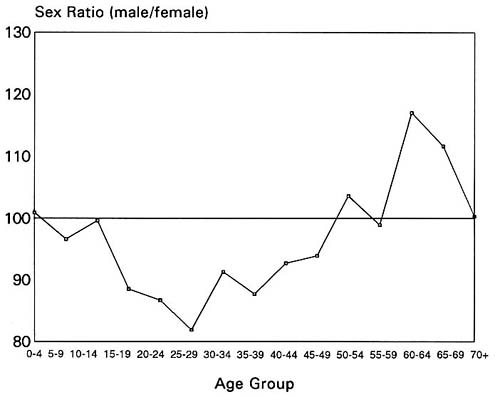
The structure of the population by gender reveals some possible bias in age reporting. In general, one would expect the sex ratio (number of males per 100 females) to be close to 104-106. However, sex ratios for Senegal indicate that there is a deficit of males aged 15-49, followed by a deficit of females above age 50 (see Figure 3-2). These deviations may be explained by the fact that African adult men tend to overstate their age and understate that of their wives. Such over-and understatement of the respective sexes would lead to the pattern described above. These biases are apparent to a greater or lesser extent in each of the regions in Senegal. The smallest difference is in Dakar, where because of higher levels of education and better civil registration, age misreporting is likely to be lower than in other regions.
There are five major ethnic (language) groups in Senegal: Wolof (42.7 percent), Poular1 (23.7), Serer (14.9), Mandingo (7.6),2 and Diola (5.3). Another ten groups comprise the remaining 5.7 percent of the population. Wolof is the most prominent group in five of the regions in the western and central part of the country—Louga, Diourbel, Kaolack, Thiès, and Dakar.3 The Serer are the most prevalent in Fatick. The Popular are the most prevalent in the two southeastern regions, Tambacounda and Kolda, and in the northern region of Saint-Louis. Finally, the Diola form a majority in Ziguinchor (unpublished tables, 1988 census).
OVERVIEW OF REGIONAL TRENDS
As suggested above, population growth has not taken place uniformly throughout the country. Regional differences are due to differences both in natural growth (births minus deaths) and in migration patterns. Over the last century, two major migrations have modified quite substantially the distribution of the population: the rural exodus, which is partly responsible for the accelerated growth of Dakar as well as many other smaller urban areas; and a general movement away from the north of the country towards the south, which has resulted in a relative decline in the northern regions to the advantage of the regions in the center and the south of the country (see Becker and Mbodji, 1994). Aside from Tambacounda during 1960-1970, data indicate that Dakar has had the most rapid population growth of any region over the past several decades (see Table 3-1). Between 1960 and 1988, the population of Dakar grew an average of 4.3 percent per year. The combined regions of Kaolack and Fatick had the slowest population growth, 2.1 percent per year. The combined regions of Kolda and Ziguinchor, and Saint-Louis, also grew relatively slowly over this time period—2.2 and 2.3 percent per year, respectively.
The most notable change in the distribution has taken place in the region of Dakar. In 1960, just over 14 percent of the population resided in Dakar. This proportion increased in both 1970 and 1976. In 1988, over 21 percent of the population lived in Dakar. Four of the six remaining regions (as shown in Table 3-1) lost relative population over the same period.
Historical rates of regional population growth and redistribution have created a situation where regional densities are extremely varied. Dakar is by far the most densely populated: it is estimated that there are 2,707 inhabitants per square kilometer (km2) in that region. The next most densely populated is Thiès, where there are 143 inhabitants per km2. Diourbel follows closely. The remaining regions are much less densely populated. The most sparsely populated region is Tambacounda, where there are a mere 6.5 inhabitants per km2. It is clear from Figure 3-3 that the population is densest in the western region and sparsest as one moves east.
The level of urbanization also varies by region quite substantially within Senegal, as can be seen in Table 2-4. The western part of the country is by far the most urbanized. The most urban region is Dakar (97 percent), followed by Ziguinchor (38 percent). Six of the ten regions have fewer than 25 percent of their population in urban areas. The least urbanized region is Fatick, where only 10 percent of the population lives in an urban setting.
Because of high levels of in-migration of people aged 15-59, the age structure of the population in Dakar (see Figure 3-4) differs from that of the country as a whole (see Figure 3-1).
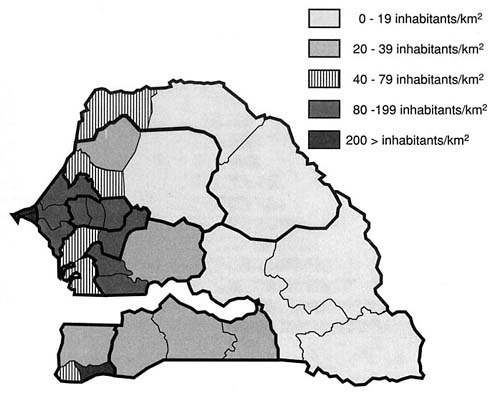
FIGURE 3-3 Population density (inhabitants per km2) by department, Senegal, 1988. SOURCES: République du Sénégal (1992c-k); 1988 census (unpublished tables).
MIGRATION
People migrate for various reasons, the most common being economic or family reasons, or education. The study of migration is of interest for several reasons. Because migrations exhibit age- and sex-based selectivity, they affect the demographic structures of the source and destination areas. As a component of population dynamics, migrants contribute directly to population increase or decline in both source and destination areas. Furthermore, migrants often have different rates of childbearing than their nonmigrant counterparts due, among other things, to the postponement of marriage, spousal separation, and exposure to new ideas and norms.
For this study, internal migrants are defined as those people who move within national borders, but across regional boundaries. In general, knowledge about internal migration remains fragmentary, though limited information is available from the national demographic surveys in 1960-1961 [1] and 1970-1971 [2] and the 1976 [17] and 1988 [18] censuses, which asked
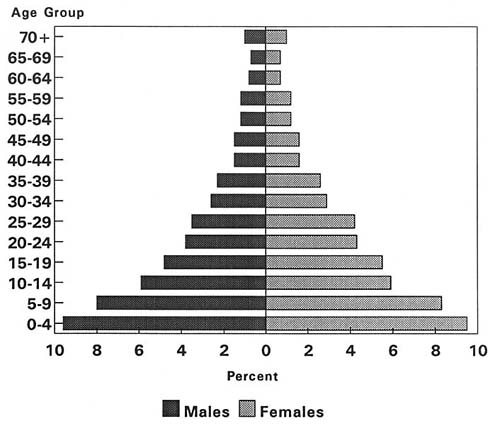
FIGURE 3-4 Population pyramid, Dakar, 1988. SOURCE: 1988 census (unpublished tables).
for place of birth. From these data, we are able to obtain a measure of lifetime migration.
The proportion of persons residing in a region other than that containing their place of birth varies according to source. But all of the sources indicate that the proportion of the population living in a region other than their region of birth is highest for the Dakar region, where at each observation more than one-third of the population was born in another region. The highest proportion of Dakar residents born elsewhere—46 percent—was recorded in 1960.
Three types of internal migration are discussed briefly below: (1) lifetime migration, which includes individuals who have migrated since birth; (2) migration of individuals who have moved within the past 5 years;4 and (3) temporary migration, which includes individuals who at the time of the 1988 census had resided in a region for a period of less than 6 months.5
Temporary migration includes circular migration, particularly seasonal migration. In addition, this section briefly addresses international migration.
Lifetime Migrants
The proportion of lifetime migrants living in other regions varies markedly from one source to another, probably reflecting both data quality and time-based in-migrant/out-migrant variations among the regions. Despite these inconsistencies, several trends can be noted. First, some regions exhibit very low migration over the entire period; among them are eastern Senegal (Tambacounda), Saint-Louis, Louga, and, to a lesser extent, the Casamance areas (Kolda and Ziguinchor). Other regions occupy an intermediate position, showing fluctuations from time to time. This is the case in Sine-Saloum (Fatick and Kaolack) and the regions of Thiès and Diourbel.
Migration Within the Last 5 Years
Information on migration in the last 5 years is available from the 1979 Labor Force Survey and the 1988 census. During the 5 years preceding the census, all regions in Senegal had both in-migrants and out-migrants, though the magnitude of these flows was different. Three regions experienced net in-migration during the 5 years preceding the census (Dakar, Ziguinchor, and Tambacounda); the others (except Diourbel and Kolda) experienced net out-migration (see Table 3-2). The importance of migration for Dakar is apparent; in-migration, out-migration, and net in-migration are far higher for Dakar than for any of the other regions. In most regions, the migration for both males and females was mostly among young adults. Females exceeded males in terms of in-migration within the last 5 years in Dakar, Diourbel, and Ziguinchor, the latter of which also reported more female than male out-migrants. Fatick, Louga, and Thiès also reported more female than male out-migrants.
Analysis of migration flows by type of residence reveals that among migrants moving within the 5 years preceding the census, migration from one urban area to another was most common. Migrants moving from rural to urban areas were the next most prevalent. Movements into rural areas were the least typical (see Figure 3-5). Clearly, since most migrants moved into urban areas, there was a net urban gain, which can be seen in Figure 3-6. It is clear from both of these figures that most of the movement has taken place among the younger ages.
More recent information on migration is available from the 1991-1992 Enquête Sur les Priorités [6], which asked respondents to list their last place of residence. A preliminary analysis of these data indicates that there has been little change in the pattern of migration since the 1988 census.
TABLE 3-2 Net Migration Within the 5 Years Preceding the 1988 Census, by Region
|
Region |
In-Migration |
Out-Migration |
Net In-Migration |
|
Dakar |
69,000 |
49,000 |
20,000 |
|
Diourbel |
18,000 |
18,000 |
0 |
|
Fatick |
12,000 |
14,000 |
-2,000 |
|
Kaolack |
18,000 |
20,000 |
-2,000 |
|
Kolda |
9,000 |
9,000 |
0 |
|
Louga |
7,000 |
19,000 |
-12,000 |
|
Saint-Louis |
11,000 |
18,000 |
-7,000 |
|
Tambacounda |
8,000 |
7,000 |
2,000 |
|
Thiès |
23,000 |
29,000 |
-6,000 |
|
Ziguinchor |
22,000 |
15,000 |
7,000 |
|
SOURCE: République du Sénégal (1992d) |
|||
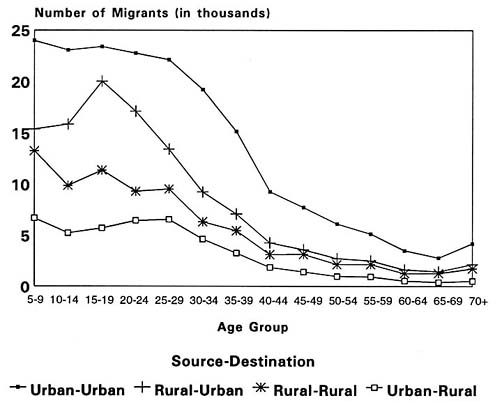
FIGURE 3-5 Internal migration by urban or rural source and destination, Senegal, 1988. SOURCE: 1988 census (unpublished tables).
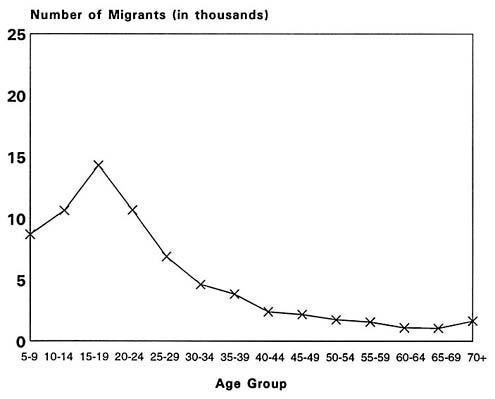
FIGURE 3-6 Net rural-urban gain, Senegal, 1988. SOURCE: 1988 census (unpublished tables).
Temporary Migration
Senegal has a long tradition of seasonal migration of agricultural laborers from the southern and southeastern regions to the groundnut fields, in central Senegal. In the past, seasonal migration has been linked predominantly to the very limited use of agricultural equipment, making human labor an important factor in production. Recently, however, this type of migration has been decreasing gradually as a result of increasing mechanization in rural areas, as well as crop diversification in the areas of out-migration.
Emigration of household labor concerns the movement of domestic workers coming mainly from the Basse Casamance (Ziguinchor) and the Sine (Fatick and Kaolack), and traveling to the regional capitals, in particular Dakar. These population shifts begin in October, at the end of the heavy agricultural season. The workers return at the beginning of the rainy season (May-June).
Because the 1988 census was taken at the end of the dry season, a time when a portion of the temporary migrants are away from home, those not living in the region of their usual residence can serve as a proxy for temporary migrants. Such temporary migrants comprised just over 5 percent of the entire population at the time of the census (see Table 3-3). By region, this proportion varied between 2.7 percent in Dakar and 8.4 percent in Ziguinchor.
Not only was Ziguinchor different from the other regions in terms of magnitude, but this region was the only one to have more female than male temporary migrants. In fact, over 52 percent of the temporary migrants were female.
Comparison of male and female temporary migrants by age reveals that it is not uncommon for temporary migrants to be predominately female in the younger age groups. Between the ages of 10 and 14, females exceed males in terms of temporary migration in six regions. In Fatick and Ziguinchor, females also exceed males between the ages of 15 and 19. After the early adult years, however, male migration surpasses that of females.
Though female migrants in the older ages in Fatick and Ziguinchor do not exceed males, the proportion of female migrants in these two regions is
TABLE 3-3 Percentage of Temporary Out-Migrants by Region and Distribution by Sex, Senegal, 1988
consistently higher than in the other regions for every age group 10-14 through 45-49. The proportion of female migrants is the highest in Ziguinchor and second highest in Fatick. The implications of high female migration for fertility are discussed in Chapter 4.
Ziguinchor comprises mostly Diola (61 percent), and Fatick comprises mostly Serer (55 percent). These two ethnic groups are more likely than others to take part in seasonal labor migration to find domestic work in urban areas before they marry (Sy, 1991). Hence, the relatively high levels of female seasonal migration in Ziguinchor and Fatick can be explained in part by the ethnic composition of those regions.
The repercussions of these migration movements for demographics, labor, and the financial inflows coming from the areas of in- and out-migration appear to be among the most intensely analyzed aspects of migration. Diop and Dieng (1985) examined the effects of population outflows on the agricultural work force. Their overall conclusion is that any migration of youth from an area of agricultural undermechanization draws away labor and affects the effective performance of agricultural activities. However, this effect is attenuated by the seasonal timing of the departures and returns, which often coincide with the end and resumption of heavy agricultural labor, respectively. This situation is true for young Diola and Serer women in Casamance (Ziguinchor and Kolda) and Sine (Fatick and Kaolack). During the period of absence, the supply of domestic labor increases in the cities.
International Migration
The number of international migrants living in Senegal is estimated to be 213,656, or 3.1 percent of the population (unpublished tables, 1988 census). The greatest proportion live in Dakar (37 percent), followed by Kolda (21 percent), while the smallest proportion live in Louga (0.9 percent).
Most of the immigrants (78 percent in 1976 and 86 percent in 1988) come from within Africa. ''Push" factors have been the major driving force for international migrants to Senegal: Three out of Senegal's four immediate neighbors have had internal problems in the recent past (e.g., Guinea-Bissau and Guinea in the 1970s and 1980s and Mauritania in the 1990s). Guinea was the primary source country at the time of the last two censuses in 1976 and 1988, respectively (see Table 3-4). Guinea-Bissau was the second most important source country in each of these two years and Mauritania the third.
The record of Senegalese emigrants is more difficult to ascertain because one must rely on censuses and vital records from other countries. New censuses are available for Burkina Faso (1985) and Mauritania (1988), but they did not report foreign-born population by source, so we are unable
TABLE 3-4 Immigrants to Senegal by Source, 1976 and 1988
to know how many came from Senegal. In fact, not having recent data, or having data that are not completely disaggregated are common problems with African censuses, especially in western Africa. Data are often incompletely analyzed and when they are analyzed, the results are not published or are published with great delay. Nevertheless, such data are highly uncertain and provide just an idea of what are the main streams of migration. Data on the number of Senegalese in selected African countries is available from respective censuses, most of which took place in the 1970s (Russell, 1993). Côte d'Ivoire was the destination of 40,000 migrants from Senegal in 1988 (see Table 3-5). The only other countries having a Senegalese immigrant population over 15,000 (for which there are data) are The Gambia and Mauritania.
Not surprisingly, because of its former strong ties with Senegal, France also has a substantial Senegalese emigrant population. In the 1982 census there were 32,336 Senegalese emigrants enumerated in France. In 1990, that number had risen to over 45,000.
TABLE 3-5 Senegalese Emigrants by Selected African Destinations
|
Destination Country |
Year |
Senegalese Emigrants |
|
Burkina Faso |
1975 |
2,000 |
|
Congo |
1984 |
3,000 |
|
Côte d'Ivoire |
1988 |
40,000 |
|
The Gambia |
1973 |
27,000 |
|
Guinea-Bissau |
1979 |
6,000 |
|
Mali |
1976 |
4,000 |
|
Mauritania |
1977 |
18,000 |
|
SOURCE: Data from Russell (1993:Tables 8-2, 8-6); data for Côte d'Ivoire from United Nations (personal communication, 1995). |
||
Conclusion
Migration has become an important part of population dynamics in Senegal. Despite the substantial migration from Senegal to France documented above, the vast majority of migration takes place internally. Migration is selective as a function of age, sex, and type of residence. Typically, the migration process accelerates as the development process advances, such that the number of migrants tends to increase over time. As discussed in Chapter 2, recent economic downturns have necessitated the implementation of structural adjustment programs in Senegal. A great deal more research will be needed before we know how these economic downturns have affected migration flows.


