
4—
Geography's Techniques
This chapter provides a brief discussion of contributions made by geographers to the development of techniques for observation, display, and analysis of geographic data. With respect to observation, the chapter addresses two extremes on the geographic scales of observation: local fieldwork and remote sensing. With respect to the display and analysis of data, the chapter examines cartography, visualization, geographic information systems (GISs), and spatial statistics.
The techniques that geographers use in their work are not developed in a vacuum. They are developed to address specific problems and, thus, reflect the focus of the discipline at particular times. These techniques reflect the conscious decisions of geographers about the kinds of information that are important to collect; the spatial scales at which information should be collected, compiled, analyzed, and displayed; data sampling strategies and experimental designs; data representation; and methods for data analysis. As theoretical paradigms change, so do the techniques for empirical research. Thus, advancement of the discipline goes hand in hand with the development of new and improved techniques for collecting, analyzing, and interpreting information. Sidebars 4.1 and 4.2 illustrate the close relationship between advancement of the discipline and technique development.
The variety of perspectives in geography and a recognition of how different world views and experiences influence theoretical work (see Chapter 3) help geographers remain conscious of the influence of theory on technique development (and the reverse). The current popularity of GISs, for example, both reflects and reinforces the influence of spatial analytic theories in the discipline. There
|
SIDEBAR 4.1 Potential Evapotranspiration Until the 1940s, practical algorithms were unavailable for reliably evaluating the relative wetness or dryness of climates, relationships between precipitation and stream runoff, the amount of irrigation necessary to maximize crop yield, and a number of other hydroclimatic problems. What was missing was an easy-to-use, reliable, and yet physically realistic way of estimating the time-integrated atmospheric demand for land surface moisture. Surrogates for atmospheric moisture demand, such as pan evaporation and air temperature, were used out of necessity, but they were conceptually flawed and often produced highly biased estimates. Working with colleagues at the Laboratory of Climatology in New Jersey during the 1930s and 1940s, C.W. Thornthwaite devised a relatively straightforward characterization of atmospheric moisture demand (termed "potential evapotranspiration," or E0) and a practical means of estimating it (Wilm et al., 1944). Thornthwaite's contribution to climatological understanding has endured not only because his E0 concept is physically grounded, but because relatively reliable estimates of E0 can easily be made from measurements (or estimates) of monthly air temperature (T) and day length (h). Thornthwaite's E0 as well as his climatic water-budget algorithms (Thornthwaite and Mather, 1955) have found many varied uses, ranging from evaluating local hydroclimatic problems to assessing the geographic variability of evapotranspiration on regional, continental, and even global scales. His separation of E0, E, and β, and representation of E as E = E0 β—where E is the actual evapotranspiration and β is a dimensionless measure of land surface moisture conductance—in particular, suggests which environmental characteristics should be observed and estimated. Thornthwaite's conceptualization, in other words, has significantly advanced our understanding of how to sample the environment to assess the hydroclimate of a place or region. |
is a lively debate about whether the popularity of GISs is hindering the development of other theoretical approaches, such as social theory, that require different techniques for empirical analysis.
This chapter illustrates some of the ways in which geographers have made substantial contributions to empirical scientific techniques through their methodological research. Some of these techniques were developed by other disciplines for other purposes and were adapted by geographers to meet the special challenges posed by the study of spatial and temporal aspects of phenomena, processes, and events. Some of the techniques developed by geographers have found widespread use in other disciplines and in the public and private sectors generally. Perhaps the best current examples are GISs that store, manipulate, and display geographically referenced information. The potential of GISs to handle large quantities of spatially related information fills an important need in research, education, and applied work in the public and private sectors. The geographic information system, in addition to being a stimulus for theoretical research in spatial representation (see
Chapter 3), is a major topic of techniques-related research in geography and it is one of the principal topics of specialization within the field, currently demanded by students and employers alike.
The focus of this chapter on techniques for empirical analysis should not be taken to mean that methodological contributions in geography have been restricted to observation and hypothesis testing. For the past 20 years the discipline has been a fertile field of theoretical research, particularly in conceptualizing and modeling geographic processes. In many ways these theoretical developments have given the discipline its secure intellectual foundation.
Observation
Observation of phenomena and events is central to geography's concern for accurately representing the complexity of the real world. The traditional and still widely practiced method of observation is through direct "on-the-ground" contact between geographer and subject through field observation and exploration. Fieldwork is particularly effective for making observations at micro- to mesoscales, as typified, for example, by the study of single watersheds or cities.
 |
Fieldwork is an intensive endeavor. It can require substantial investments of human and financial resources, particularly if carried out over extended periods of time.
The intensive nature of fieldwork makes it impractical for macroscale observations of the Earth's surface. Such observations are best made by using remote sensing techniques that utilize air- or spaceborne platforms and sensors. The development of these techniques, and especially the collection of remote sensing data, have often been led by geographers.
Field Observation/Exploration
The principal laboratory for geographic investigation is the field. Indeed, Sayer (1993) has argued that the intensive, comparative case-study research enabled by field observation is central to understanding the variations between places that geographers specialize in studying. Many of geography's most compelling questions center around changes in the physical and built landscape. Addressing those questions usually requires field observation and spatial sampling. Geographers interested in social patterns and processes also use archival research, interviewing and surveying techniques, and participant observation methods that are associated with the social sciences more generally.
Fieldwork allows geographers to make direct observations in places where local data are missing or unreliable and to check the validity of existing secondary sources such as census statistics. While the increased availability of remote sensing imagery would seem to reduce the need for fieldwork in some research, in truth it makes such work even more important because accurate interpretation of imagery depends on detailed knowledge of the actual patterns on the ground. To decide, for example, which areas on a forested scene represent healthy old-growth forest as opposed to disease-infested old-growth or young secondary forest, researchers need field data on the composition and distribution of different forest stands so that they can assess how such stands are ''seen" by remote sensors.
Fieldwork may also be needed to test the validity of interpretations (e.g., a vegetation map) that others have made based on remote sensing imagery—just as it is necessary to test the validity of other secondary data sources, digital or otherwise. The wide availability of digitized secondary datasets (not just interpreted imagery but also census data and other information) makes it easy for students and researchers to download information and perform their own analyses. Unfortunately, such datasets frequently do not include detailed descriptions of the origins and reliability of the information. In cases where these "meta-data" are missing, the digital datasets may only be useful if the researcher is able to assess their reliability through fieldwork. In a digital age, when it seems so easy to collect observations "automatically" from space or secondhand from online datasets, fieldwork becomes more, rather than less, important to good scholarship.
The contributions of geography to the practice of field research derive from the discipline's emphasis on location and synthesis. As noted in Chapter 3, geographers are concerned with distributions and spatial patterns of phenomena. In these connections they have contributed to our understanding of distributions and patterns through the development of innovative field mapping techniques. To geographers, field maps are more than orientation aids. They are a tool to record and to uncover relationships among observations. Geographers have developed field mapping techniques to shed light on everything from spatial cognition to the origin and diffusion of cultural traits. With the explosion of GISs, global positioning systems (GPSs), and related technologies, geographers are at the forefront in automating the compilation, manipulation, and analysis of field observations (see Figure 4.2).
The field geographer's interest in distributions and spatial patterns is part of a larger concern with synthesis: how and why particular phenomena come together in specific places to create distinctive environments. This concern leads geographers in the field to observe and study a wide range of physical and social phenomena. Research on land reform, for example, might involve soil sampling as well as interviews with affected individuals.
The enduring importance of fieldwork in geography extends beyond research to pedagogy. At a time when new ways are being sought to promote environmental and cultural awareness through education, geographic fieldwork offers a unique and valuable perspective. Field excursions are incorporated routinely into many geography courses. They are designed to teach students about the environment in which they live and to encourage them to be inquisitive about the processes that shape landscapes and cultures. Fieldwork thus provides both a tool for the acquisition of knowledge and a means of promoting awareness and appreciation of culture and the environment.
Remote Sensing
Remote sensing is defined here as the detection and recording of electromagnetic radiation signals from the Earth's surface and atmosphere using sensors placed aboard aircraft and satellites. These signals are usually recorded in digital form, where each "digit" denotes one piece of information about an average property of a small area of the Earth.
Geographers have been using remote sensing data since they first became available about 30 years ago. Geographers who study the Earth's climate, for example, use satellites to collect data on atmospheric conditions for monitoring and predicting change. Remotely sensed data also are very useful in creating and updating maps of physical, biological, and cultural features at the Earth's surface. The ability of certain sensor systems to "see" through cloud cover, and their unrestricted access to all portions of the Earth, provide information that may not be available from other sources.
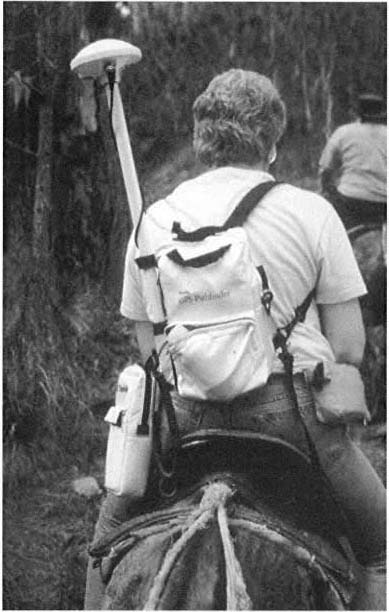
Figure 4.2
This photograph shows a GPS (mounted on the rider's back) being used to record positional data while traversing remote highlands of the Dominican Republic for a research project on Quaternary paleoclimatology and biogeography. Data were subsequently entered into a GIS to map trail routes and geomorphic features under study.
Geographers have played important roles in efforts to use satellite data for taking inventory of and monitoring land cover, both regionally and globally. For instance, a joint U.S. Geological Survey (EROS Data Center)/Center for Advanced Land Management Information Technologies project recently demonstrated a method using multisource data that successfully characterized 159 land cover classes for the United States (see Plate 11). The acquisition of global land cover data has been recognized as a top priority by the National Research Council and the International Geosphere-Biosphere Programme (e.g., Townshend, 1992; NRC, 1994).
Geographers have also played key roles in the collection and processing of remotely sensed data for the National Oceanic and Atmospheric Administration's Coastwatch Change Analysis Project, a joint state and federal program designed to monitor environmental changes in coastal wetlands, uplands, and submerged habitats. Klemas et al. (1993), for example, developed a coastal land cover classification system for use with satellite imagery. The system is compatible with existing coastal mapping programs and databases and with GIS. Dobson and co-workers (Dobson and Bright, 1991; Dobson et al., 1993) have conducted prototype studies in the Chesapeake Bay watershed and have helped develop a protocol for mapping locations, characteristics, and changes in coastal zone habitats. Jensen and co-workers (Jensen et al., 1993a, b) have used remote sensing data to predict the effect of sea-level changes on coastal wetlands (see Plate 3).
Scale is a fundamental issue for collection of data by remote methods. In this context, scale can refer to the spatial, spectral, radiometric, or temporal characteristics of sensor systems, all of which—singly and in combination—affect the quality and usefulness of the collected data. Geographers have made valuable contributions in understanding the spatial- and temporal-scale dependence of geographic data and in determining optimal measurement scales for remotely gathered data.
Geographers are also involved in developing new technologies for integrating, analyzing, and visualizing multiresolution satellite data in integrated geographic information systems. The integration and visualization of satellite imagery with other types of data hold enormous potential for researchers, resource managers, and decision makers as they strive to inventory, understand, and manage the Earth's human and natural environment.
Sampling and Choice of Observations
An important component of much geographic research is estimation of the values of variables through sampling. Evaluating the efficacy of sampling designs is an important topic of research in geography and an important aspect of applying geography's techniques.
Traditionally, sample collection in geography utilized sampling designs borrowed from classical statistics, but for many geographic data, classical sampling
designs may not produce representative samples. Random samples are not necessarily representative samples because of the way processes can vary in time and space. For spatially referenced data there is no consistent relationship between the number of observations and their representativeness. Quite commonly, other information is available that permits the differential weighting of sample observations. Such Bayesian weighting schemes, for example, are becoming especially important in interpreting the geographic patterns of disease distributions. The "samples" of observed diseases are hypothesized to be drawn from known processes, and the interest is in observing differences between observed and expected patterns of disease given the geographic distribution of conditions known to affect the likelihood of the disease being present in a population (Langford, 1994). Generating samples from known processes, computing the reference distribution and finding the relationship of an observed sample estimate to it, is often accomplished using Monte Carlo simulation methods (Openshaw et al., 1987, 1988).
Many samples of geographic data are taken from datasets designed for other purposes (e.g., from the census). This resampling of samples confounds classical statistical probability assessments and hypothesis testing. A number of geographers have begun to move away from classical statistical approaches toward more flexible approaches that incorporate geographic understanding. The move from "direct" to "indirect" estimation techniques that rely on knowledge from related observations to estimate the conditions of small areas illustrates this change. In qualitative approaches in human geography, formal sampling designs are often questioned, since space is not conceived of as an empty space whose content is to be captured through systematic samples—but, rather, as a differentiated space with meanings attached to areas that change across space in noncontinuous ways. In qualitative analyses a contrast is made between time, which is seen as one-dimensional and unidirectional, and space, which is seen as multidimensional and ordered in many different ways. For the qualitative geographer, who is often cultivating the middle ground between the universality of science and the particularity of history, interpreting the meaning of change in space becomes the goal and purposive sampling the tool for this end.
An example of a new approach to sampling design and evaluation is the ongoing effort to assess global climate and climatic change from weather station measurements. Rain gauge networks provide spatial samples of the continually varying global precipitation field. Their spatial distributions are neither random by design nor demonstrably random in effect (see Figure 4.3); nevertheless, the nodes of these sampling networks (the rain gauge locations) are arguably the best representations of historical precipitation variability. Standard statistical approaches are inadequate for assessing precipitation variability from such samples for the reasons mentioned above. In their place, computer-intensive, nonparametric methods of evaluating the rain gauge networks and, in turn, the precipita-
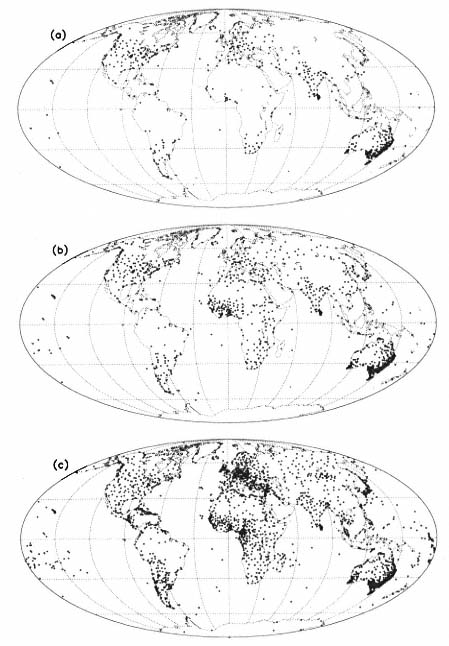
tion fields that they represent have proven useful, when informed by climatological understanding.
Display and Analysis
The traditional tool in geography for the display of spatially referenced information is the map. Cartography is a subdiscipline traditionally concerned with formalized procedures for making maps. To many, the term map connotes a fixed, two-dimensional paper product containing point, line, and area data. During the past generation, however, advances in data collection, storage, analysis, and display have greatly expanded this traditional view. The "modern" map is a dynamic and multidimensional product that exists in digital form. The advent of such maps has opened up new fields of research and application for geographic investigation.
Any geographer educated 25 years ago who returned to the discipline today would be impressed by the methods geographers now use to record and process spatial information (Laurini and Thomas, 1992). The changes extend beyond the development of GISs to new techniques for geographic visualization and spatial statistical analysis, which provide for an increasingly complex and contextual understanding of the world. This same observer would also be impressed by the problems that remain to be solved. For example, a substantial methodology now exists for statistical analysis of spatial data, but it has not yet been integrated into GISs. Indeed, as a platform for the investigation of scientific questions, GISs are still in their infancy. Many geographers believe that a large dividend would come from integrating GISs as information science with visualization techniques and spatial analysis methods.
The following subsections provide a brief review of some of the substantive methodological contributions of the discipline to display and analysis techniques. These include cartography, GISs, geographic visualization, and spatial statistics.
Cartography
The traditional close association between geography and maps is appropriate given the discipline's concern with space and place. The symbiotic link between geographers and maps has ensured the persistence of cartography as a subdiscipline of geography within most academic settings.
The field of cartography has changed enormously during the past three decades, primarily because of the widespread availability of computers. Computers have made possible new forms of symbolization, such as dynamic (i.e., animated) maps, customized maps for individual users, and interactive maps. They have also made possible new methods for scientific visualization and spatial data analysis.
Geographic cartographers have made especially valuable contributions to
the development of automated mapping systems. Their research on map reading processes, map production techniques, cartographic generalization, and cartographic design has facilitated the automation and formalization of what had been an intuitive manual procedure. With generalization, for example, a conceptual model has been devised that separates the subjective and holistic approaches of traditional cartography into discrete subcomponents that have been successfully incorporated into digital mapping software (McMaster and Shea, 1992). Cartographers have also worked to prevent the inadvertent misuse of computer mapping systems and maps by developing expert systems for map production.
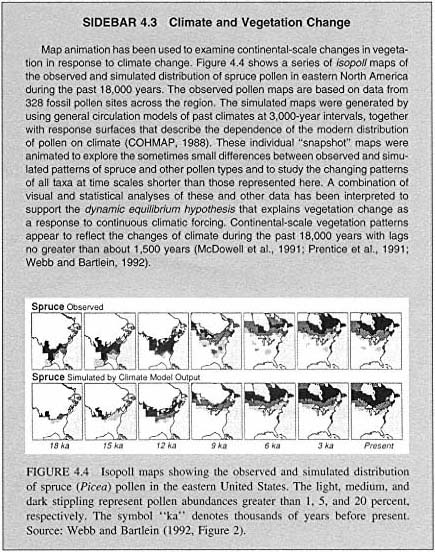
Some of the most interesting and potentially useful research conducted by geographers today is in the realm of dynamic or animated cartography. Animation enables the visualization of changes in phenomena across space, through time, and in attributes of the phenomena themselves (see Sidebar 4.3). One of the earliest animated maps of the microcomputer era showed the spread of AIDS at the county level in Pennsylvania (Gould, 1989). This animation was used to highlight the initial concentrations and spatial diffusion of the disease more effectively than a sequence of static maps. The intention of this dramatic portrayal was to inform and educate health care researchers and the general population. The cartographic techniques developed in this research subsequently led to inclusion of a series of animated maps in one of the best-selling CD-ROM encyclopedias.
Geographers have led the way in research on another new cartographic format: electronic atlases and atlases on CD-ROMs. In a recent project undertaken jointly by Florida State University, the Florida Department of Education, and IBM, an atlas of Florida was published on a CD-ROM and distributed to all schools in the state ("Atlas of Florida," 1994; see Figure 4.5). This format permits the inclusion of multimedia material that could not be accommodated by traditional printed text: audio, video, animation, or a multitude of photographs and other graphics. Electronic atlases and related geographic programs are already proving to be effective in educational settings, especially at the kindergarten through grade 12 levels. The newly released "ExplOregon: A Geographic Tour of Oregon" (a 1995 multimedia CD-ROM developed by William Loy with Digital Chisel software by Pierian Spring Software) is changing the way that the geography of Oregon is taught and learned in schools throughout the state. As national standards for geography education are developed, educational aids such as electronic atlases will become indispensable.
Geographic Information Systems
Geographic information systems were defined in 1992 by the U.S. Geological Survey as "computer system[s] capable of assembling, storing, manipulating, and displaying geographically referenced information" (USGS, 1992). Such systems, in fact, have power, utility, and importance far beyond this definition, both within and beyond the field of geography. Their most valuable potential capability,
 |
which sets them apart from computer mapping systems, is the ability to perform spatial analyses to address research and application questions.
Fundamental to the successful propagation of GISs is the development of methods for representing and coding spatial data (see Sidebar 4.4). GISs can be used to perform an extensive variety of spatial operations and analyses on properly coded data. At the most elementary level are computations of distances, areas, centroids, gradients, and volumes. More complex operations that add spatial
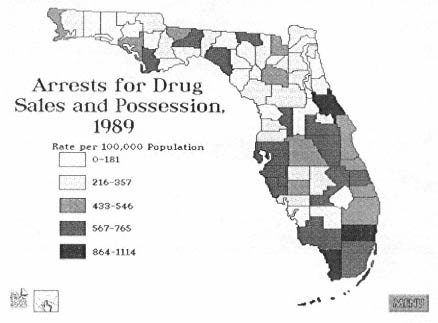
Figure 4.5
Choropleth map from the "Atlas of Florida" CD-ROM showing arrests for drug sales and possession by county for 1989. By clicking on the graph icon at the lower left of the screen, the user can display an animated bar graph that depicts changes over time in drug-related crimes and enforcement.
Source: "Atlas of Florida" (1994).
referencing to a basic calculation are also possible—for example, going beyond questions about the total length of a city's sewer lines to questions about the total length of sewer lines in a given area in a particular city and what proportion of this length is more than 50 years old. GISs are also capable of more complicated operations such as (1) calculating new spatial datasets based on attributes of existing data—for example, calculating slopes from elevations; (2) comparing two or more spatial datasets based on user-specified criteria—for example, identifying toxic waste sites that are situated on permeable soil; (3) delimiting areas that possess certain characteristics defined by the user—for example, delimiting locations of commercially zoned land within 2 miles of an interstate highway; and (4) modeling the possible outcomes of alternative processes and policies—for example, determining the impact of flooding along the Mississippi River given the presence or absence of levees (see Plate 10).
GISs are being used to facilitate a variety of management and planning decisions in both the public and the private sectors. For instance, in Wake County, North Carolina, potential sites for schools, libraries, and other facilities have been determined by identifying adequately sized parcels of vacant land and providing information about utilities, topography, and demographic characteris-
|
SIDEBAR 4.4 Locational Coding With the help of its Geography Division, the U.S. Bureau of the Census has developed and released into the public domain a digital data file describing roads, rivers, and many other features of the United States at a nominal scale of 1:100,000. Attribute information of these Topologically Integrated Geographical Encoding and Referencing (TIGER) system files includes the locations of street addresses on all defined road segments. Many software developers and vendors have written computer programs that allow users to read and display these files and to add other information containing street addresses. Street addresses have become the locational reference code from which near-absolute locations can be established with an accuracy of approximately 20 m. Through address matching, distances can be computed through the street network between, for example, patients and hospitals, the scene of crimes and police patrol routes, and the homes of children and schools. New locational coding schemes now make it possible to customize information for specific applications. For example, businesses can use this information to better target their marketing efforts. Government can use this information to improve the delivery of social services or economic assistance. Geographers who know how to access and manipulate TIGER data are in great demand by the many public and private organizations that have discovered the importance of thinking spatially in an increasingly geographically diverse world. |
tics of the local population. By incorporating population data from the 1990 census into their GIS, Wake County planners can generate population projections, vacancy rate estimates, and growth rates in demands for services (Juhl, 1994).
Plate 4 provides a further illustration of the capabilities of GISs to integrate data from diverse sources to create products for planners and policy makers. The figure shows a map of a portion of Columbia, South Carolina, that was created by combining 1990 census block-level data on racial composition with the county assessor's parcel-level data on land use. Proportional pie graphs provide a visualization of the varying levels of racial integration within blocks. This type of display would be especially useful for political reapportionment.
Another challenge in which GISs have found use is in monitoring natural resources. For example, GISs are being used to assess the impact of water releases from the Glen Canyon Dam on water flow in the Colorado River through the Grand Canyon (Powers et al., 1994). Researchers constructed databases that contain spatial coordinates of the study area and ''layers" of information about the canyon's vegetation, surficial geology, and hydrology. These three characteristics are being monitored and analyzed to determine trends through time in riparian vegetation growth, habitat, and "events" such as channel scouring and channel constriction.
In addition, GISs have a growing role in international policy and planning associated with human welfare. One particularly compelling example, cutting
across the issues outlined in Chapter 2, involves the Bangladesh Flood Action Plan (FAP) of the International Council for Scientific Unions-International Geographical Union (ICSU-IGU). FAP is a major international research and policy development effort designed to provide flood warning, coordinate assistance efforts during flood events, and develop long-term flood mitigation plans. The project brings geographers in Bangladesh together with an international team of experts (coordinated by the IGU) to build a knowledge and technology base at the University of Dhaka. A particularly important component of the project involves rapid field mapping by local technicians using handheld GPS monitors integrated with pen computers. Data are gathered and fed directly into the GIS to allow for updated mapping and integration with remotely sensed images.
Although GISs are being utilized at ever-increasing rates, their full potential remains to be realized. Geographers have an intrinsic interest in GISs from at least three perspectives: (1) as users of GISs for research and applications; (2) as contributors to the development of GIS methods, theories, and applications; and (3) as educators. The interest in GISs as an education tool is becoming increasingly important because their applications are growing rapidly and their impacts promise to be powerful. Geographers will be responsible for preparing future generations of GIS users and must provide them with strong backgrounds in understanding geographic processes and patterns, spatial analysis, and spatial visualization techniques.
To the end user of a GIS, its operation can be a deceptively simple "black box" that generates answers to queries at the press of a few keys. There is an inherent danger in this apparent simplicity, however, in that users can easily and unknowingly misuse the power of GISs to produce irrelevant or erroneous solutions (Cartography and Geographic Information Systems, 1995). Users need considerable background knowledge of the subject matter to which GISs are being applied, as well as an understanding of the analytical operations available on the systems, in order to know what questions to ask, the relevant variables to invoke, and how to recognize nonsensical procedures and answers.
An outgrowth of GISs (linked to geographic visualization and spatial statistics—both discussed separately below) is the development of geographic information analysis (GIA) tools. Such tools typically use an existing GIS as a base (or rely on data structures originally designed to support GIS) to which numerical analysis and sophisticated visual display methods are linked. Among the more successful early GIA tools was the Geographical Analysis Machine (GAM), the goal of which was to generate an automated answer to the question of "where" to look for patterns by initially looking everywhere (Openshaw et al., 1987). GAM is part of a larger effort to develop a "computational human geography," an approach to human geography that builds on the massive databases of social and economic data being generated together with inductive approaches to arriving at useful generalizations. Application of the original GAM resulted in successful
identification of clusters of leukemia cases. The method was, however, limited by its use of brute force (nonefficient) methods.
In a recent extension of GAM, Openshaw (1995) has implemented a space-time-attribute analysis machine (STAM) linked directly to GIS. The goal of STAM is to determine a set of GIS operators that, when applied to a database query, will identify cases that form a statistically unusual pattern. In its most recent implementation STAM incorporates the use of "genetic" algorithms (i.e., algorithms that adapt to their environment, for example, by defining the appropriate spatial scale and resolution for a particular problem context).
Another significant development in GIA is the incorporation of object-oriented programming (OOP) concepts to extract the data needed for an analysis from a GIS, solve spatial analytic problems, and subsequently link the solutions back to the GIS for display of results and further analysis. One example of this approach involves development of custom routing software for use by the U.S. Agency for International Development (USAID) in decision making related to food aid transport in southern Africa (Ralston, 1994). Southern Africa imports large quantities of food grains, and the state of the economy dictates that much of this is in the form of food aid. The software developed for USAID is based on an OOP approach linked to the commercial GIS, ArcInfo. The combination provides a flexible tool for prepositioning food in storage facilities, setting prices for acquisition of more carrying capacity, determining where to add more storage, making distribution decisions, choosing best modes and routes for transport, and determining the location and cost of bottlenecks. The OOP approach was found to be particularly useful in quickly adapting the decision model to deal with changes in obstacles to distribution.
Geographic Visualization
Geographic visualization (GVis) can be defined as "the use of concrete visual representations . . . to make spatial contexts and problems visible, so as to engage the most powerful human information processing abilities, those associated with vision" (MacEachren et al., 1992, p. 101). The dramatic increase in volume of georeferenced data being collected and generated today is exceeding our capacity to analyze and digest it. Using the power of human vision to recognize patterns and synthesize spatial information increases the capacity of geographic researchers to cope with this data volume. For example, a simple 48 × 48 matrix of fiscal transfers for the United States generates 2,256 pieces of information for each time period considered. Such information can be concisely summarized in a simple yet effective visualization (e.g., see Figure 4.6).
GVis combines display with analysis capabilities to enable the search for patterns and relationships; the identification of anomalies; the analysis of directions and flows; the delineation of regions; and the integration of local, regional, and global information (see Figure 4.6). The development of flexible GVis tools
Figure 4.6
Estimated trajectories of fiscal transfers via federal accounts for 1975 (Tobler, 1981). The flow pattern has been estimated from a rather coarse 61 × 95 finite difference mesh, having an approximate resolution of 400 km. The flow lines depict the theoretical paths of fiscal transfers computed from the potential field obtained as the solution of Poisson's equation. This simple but effective visual depiction dramatically illustrates the general direction of flow and also depicts partitioning into flow regions quite clearly. The resolution upon which it was based, which was partly a function of computational power in 1981, does not support identification of particular origins and destinations.
is an important topic of geographic research because such tools are essential to fully exploit the information "content" of georeferenced data. Geography as a discipline is involved with GVis in three ways: development, application, and assessment of the implications of its use.
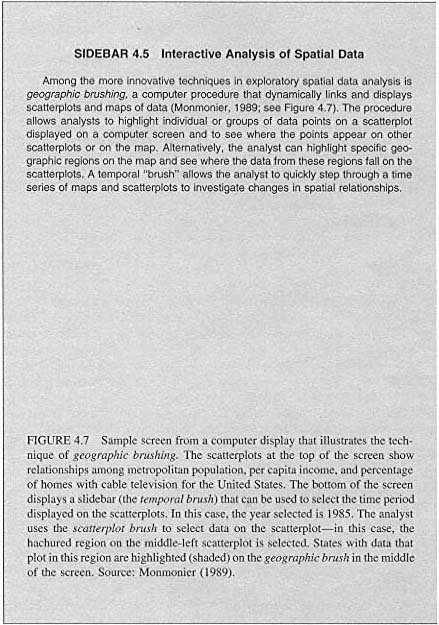
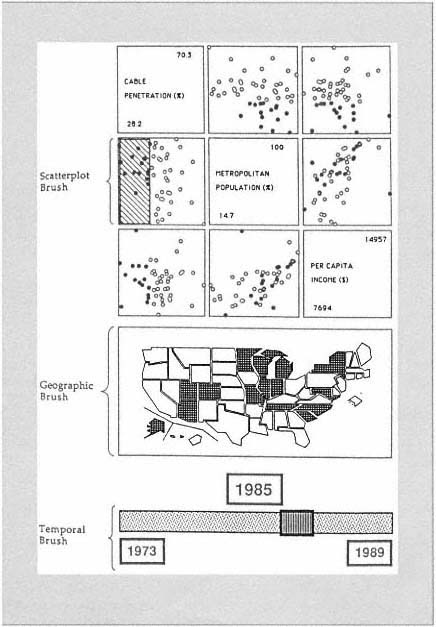
The most active topics of GVis research are exploratory spatial data analysis (ESDA) and the application of multimedia to spatial analysis, education, and policy decisions. Research on ESDA includes work on extending classical statistics to deal with spatial data, as described later in this chapter. Research in this field also includes the development of new data transformation and symbolization techniques and the development of computer interfaces to allow interactive analysis of spatial data (see Sidebar 4.5).
In the field of multimedia research, cartographers are developing techniques and computer interfaces that allow animation to be used as a tool for spatial pattern recognition. Multimedia tools are also being developed to link maps, graphics, text, and data to understand the complexities of geographic processes in
problems involving human-environment interactions. GVis concepts also provide structure for the design of multimedia tools for interactive learning. Multimedia visualization technology is important in the context of digital geographic libraries. A particularly innovative development in this context is the first comprehensive collection of Native American maps (Andrews and Tilton, 1993). The library contains high-resolution images of original maps stored at a variety of resolutions and accessible through a comprehensive cross-referenced indexing tool that takes advantage of the nonlinear structure inherent in hypermedia applications.1
Geographers are exploiting the dynamic capabilities of GVis—its abilities to directly manipulate model parameters or map elements or its capacity for animation—to analyze complex spatial processes. As noted in Sidebar 4.3, for example, animation has been used to understand tree species migration across North America and to compare it with predictions from climate models.
Beyond its role in exploratory research, interactive GVis is rapidly evolving as a tool in policy formulation. A good example is Shiffer's (1993) multimedia environment, which was developed to allow participants at public meetings concerned with airport siting to hear the noise that would be generated at specified locations in relation to the proposed facility.
GVis and scientific visualization in general represent a shift away from strict quantitative analysis to increased reliance on qualitative sensory perception. Particularly when used with modeling and simulation, GVis has important ramifications for geography and the rest of science. These include fundamental issues of how research questions are framed and even what constitutes a problem worthy of investigation. As geographers move away from the use of fixed maps and avail themselves of the multiple perspectives permissible with GVis, they must come to grips with how the "truth" of the representations generated can be judged—and even what truth is. There is a growing need to address such issues as truth in representation, particularly in relation to the use of GVis and GISs in public policy applications.
Spatial Statistics
The analysis of geographically referenced information poses statistical challenges not faced in most other disciplines. First, observations are not always scalar numbers, such as points on a map. They may be multidimensional, consisting of lines, areas, and volumes. Second, the observations may be spatially or spatiotemporally covariant—that is, the values of observations made in one location may depend on the values of observations from other locations or from the same
location at different times. This violates a key assumption central to much statistical theory—that observations are mutually independent.
Attempts to deal with these challenges have stimulated the development of a new subfield of statistics. Although this work began in ecology and biostatistics and has lately attracted the interest of statisticians, many of these developments were pioneered by geographers. For example, geographers have developed methods for estimating the degree and nature of spatial autocovariance in point, line, and area data. They have also addressed such complicating features as periodicity or waves in spatial patterns. Geographers have also played an important role in developing multivariate statistical analysis methods to deal with the spatial and temporal autocovariance of much spatially referenced data.
Spatial data pose special problems that are subjects for research by geographers. Because geographic data often fail to meet distributional assumptions necessary for classical statistical procedures, geographers have been at the center of attempts to develop distribution-free methods for estimating statistical relationships among variables. They also have been involved in the development of methods for estimating prior probability distributions, either through Monte Carlo simulations that generate reference distributions unique to each locality or by developing Bayesian methods that allow investigators to incorporate knowledge of known relationships in statistical investigations.
Methods for evaluating data for spatial dependencies have received recent attention from geographers (e.g., Getis and Ord, 1992). Such measures are used both to identify spatial patterns in data and to allow analysts to understand spatial relationships in their data so that appropriate analytical techniques can be chosen. When measures of spatial dependency are applied to real world datasets of the magnitude needed to address the societal problems identified in Chapter 2, spatial dependency measures can become intractable. One promising solution to the dilemma is the application of massively parallel processing methods (Armstrong and Marciano, 1995).
Recent research in GISs aims to develop "data models" that facilitate the routine analysis of spatial dependence, spatial heterogeneity and spatially referenced diagnosis of regression models. These spatial data models are used to prepare data in the special forms needed to efficiently accomplish these spatial analysis methods. The intent is to bring the same level of enabling technology to spatial analysis that spreadsheets and statistical packages have brought to statistical analysis (Anselin et al., 1993).
Research in spatial statistics is believed by many to be in its infancy because many research questions are likely to yield to computational approaches. There are enormous complexities in the analysis of spatially referenced data that require additional research. For instance, research is needed to understand the scale dependence of statistical methods and sampling designs. This work is necessary to understand why different aggregations of spatially referenced observations give statistical results that vary dramatically and unpredictably from one spatial
specification to another (e.g., Tobler, 1969). Research is also needed to understand how to separate environmental effects from other geographic variations in health research—how, for instance, to separate environmental factors that cause cancer from the density of susceptible populations when searching for cancer clusters. This last example illustrates the importance of research in addressing important public policy questions.
Conclusions
Current trends in geography's techniques suggest a future in which researchers, students, business people, and public policy makers will explore a world of shared spatial data from their desktops. They will request analyses from a rich menu of options, select the geographic area and spatial scale of analysis, and display their results in multimedia formats that are unanticipated today.
In developing GIS-GVis tools of the future, developers need to think more broadly about the context of the problems and the knowledge and skill levels of users. The users of tomorrow are likely to be a far broader group than at present—in background, perspectives, and skills. Indeed, many will be novices by today's standards, and they will rely on the embedded knowledge of experts in their use of these tools.
The users of the future will also bring different world views and theoretical perspectives to these tools. They will challenge the adequacy of current techniques for analyzing and understanding geographic phenomena, posing challenges that must be taken up by developers when designing next-generation tools and theories.


