Chapter 6
Science Content Standards
The content standards presented in this chapter outline what students should know, understand, and be able to do in natural science. The content standards are a complete set of outcomes for students; they do not prescribe a curriculum. These standards were designed and developed as one component of the comprehensive vision of science education presented in the National Science Education Standards and will be most effective when used in conjunction with all of the standards described in this book. Furthermore, implementation of the content standards cannot be successful if only a subset of the content standards is used (such as implementing only the subject matter standards for physical, life, and earth science).
This introduction sets the framework for the content standards by describing the categories of the content standards with a rationale for
each category, the form of the standards, the criteria used to select the standards, and some advice for using the science content standards.
Rationale
The eight categories of content standards are
-
Unifying concepts and processes in science.
-
Science as inquiry.
-
Physical science.
-
Life science.
-
Earth and space science.
-
Science and technology.
-
Science in personal and social perspectives.
-
History and nature of science.
The standard for unifying concepts and processes is presented for grades K-12, because the understanding and abilities associated with major conceptual and procedural schemes need to be developed over an entire education, and the unifying concepts and processes transcend disciplinary boundaries. The next seven categories are clustered for grades K-4, 5-8, and 9-12. Those clusters were selected based on a combination of factors, including cognitive development theory, the classroom experience of teachers, organization of schools, and the frameworks of other disciplinary-based standards. References for additional reading for all the content standards are presented at the end of Chapter 6.
The sequence of the seven grade-level content standards is not arbitrary: Each standard subsumes the knowledge and skills of other standards. Students' understandings and abilities are grounded in the experience of inquiry, and inquiry is the foundation for the development of understandings and abilities of the other content standards. The personal and social aspects of science are emphasized increasingly in the progression from science as inquiry standards to the history and nature of science standards. Students need solid knowledge and understanding in physical, life, and earth and space science if they are to apply science.
Multidisciplinary perspectives also increase from the subject-matter standards to the standard on the history and nature of science, providing many opportunities for integrated approaches to science teaching.
Unifying Concepts and Processes Standard
Conceptual and procedural schemes unify science disciplines and provide students with powerful ideas to help them understand the natural world. Because of the underlying principles embodied in this standard, the understandings and abilities described here are repeated in the other content standards. Unifying concepts and processes include
-
Systems, order, and organization.
-
Evidence, models, and explanation.
-
Change, constancy, and measurement.
-
Evolution and equilibrium.
-
Form and function.
This standard describes some of the integrative schemes that can bring together students' many experiences in science education across grades K-12. The unifying concepts and processes standard can be the focus of instruction at any grade level but should always be closely linked to outcomes aligned with other content standards. In the
early grades, instruction should establish the meaning and use of unifying concepts and processes—for example, what it means to measure and how to use measurement tools. At the upper grades, the standard should facilitate and enhance the learning of scientific concepts and principles by providing students with a big picture of scientific ideas—for example, how measurement is important in all scientific endeavors.
Science as Inquiry Standards
In the vision presented by the Standards, inquiry is a step beyond ''science as a process," in which students learn skills, such as observation, inference, and experimentation. The new vision includes the "processes of science" and requires that students combine processes and scientific knowledge as they use scientific reasoning and critical thinking to develop their understanding of science. Engaging students in inquiry helps students develop
-
Understanding of scientific concepts.
-
An appreciation of "how we know" what we know in science.
-
Understanding of the nature of science.
-
Skills necessary to become independent inquirers about the natural world.
-
The dispositions to use the skills, abilities, and attitudes associated with science.
TABLE 6.1. SCIENCE AS INQUIRY STANDARDS
|
LEVELS K-4 |
LEVELS 5-8 |
LEVELS 9-12 |
|
Abilities necessary to do scientific inquiry |
Abilities necessary to do scientific inquiry |
Abilities necessary to do scientific inquiry |
|
Understanding about scientific inquiry |
Understanding about scientific inquiry |
Understanding about scientific inquiry |
Science as inquiry is basic to science education and a controlling principle in the ultimate organization and selection of students' activities. The standards on inquiry highlight the ability to conduct inquiry and develop understanding about scientific inquiry. Students at all grade levels and in every domain of science should have the opportunity to use scientific inquiry and develop the ability to think and act in ways associated with inquiry, including asking questions, planning and conducting investigations, using appropriate tools and techniques to gather data, thinking critically and logically about relationships between evidence and explanations, constructing and analyzing alternative explanations, and communicating scientific arguments. Table 6.1 shows the standards for inquiry. The science as inquiry standards are described in terms of activities resulting in student development of certain abilities and in terms of student understanding of inquiry.
Physical Science, Life Science, and Earth and Space Science Standards
The standards for physical science, life science, and earth and space science describe the subject matter of science using three widely accepted divisions of the domain of science. Science subject matter focuses on the science facts, concepts, principles, theories, and models that are important for all students to know, understand, and use. Tables 6.2, 6.3, and 6.4 are the standards for physical science, life science, and earth and space science, respectively.
TABLE 6.2. PHYSICAL SCIENCE STANDARDS
|
LEVELS K-4 |
LEVELS 5-8 |
LEVELS 9-12 |
|
Properties of objects and materials |
Properties and changes of properties in matter |
Structure of atoms |
|
Position and motion of objects |
Motions and forces |
Structure and properties of matter |
|
Light, heat, electricity, and magnetism |
Transfer of energy |
Chemical reactions |
|
|
|
Motions and forces |
|
|
|
Conservation of energy and increase in disorder |
|
|
|
Interactions of energy and matter |
TABLE 6.3. LIFE SCIENCE STANDARDS
|
LEVELS K-4 |
LEVELS 5-8 |
LEVELS 9-12 |
|
Characteristics of organisms |
Structure and function in living systems |
The cell |
|
Life cycles of organisms |
Reproduction and heredity |
Molecular basis of heredity |
|
Organisms and environments |
Regulation and behavior |
Biological evolution |
|
|
Populations and ecosystems |
Interdependence of organisms |
|
|
Diversity and adaptations of organisms |
Matter, energy, and organization in living systems |
|
|
|
Behavior of organisms |
Science and Technology Standards
The science and technology standards in Table 6.5 establish connections between the natural and designed worlds and provide students with opportunities to develop decision-making abilities. They are not standards for technology education; rather, these standards emphasize abilities associated with the process of design and fundamental understandings about the enterprise of science and its various linkages with technology.
As a complement to the abilities developed in the science as inquiry standards,
these standards call for students to develop abilities to identify and state a problem, design a solution—including a cost and risk-and-benefit analysis—implement a solution, and evaluate the solution.
Science as inquiry is parallel to technology as design. Both standards emphasize student development of abilities and understanding. Connections to other domains, such as mathematics, are clarified in Chapter 7, Program Standards.
Science in Personal and Social Perspectives Standards
An important purpose of science education is to give students a means to understand and act on personal and social issues. The science in personal and social perspectives
TABLE 6.4. EARTH AND SPACE SCIENCE STANDARDS
|
LEVELS K-4 |
LEVELS 5-8 |
LEVELS 9-12 |
|
Properties of earth materials |
Structure of the earth system |
Energy in the earth system |
|
Objects in the sky |
Earth's history |
Geochemical cycles |
|
Changes in earth and sky |
Earth in the solar system |
Origin and evolution of the earth system |
|
|
|
Origin and evolution of the universe |
TABLE 6.5. SCIENCE AND TECHNOLOGY STANDARDS
|
LEVELS K-4 |
LEVELS 5-8 |
LEVELS 9-12 |
|
Abilities to distinguish between natural objects and objects made by humans |
Abilities of technological design |
Abilities of technological design |
|
Abilities of technological design |
Understanding about science and technology |
Understanding about science and technology |
|
Understanding about science and technology |
|
|
standards help students develop decision-making skills. Understandings associated with the concepts in Table 6.6 give students a foundation on which to base decisions they will face as citizens.
History and Nature of Science Standards
In learning science, students need to understand that science reflects its history and is an ongoing, changing enterprise. The standards for the history and nature of science recommend the use of history in school science programs to clarify different aspects of scientific inquiry, the human aspects of science, and the role that science has played in the development of various cultures. Table 6.7 provides an overview of this standard.
TABLE 6.6. SCIENCE IN PERSONAL AND SOCIAL PERSPECTIVES
|
LEVELS K-4 |
LEVELS 5-8 |
LEVELS 9-12 |
|
Personal health |
Personal health |
Personal and community health |
|
Characteristics and changes in populations |
Populations, resources, and environments |
Population growth |
|
Types of resources |
Natural hazards |
Natural resources |
|
Changes in environments |
Risks and benefits |
Environmental quality |
|
Science and technology in local challenges |
Science and technology in society |
Natural and human-induced hazards |
|
|
|
Science and technology in local, national, and global challenges |
TABLE 6.7. HISTORY AND NATURE OF SCIENCE STANDARDS
|
LEVELS K-4 |
LEVELS 5-8 |
LEVELS 9-12 |
|
Science as a human endeavor |
Science as a human endeavor |
Science as a human endeavor |
|
|
Nature of science |
Nature of scientific knowledge |
|
|
History of science |
Historical perspectives |
Form of the Content Standards
Below is an example of a content standard. Each content standard states that, as the result of activities provided for all students in the grade level discussed, the content of the standard is to be understood or the abilities are to be developed.
Physical Science (Example)
CONTENT STANDARD B: As a result of the activities in grades K-4, all students should develop an understanding of
-
Properties of objects and materials
-
Position and motion of objects
-
Light, heat, electricity, and magnetism
After each content standard is a section entitled, Developing Student Understanding (or abilities and understanding, when appropriate), which elaborates upon issues associated with opportunities to learn the content. This section describes linkages among student learning, teaching, and classroom situations. This discussion on developing student understanding, including the remarks on the selection of content for grade levels, is based in part on educational research. It also incorporates the experiences of many thoughtful people, including teachers, teacher educators, curriculum developers, and educational researchers. (Some references to research on student understanding and abilities are located at the end of the chapter.)
The next section of each standard is a Guide to the Content Standard, which
describes the fundamental idea that underlie the standard. Content is fundamental if it
-
Represents a central event or phenomenon in the natural world.
-
Represents a central scientific idea and organizing principle.
-
Has rich explanatory power.
-
Guides fruitful investigations.
-
Applies to situations and contexts common to everyday experiences.
-
Can be linked to meaningful learning experiences.
-
Is developmentally appropriate for students at the grade level specified.
TABLE 6.8. CONTENT STANDARDS, GRADES K-4
|
UNIFYING CONCEPTS AND PROCESSES |
SCIENCE AS INQUIRY |
PHYSICAL SCIENCE |
LIFE SCIENCE |
|
Systems, order, and organization |
Abilities necessary to do scientific inquiry |
Properties of objects and materials |
Characteristics of organisms |
|
Evidence, models, and explanation |
Understandings about scientific inquiry |
Position and motion of objects |
Life cycles of organisms |
|
Change, constancy, and measurement |
|
Light, heat, electricity, and magnetism |
Organisms and environments |
|
Evolution and equilibrium |
|
|
|
|
Form and function |
|
|
|
|
EARTH AND SPACE SCIENCE |
SCIENCE AND TECHNOLOGY |
SCIENCE IN PERSONAL AND SOCIAL PERSPECTIVES |
HISTORY AND NATURE OF SCIENCE |
|
Properties of earth materials |
Abilities of technological design |
Personal health |
Science as a human endeavor |
|
Objects in the sky |
Understandings about science and technology |
Characteristics and changes in populations |
|
|
Changes in earth and sky |
Abilities to distinguish between natural objects and objects made by humans |
Types of resources |
|
|
|
|
Changes in environments |
|
|
|
|
Science and technology in local challenges |
|
Criteria for the Content Standards
Three criteria influence the selection of science content. The first is an obligation to the domain of science. The subject matter in the physical, life, and earth and space science standards is central to science education and must be accurate. The presentation in national standards also must accommodate the needs of many individuals who will implement the standards in school science programs. The standards represent science
content accurately and appropriately at all grades, with increasing precision and more scientific nomenclature from kindergarten to grade 12.
The second criterion is an obligation to develop content standards that appropriately represent the developmental and learning abilities of students. Organizing principles were selected that express meaningful links to direct student observations of the natural world. The content is aligned with students' ages and stages of development. This criterion includes increasing emphasis on abstract and conceptual understandings as students progress from kindergarten to grade 12.
Tables 6.8, 6.9, and 6.10 display the standards grouped according to grade levels K-4,
TABLE 6.9. CONTENT STANDARDS, GRADES 5-8
|
UNIFYING CONCEPTS AND PROCESSES |
SCIENCE AS INQUIRY |
PHYSICAL SCIENCE |
LIFE SCIENCE |
|
Systems, order, and organization |
Abilities necessary to do scientific inquiry |
Properties and changes of properties in matter |
Structure and function in living systems |
|
Evidence, models, and explanation |
Understandings about scientific inquiry |
Motions and forces |
Reproduction and heredity |
|
Change, constancy, and measurement |
|
Transfer of energy |
Regulation and behavior |
|
Evolution and equilibrium |
|
|
Populations and ecosystems |
|
Form and function |
|
|
Diversity and adaptations of organisms |
|
EARTH AND SPACE SCIENCE |
SCIENCE AND TECHNOLOGY |
SCIENCE IN PERSONAL AND SOCIAL PERSPECTIVES |
HISTORY AND NATURE OF SCIENCE |
|
Structure of the earth system |
Abilities of technological design |
Personal health |
Science as a human endeavor |
|
Earth's history |
Understandings about science and technology |
Populations, resources, and environments |
Nature of science |
|
Earth in the solar system |
|
Natural hazards |
History of science |
|
|
|
Risks and benefits |
|
|
|
|
Science and technology in society |
|
5-8, and 9-12, respectively. These tables provide an overview of the standards for elementary-, middle-, and high-school science programs.
The third criterion is an obligation to present standards in a usable form for those who must implement the standards, e.g., curriculum developers, science supervisors, teachers, and other school personnel. The standards need to provide enough breadth of content to define the domains of science, and they need to provide enough depth of content to direct the design of science curricula. The descriptions also need to be understandable by school personnel and to accommodate the structures of elementary, middle, and high schools, as well as the grade levels used in national standards for other disciplines.
TABLE 6.10. CONTENT STANDARDS, GRADES 9-12
|
UNIFYING CONCEPTS AND PROCESSES |
SCIENCE AS INQUIRY |
PHYSICAL SCIENCE |
LIFE SCIENCE |
|
Systems, order, and organization |
Abilities necessary to do scientific inquiry |
Structure of atoms |
The cell |
|
Evidence, models, and explanation |
Understandings about scientific inquiry |
Structure and properties of matter |
Molecular basis of heredity |
|
Change, constancy, and measurement |
|
Chemical reactions |
Biological evolution |
|
Evolution and equilibrium |
|
Motions and forces |
Interdependence of organisms |
|
Form and function |
|
Conservation of energy and increase in disorder |
Matter, energy, and organization in living systems |
|
|
|
Interactions of energy and matter |
Behavior of organisms |
|
EARTH AND SPACE SCIENCE |
SCIENCE AND TECHNOLOGY |
SCIENCE IN PERSONAL AND SOCIAL PERSPECTIVES |
HISTORY AND NATURE OF SCIENCE |
|
Energy in the earth system |
Abilities of technological design |
Personal and community health |
Science as a human endeavor |
|
Geochemical cycles |
Understandings about science and technology |
Population growth |
Nature of scientific knowledge |
|
Origin and evolution of the earth system |
|
Natural resources |
Historical perspectives |
|
Origin and evolution of the universe |
|
Environmental quality |
|
|
|
|
Natural and human-induced hazards |
|
|
|
|
Science and technology in local, national, and global challenges |
|
Use of the Content Standards
Many different individuals and groups will use the content standards for a variety of purposes. All users and reviewers are reminded that the content described is not a science curriculum. Content is what students should learn. Curriculum is the way content is organized and emphasized; it includes structure, organization, balance, and presentation of the content in the classroom. Although the structure for the content standards organizes the understanding and abilities to be acquired by all students K-12, that structure does not imply any particular organization for science curricula.
Persons responsible for science curricula, teaching, assessment and policy who use the Standards should note the following
-
None of the eight categories of content
-
standards should be eliminated. For instance, students should have opportunities to learn science in personal and social perspectives and to learn about the history and nature of science, as well as to learn subject matter, in the school science program.
-
No standards should be eliminated from a category. For instance, "biological evolution" cannot be eliminated from the life science standards.
-
Science content can be added. The connections, depth, detail, and selection of topics can be enriched and varied as appropriate for individual students and school science
-
programs. However, addition of content must not prevent the learning of fundamental concepts by all students.
-
The content standards must be used in the context of the standards on teaching and assessment. Using the standards with traditional teaching and assessment strategies defeats the intentions of the National Science Education Standards.
As science advances, the content standards might change, but the conceptual organization will continue to provide students with knowledge, understanding, and abilities that will improve their scientific literacy.
Changing Emphases
The National Science Education Standards envision change throughout the system. The science content standards encompass the following changes in emphases:
|
LESS EMPHASIS ON |
MORE EMPHASIS ON |
|
Knowing scientific facts and information |
Understanding scientific concepts and developing abilities of inquiry |
|
Studying subject matter disciplines (physical, life, earth sciences) for their own sake |
Learning subject matter disciplines in the context of inquiry, technology, science in personal and social perspectives, and history and nature of science |
|
Separating science knowledge and science process |
Integrating all aspects of science content |
|
Covering many science topics |
Studying a few fundamental science concepts |
|
Implementing inquiry as a set of processes |
Implementing inquiry as instructional strategies, abilities, and ideas to be learned |
|
CHANGING EMPHASES TO PROMOTE INQUIRY |
|
|
LESS EMPHASIS ON |
MORE EMPHASIS ON |
|
Activities that demonstrate and verify science content |
Activities that investigate and analyze science questions |
|
Investigations confined to one class period |
Investigations over extended periods of time |
|
Process skills out of context |
Process skills in context |
|
Emphasis on individual process skills such as observation or inference |
Using multiple process skills—manipulation, cognitive, procedural |
|
Getting an answer |
Using evidence and strategies for developing or revising an explanation |
|
Science as exploration and experiment |
Science as argument and explanation |
|
Providing answers to questions about science content |
Communicating science explanations |
|
Individuals and groups of students analyzing and synthesizing data without defending a conclusion |
Groups of students often analyzing and synthesizing data after defending conclusions |
|
Doing few investigations in order to leave time to cover large amounts of content |
Doing more investigations in order to develop understanding, ability, values of inquiry and knowledge of science content |
|
Concluding inquiries with the result of the experiment |
Applying the results of experiments to scientific arguments and explanations |
|
Management of materials and equipment |
Management of ideas and information |
|
Private communication of student ideas and conclusions to teacher |
Public communication of student ideas and work to classmates |
Content Standard: K—12
Unifying Concepts and Processes
STANDARD: As a result of activities in grades K-12, all students should develop understanding and abilities aligned with the following concepts and processes:
-
Systems, order, and organization
-
Evidence, models, and explanation
-
Constancy, change, and measurement
-
Evolution and equilibrium
-
Form and function
Developing Student Understanding
This standard presents broad unifying concepts and processes that complement the analytic, more discipline-based perspectives presented in the other content standards. The conceptual and procedural schemes in this standard provide students with productive and insightful ways of thinking about and integrating a range of basic ideas that explain the natural and designed world.
The unifying concepts and processes in this standard are a subset of the many unifying ideas in science and technology. Some of the criteria used in the selection and organization of this standard are
-
The concepts and processes provide connections between and among traditional scientific disciplines.
-
The concepts and processes are fundamental and comprehensive.
-
The concepts and processes are understandable and usable by people who will implement science programs.
-
The concepts and processes can be expressed and experienced in a developmentally appropriate manner during K-12 science education.
Each of the concepts and processes of this standard has a continuum of complexity that
lends itself to the K-4, 5-8, and 9-12 grade-level clusters used in the other content standards. In this standard, however, the boundaries of disciplines and grade-level divisions are not distinct—teachers should develop students' understandings continuously across grades K-12.
Systems and subsystems, the nature of models, and conservation are fundamental concepts and processes included in this standard. Young students tend to interpret phenomena separately rather than in terms of a system. Force, for example, is perceived as a property of an object rather than the result of interacting bodies. Students do not recognize the differences between parts and whole systems, but view them as similar. Therefore, teachers of science need to help students recognize the properties of objects, as emphasized in grade-level content standards, while helping them to understand systems.
As another example, students in middle school and high school view models as physical copies of reality and not as conceptual representations. Teachers should help students understand that models are developed and tested by comparing the model with observations of reality.
Teachers in elementary grades should recognize that students' reports of changes in such things as volume, mass, and space can represent errors common to well-recognized developmental stages of children.
Guide to the Content Standard
Some of the fundamental concepts that underlie this standard are
SYSTEMS, ORDER, AND ORGANIZATION The natural and designed world is complex; it is too large and complicated to investigate and comprehend all at once. Scientists and students learn to define small portions for the convenience of investigation. The units of investigation can be referred to as ''systems." A system is an organized group of related objects or components that form a whole. Systems can consist, for example, of organisms, machines, fundamental particles, galaxies, ideas, numbers, transportation, and education. Systems have boundaries, components, resources flow (input and output), and feedback.
The goal of this standard is to think and analyze in terms of systems. Thinking and analyzing in terms of systems will help students keep track of mass, energy, objects, organisms, and events referred to in the other content standards. The idea of simple systems encompasses subsystems as well as identifying the structure and function of systems, feedback and equilibrium, and the distinction between open and closed systems.
Science assumes that the behavior of the universe is not capricious, that nature is the same everywhere, and that it is understandable and predictable. Students can develop an understanding of regularities in systems, and by extension, the universe; they then can develop understanding of basic laws, theories, and models that explain the world.
Newton's laws of force and motion, Kepler's laws of planetary motion, conservation laws, Darwin's laws of natural selection, and chaos theory all exemplify the idea of order and regularity. An assumption of order establishes the basis for cause-effect relationships and predictability.
[See Program Standard C]
Prediction is the use of knowledge to identify and explain observations, or changes, in advance. The use of mathematics, especially
probability, allows for greater or lesser certainty of predictions.
Order—the behavior of units of matter, objects, organisms, or events in the universe—can be described statistically. Probability is the relative certainty (or uncertainty) that individuals can assign to selected events happening (or not happening) in a specified space or time. In science, reduction of uncertainty occurs through such processes as the development of knowledge about factors influencing objects, organisms, systems, or events; better and more observations; and better explanatory models.
Types and levels of organization provide useful ways of thinking about the world. Types of organization include the periodic table of elements and the classification of organisms. Physical systems can be described at different levels of organization—such as fundamental particles, atoms, and molecules. Living systems also have different levels of organization—for example, cells, tissues, organs, organisms, populations, and communities. The complexity and number of fundamental units change in extended hierarchies of organization. Within these systems, interactions between components occur. Further, systems at different levels of organization can manifest different properties and functions.
[See Content Standard A (all grade levels)]
EVIDENCE, MODELS, AND EXPLANATION Evidence consists of observations and data on which to base scientific explanations. Using evidence to understand interactions allows individuals to predict changes in natural and designed systems.
Models are tentative schemes or structures that correspond to real objects, events, or classes of events, and that have explanatory power. Models help scientists and engineers understand how things work. Models take many forms, including physical objects, plans, mental constructs, mathematical equations, and computer simulations.
Scientific explanations incorporate existing scientific knowledge and new evidence
|
As students develop and . . . understand more science concepts and processes, their explanations should become more sophisticated . . . frequently include a rich scientific knowledge base, evidence of logic, higher levels of analysis, greater tolerance of criticism and uncertainty. |
from observations, experiments, or models into internally consistent, logical statements. Different terms, such as "hypothesis," "model," "law," "principle," ''theory," and "paradigm" are used to describe various types of scientific explanations. As students develop and as they understand more science concepts and processes, their explanations should become more sophisticated. That is, their scientific explanations should more frequently include a rich scientific knowledge base, evidence of logic, higher levels of analysis, greater tolerance of criticism and uncertainty, and a clearer demonstration of the relationship between logic, evidence, and current knowledge.
[See Content Standard B (grades 9-12)]
CONSTANCY, CHANGE, AND MEASUREMENT Although most things are in the process of becoming different—changing—some properties of objects and processes are characterized by constancy, including the speed
of light, the charge of an electron, and the total mass plus energy in the universe. Changes might occur, for example, in properties of materials, position of objects, motion, and form and function of systems. Interactions within and among systems result in change. Changes vary in rate, scale, and pattern, including trends and cycles.
Energy can be transferred and matter can be changed. Nevertheless, when measured, the sum of energy and matter in systems, and by extension in the universe, remains the same.
Changes in systems can be quantified. Evidence for interactions and subsequent change and the formulation of scientific explanations are often clarified through quantitative distinctions—measurement. Mathematics is essential for accurately measuring change.
Different systems of measurement are used for different purposes. Scientists usually use the metric system. An important part of measurement is knowing when to use which system. For example, a meteorologist might use degrees Fahrenheit when reporting the weather to the public, but in writing scientific reports, the meteorologist would use degrees Celsius.
Scale includes understanding that different characteristics, properties, or relationships within a system might change as its dimensions are increased or decreased.
Rate involves comparing one measured quantity with another measured quantity, for example, 60 meters per second. Rate is also a measure of change for a part relative to the whole, for example, change in birth rate as part of population growth.
[See Content Standard C (grades 9-12)]
EVOLUTION AND EQUILIBRIUM Evolution is a series of changes, some gradual and some sporadic, that accounts for the present form and function of objects, organisms, and natural and designed systems. The general idea of evolution is that the present arises from materials and forms of the past. Although evolution is most commonly associated with the biological theory explaining the process of descent with modification of organisms from common ancestors, evolution also describes changes in the universe.
Equilibrium is a physical state in which forces and changes occur in opposite and off-setting directions: for example, opposite forces are of the same magnitude, or off-setting changes occur at equal rates. Steady state, balance, and homeostasis also describe equilibrium states. Interacting units of matter tend toward equilibrium states in which the energy is distributed as randomly and uniformly as possible.
[See Content Standard C (grades 5-8)]
FORM AND FUNCTION Form and function are complementary aspects of objects, organisms, and systems in the natural and designed world. The form or shape of an object or system is frequently related to use, operation, or function. Function frequently relies on form. Understanding of form and function applies to different levels of organization. Students should be able to explain function by referring to form and explain form by referring to function.
Content Standards: K-4
Science as Inquiry
Content Standard A
As a result of activities in grades K-4, all students should develop
-
Abilities necessary to do scientific inquiry
-
Understanding about scientific inquiry
Developing Student Abilities and Understanding
From the earliest grades, students should experience science in a form that engages them in the active construction of ideas and explanations and enhances their opportunities to develop the abilities of doing science. Teaching science as inquiry provides teachers with the opportunity to develop student abilities and to enrich student understanding of science. Students should do science in ways that are within their developmental capabilities. This standard sets forth some abilities of scientific inquiry appropriate for students in grades K-4.
In the early years of school, students can investigate earth materials, organisms, and properties of common objects. Although children develop concepts and vocabulary from such experiences, they also should develop inquiry skills. As students focus on the processes of doing investigations, they develop the ability to ask scientific questions, investigate aspects of the world around them, and use their observations to construct reasonable explanations for the questions posed. Guided by teachers, students continually develop their science knowledge. Students should also learn through the inquiry process how to communicate about their own and their peers' investigations and explanations.
There is logic behind the abilities outlined in the inquiry standard, but a step-by-step sequence or scientific method is not implied. In practice, student questions might arise from previous investigations, planned classroom activities, or questions students ask each other. For instance, if children ask each other how animals are similar and different, an investigation
might arise into characteristics of organisms they can observe.
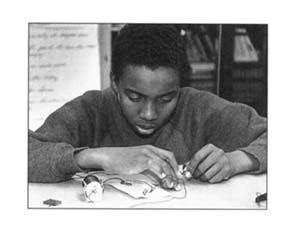
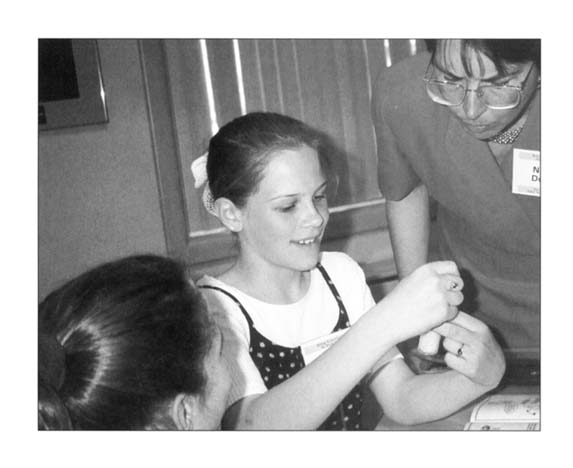
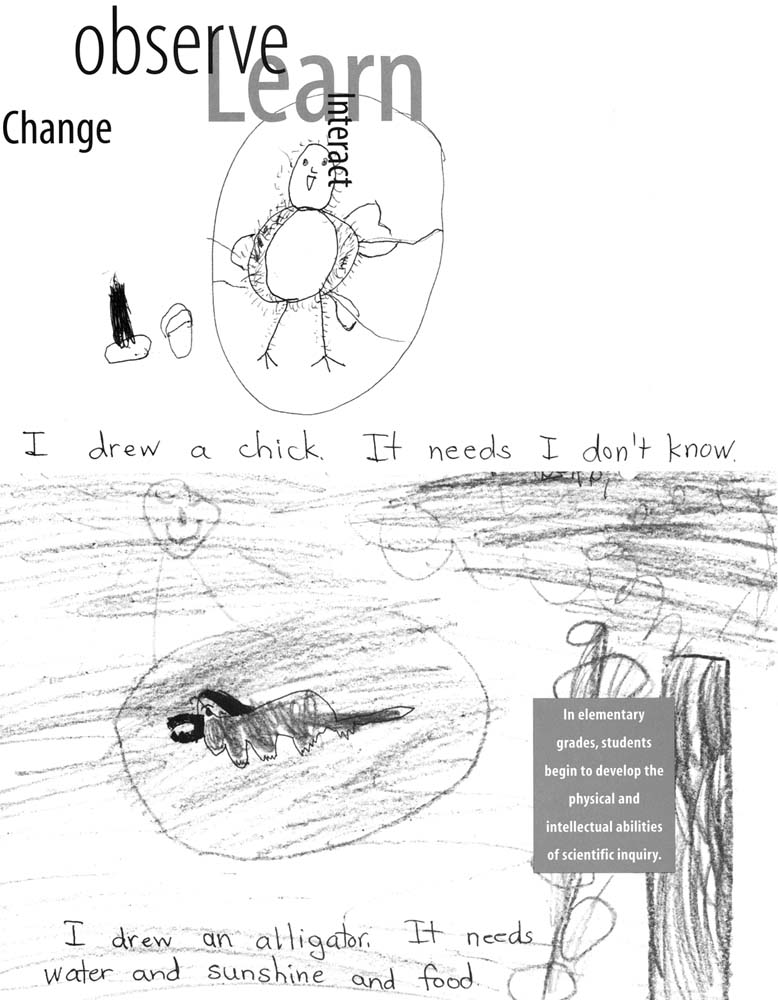
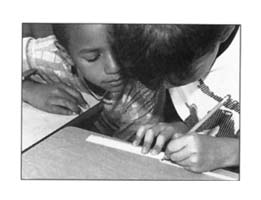
Full inquiry involves asking a simple question, completing an investigation, answering the question, and presenting the results to others. In elementary grades, students begin to develop the physical and intellectual abilities of scientific inquiry. They can design investigations to try things to see what happens—they tend to focus on concrete results of tests and will entertain the idea of a "fair" test (a test in which only one variable at a time is changed). However, children in K-4 have difficulty with experimentation as a process of testing ideas and the logic of using evidence to formulate explanations.
Guide to the Content Standard
Fundamental abilities and concepts that underlie this standard include
ABILITIES NECESSARY TO DO SCIENTIFIC INQUIRY
ASK A QUESTION ABOUT OBJECTS, ORGANISMS, AND EVENTS IN THE ENVIRONMENT. This aspect of the standard emphasizes students asking questions that they can answer with scientific knowledge, combined with their own observations. Students should answer their questions by seeking information from reliable sources of scientific information and from their own observations and investigations.
PLAN AND CONDUCT A SIMPLE INVESTIGATION. In the earliest years, investigations are largely based on systematic observations. As students develop, they may design and conduct simple experiments to answer questions. The idea of a fair test is possible for many students to consider by fourth grade.
EMPLOY SIMPLE EQUIPMENT AND TOOLS TO GATHER DATA AND EXTEND THE SENSES. In early years, students develop simple skills, such as how to observe, measure, cut, connect, switch, turn on and off, pour, hold, tie, and hook. Beginning with simple instruments, students can use rulers to measure the length, height, and depth of objects and materials; thermometers to measure temperature; watches to measure time; beam balances and spring scales to measure weight and force; magnifiers to observe objects and organisms; and microscopes to observe the finer details of plants, animals, rocks, and other materials. Children also develop skills in the use of computers and calculators for conducting investigations.
USE DATA TO CONSTRUCT A REASONABLE EXPLANATION. This aspect of the standard emphasizes the students' thinking as they use data to formulate explanations. Even at the earliest grade levels, students should learn what constitutes evidence and judge the merits or strength of the data and information that will be used to make explanations. After students propose an explanation, they will appeal to the knowledge and evidence they obtained to support their explanations. Students should check their explanations against scientific knowledge, experiences, and observations of others.
[See Teaching Standard B]
COMMUNICATE INVESTIGATIONS AND EXPLANATIONS. Students should begin developing the abilities to communicate, critique, and analyze their work and the work of other students. This communication
might be spoken or drawn as well as written.
UNDERSTANDINGS ABOUT SCIENTIFIC INQUIRY
[See Content Standard G (grades K-4)]
[See Program Standard C]
-
Scientific investigations involve asking and answering a question and comparing the answer with what scientists already know about the world.
-
Scientists use different kinds of investigations depending on the questions they are trying to answer. Types of investigations include describing objects, events, and organisms; classifying them; and doing a fair test (experimenting).
-
Simple instruments, such as magnifiers, thermometers, and rulers, provide more information than scientists obtain using only their senses.
-
Scientists develop explanations using observations (evidence) and what they already know about the world (scientific knowledge). Good explanations are based on evidence from investigations.
-
Scientists make the results of their investigations public; they describe the investigations in ways that enable others to repeat the investigations.
-
Scientists review and ask questions about the results of other scientists' work.
Physical Science
Content Standard B
As a result of the activities in grades K-4, all students should develop an understanding of
-
Properties of objects and materials
-
Position and motion of objects
-
Light, heat, electricity, and magnetism
Developing Student Understanding
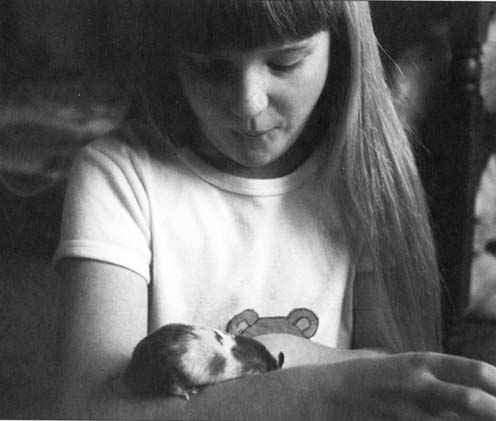
During their early years, children's natural curiosity leads them to explore the world by observing and manipulating common objects and materials in their environment. Children compare, describe, and sort as they begin to form explanations of the world. Developing a subject-matter knowledge base to explain and
Full inquiry involves asking a simple question, completing an investigation, answering the question, and presenting the results to others.
predict the world requires many experiences over a long period. Young children bring experiences, understanding, and ideas to school; teachers provide opportunities to continue children's explorations in focused settings with other children using simple tools, such as magnifiers and measuring devices.
Physical science in grades K-4 includes topics that give students a chance to increase their understanding of the characteristics of objects and materials that they encounter daily. Through the observation, manipulation, and classification of common objects, children reflect on the similarities and differences of the objects. As a result, their initial sketches and single-word descriptions lead to increasingly more detailed drawings and richer verbal descriptions. Describing, grouping, and sorting solid objects and materials is possible early in this grade range. By grade 4, distinctions between the properties of objects and materials can be understood in specific contexts, such as a set of rocks or living materials.
Willie the Hamster
Ms. W. encourages students to engage in an investigation initiated by a question that signals student interest. The context for the investigation is one familiar to the students—a pet in the classroom. She teaches some of the important aspects of inquiry by asking the students to consider alternative explanations, to look at the evidence, and to design a simple investigation to test a hypothesis. Ms. W. has planned the science classes carefully, but changes her plans to respond to student interests, knowing the goals for the school science program and shaping the activities to be consistent with those goals. She understands what is developmentally appropriate for students of this age—she chooses not to launch into an abstract explanation of evaporation. She has a classroom with the resources she needs for the students to engage in an inquiry activity.
[This example highlights some elements of Teaching Standards A, B, D, E, and F; K-4 Content Standards A and B; Program Standards A, C, and D; and System Standard D.]
George is annoyed. There was plenty of water in the watering can when he left it on the windowsill on Friday. Now the can is almost empty, and he won't have time to go the restroom and fill it so that he can water the plants before science class starts. As soon as Ms. W. begins science class, George raises his hand to complain about the disappearance of the water. "Who used the water?" he asks. "Did someone drink it? Did someone spill it?" None of the students in the class touched the watering can, and Ms. W asks what the students think happened to the water.
Marie has an idea. If none of the children took the water, then it must be that Willie, their pet hamster, is leaving his cage at night and drinking the water. The class decides to test Marie's idea by covering the watering can so that Willie cannot drink the water. The children implement their investigation, and the next morning observe that the water level has not dropped. The children now have proof that their explanation is correct. Ms. W. asks the class to consider alternative explanations consistent with their observations. Are they sure that Willie is getting out of his cage at night? The children are quite certain that he is.
"How can you be sure?" asks Ms. W. The children devise an ingenious plan to convince her that Willie is getting out of the cage. They place his cage in the middle of the sand table and smooth the sand. After several days and nights, the children observe that no footprints have appeared in the sand, and the water level has not changed. The children now conclude that Willie is not getting out of his cage at night.
"But wait." says Kahena, "Why should Willie get out of his cage? Willie can see that the watering can is covered." So the class decides to leave the cage in the middle of the sand table and take the cover off the watering can. The water level begins to drop again, yet there are no footprints in the sand. Now the children dismiss the original idea about the disappearance of the water, and Ms. W. takes the opportunity to give the class more experiences with the disappearance of water.
At Ms. W.'s suggestion, a container of water with a wide top is placed on the windowsill and the class measures and records changes in the water level each day using strips of paper to represent the height of the
water. These strips are dated and pasted on a large sheet of paper to create a bar graph. After a few days, the students discern a pattern: The level of water fell steadily but did not decrease the same amount each day. After considerable discussion about the differences, Patrick observes that when his mother dries the family's clothes, she puts them in the dryer. Patrick notes that the clothes are heated inside the dryer and that when his mother does not set the dial on the dryer to heat, the clothes just spin around and do not dry as quickly. Patrick suggests that water might disappear faster when it is warmer.
Based on their experience using strips of paper to measure changes in the level of water and in identifying patterns of change, the students and Ms. W. plan an investigation to learn whether water disappears faster when it is warmer.
The children's experiences with the disappearance of water continue with an investigation about how the size (area) of the uncovered portion of the container influences how fast the water disappears and another where the children investigate whether using a fan to blow air over the surface of a container of water makes the water disappear faster.
Young children begin their study of matter by examining and qualitatively describing objects and their behavior. The important but abstract ideas of science, such as atomic structure of matter and the conservation of energy, all begin with observing and keeping track of the way the world behaves. When carefully observed, described, and measured, the properties of objects, changes in properties over time, and the changes that occur when materials interact provide the necessary precursors to the later introduction of more abstract ideas in the upper grade levels.
Students are familiar with the change of state between water and ice, but the idea of liquids having a set of properties is more nebulous and requires more instructional effort than working with solids. Most students will have difficulty with the generalization that many substances can exist as either a liquid or a solid. K-4 students do not understand that water exists as a gas when it boils or evaporates; they are more likely to think that water disappears or goes into the sky. Despite that limitation, students can conduct simple investigations with heating and evaporation that develop inquiry skills and familiarize them with the phenomena.
When students describe and manipulate objects by pushing, pulling, throwing, dropping, and rolling, they also begin to focus on the position and movement of objects: describing location as up, down, in front, or behind, and discovering the various kinds of motion and forces required to control it. By experimenting with light, heat, electricity, magnetism, and sound, students begin to understand that phenomena can be observed, measured, and controlled in various ways. The children cannot understand a complex concept such as energy. Nonetheless, they have intuitive notions of energy—for example, energy is needed to get things done; humans get energy from food. Teachers can build on the intuitive notions of students without requiring them to memorize technical definitions.
Sounds are not intuitively associated with the characteristics of their source by younger K-4 students, but that association can be developed by investigating a variety of concrete phenomena toward the end of the K-4 level. In most children's minds, electricity begins at a source and goes to a target. This mental model can be seen in students' first attempts to light a bulb using a battery and wire by attaching one wire to a bulb. Repeated activities will help students develop an idea of a circuit late in this grade range and begin to grasp the effect of more than one battery. Children cannot distinguish between heat and temperature at this age; therefore, investigating heat necessarily must focus on changes in temperature.
As children develop facility with language, their descriptions become richer and include more detail. Initially no tools need to be used, but children eventually learn that they can add to their descriptions by measuring objects—first with measuring devices they create and then by using conventional measuring instruments, such as rulers, balances, and thermometers. By recording data and making graphs and charts, older children can search for patterns and order in their work and that of their peers. For example, they can determine the
speed of an object as fast, faster, or fastest in the earliest grades. As students get older, they can represent motion on simple grids and graphs and describe speed as the distance traveled in a given unit of time.
Guide to the Content Standard
Fundamental concepts and principles that underlie this standard include
PROPERTIES OF OBJECTS AND MATERIALS
-
Objects have many observable properties, including size, weight, shape, color, temperature, and the ability to react with other substances. Those properties can be measured using tools, such as rulers, balances, and thermometers.
-
Objects are made of one or more materials, such as paper, wood, and metal. Objects can be described by the properties of the materials from which they are made, and those properties can be used to separate or sort a group of objects or materials.
-
Materials can exist in different states—solid, liquid, and gas. Some common materials, such as water, can be changed from one state to another by heating or cooling.
POSITION AND MOTION OF OBJECTS
-
The position of an object can be described by locating it relative to another object or the background.
-
An object's motion can be described by tracing and measuring its position over time.
-
The position and motion of objects can be changed by pushing or pulling. The size of the change is related to the strength of the push or pull.
-
Sound is produced by vibrating objects. The pitch of the sound can be varied by changing the rate of vibration.
LIGHT, HEAT, ELECTRICITY, AND MAGNETISM
-
Light travels in a straight line until it strikes an object. Light can be reflected by a mirror, refracted by a lens, or absorbed by the object.
-
Heat can be produced in many ways, such as burning, rubbing, or mixing one substance with another. Heat can move from one object to another by conduction.
-
Electricity in circuits can produce light, heat, sound, and magnetic effects. Electrical circuits require a complete loop through which an electrical current can pass.
-
Magnets attract and repel each other and certain kinds of other materials.
Life Science
Content Standard C
As a result of activities in grades K-4, all students should develop understanding of
-
The characteristics of organisms
-
Life cycles of organisms
-
Organisms and environments
Developing Student Understanding
During the elementary grades, children build understanding of biological concepts through direct experience with living things, their life cycles, and their habitats. These experiences emerge from the sense of wonder
and natural interests of children who ask questions such as: ''How do plants get food? How many different animals are there? Why do some animals eat other animals? What is the largest plant? Where did the dinosaurs go?" An understanding of the characteristics of organisms, life cycles of organisms, and of the complex interactions among all components of the natural environment begins with questions such as these and an understanding of how individual organisms maintain and continue life. Making sense of the way organisms live in their environments will develop some understanding of the diversity of life and how all living organisms depend on the living and nonliving environment for survival. Because the child's world at grades K-4 is closely associated with the home, school, and immediate environment, the study of organisms should include observations and interactions within the natural world of the child. The experiences and activities in grades K-4 provide a concrete foundation for the progressive development in the later grades of major biological concepts, such as evolution, heredity, the cell, the biosphere, interdependence, the behavior of organisms, and matter and energy in living systems.
Children's ideas about the characteristics of organisms develop from basic concepts of living and nonliving. Piaget noted, for instance, that young children give anthropomorphic explanations to organisms. In lower elementary grades, many children associate "life" with any objects that are active in any way. This view of life develops into one in which movement becomes the defining characteristic. Eventually children incorporate other concepts, such as eating, breathing, and reproducing to define life. As students have a variety of experiences with organisms, and subsequently develop a knowledge base in the life sciences, their anthropomorphic attributions should decline.
In classroom activities such as classification, younger elementary students generally use mutually exclusive rather than hierarchical categories. Young children, for example, will use two groups, but older children will use several groups at the same time. Students do not consistently use classification schemes similar to those used by biologists until the upper elementary grades.
As students investigate the life cycles of organisms, teachers might observe that young children do not understand the continuity of life from, for example, seed to seedling or larvae to pupae to adult. But teachers will notice that by second grade, most students know that children resemble their parents. Students can also differentiate learned from inherited characteristics. However, students might hold some naive thoughts about inheritance, including the belief that traits are inherited from only one parent, that certain traits are inherited exclusively from one parent or the other, or that all traits are simply a blend of characteristics from each parent.
Young children think concretely about individual organisms. For example, animals are associated with pets or with animals kept in a zoo. The idea that organisms depend on their environment (including other organisms in some cases) is not well developed in young children. In grades K-4, the focus should be on establishing the primary association of organisms with their environments and the secondary ideas of dependence on
various aspects of the environment and of behaviors that help various animals survive. Lower elementary students can understand the food link between two organisms.
Guide to the Content Standard
Fundamental concepts and principles that underlie this standard include
THE CHARACTERISTICS OF ORGANISMS
-
Organisms have basic needs. For example, animals need air, water, and food; plants require air, water, nutrients, and light. Organisms can survive only in environments in which their needs can be met. The world has many different environments, and distinct environments support the life of different types of organisms.
-
Each plant or animal has different structures that serve different functions in growth, survival, and reproduction. For example, humans have distinct body structures for walking, holding, seeing, and talking.
-
The behavior of individual organisms is influenced by internal cues (such as hunger) and by external cues (such as a change in the environment). Humans and other organisms have senses that help them detect internal and external cues.
LIFE CYCLES OF ORGANISMS
-
Plants and animals have life cycles that include being born, developing into adults, reproducing, and eventually dying. The details of this life cycle are different for different organisms.
-
Plants and animals closely resemble their parents.
-
Many characteristics of an organism are inherited from the parents of the organism, but other characteristics result from an individual's interactions with the environment. Inherited characteristics include the color of flowers and the number of limbs of an animal. Other features, such as the ability to ride a bicycle, are learned through interactions with the environment and cannot be passed on to the next generation.
ORGANISMS AND THEIR ENVIRONMENTS
[See Content Standard F (grades K-4)]
-
All animals depend on plants. Some animals eat plants for food. Other animals eat animals that eat the plants.
-
An organism's patterns of behavior are related to the nature of that organism's environment, including the kinds and numbers of other organisms present, the availability of food and resources, and the physical characteristics of the environment. When the environment changes, some plants and animals survive and reproduce, and others die or move to new locations.
-
All organisms cause changes in the environment where they live. Some of these changes are detrimental to the organism or other organisms, whereas others are beneficial.
-
Humans depend on their natural and constructed environments. Humans change environments in ways that can be either beneficial or detrimental for themselves and other organisms.
Earth and Space Science
Content Standard D
As a result of their activities in grades K-4, all students should develop an understanding of
-
Properties of earth materials
-
Objects in the sky
-
Changes in earth and sky
Developing Student Understanding
Young children are naturally interested in everything they see around them—soil, rocks, streams, rain, snow, clouds, rainbows, sun, moon, and stars. During the first years of school, they should be encouraged to observe closely the objects and materials in their environment, note their properties, distinguish one from another and develop their own explanations of how things become the way they are. As children become more familiar with their world, they can be guided to observe changes, including cyclic changes, such as night and day and the seasons; predictable trends, such as growth and decay, and less consistent changes, such as weather or the appearance of meteors. Children should have opportunities to observe rapid changes, such as the movement of water in a stream, as well as gradual changes, such as the erosion of soil and the change of the seasons.
Children come to school aware that earth's surface is composed of rocks, soils, water, and living organisms, but a closer look will help them identify many additional properties of earth materials. By carefully observing and describing the properties of many rocks, children will begin to see that some rocks are made of a single substance, but most are made of several substances. In later grades, the substances can be identified as minerals. Understanding rocks and minerals should not be extended to the study of the source of the rocks, such as sedimentary, igneous, and metamorphic, because the origin of rocks and minerals has little meaning to young children.
Playgrounds and nearby vacant lots and parks are convenient study sites to observe a variety of earth materials. As students collect rocks and observe vegetation, they will become aware that soil varies from place to place in its color, texture, and reaction to water. By planting seeds in a variety of soil samples, they can compare the effect of different soils on plant growth. If they revisit study sites regularly, children will develop an understanding that earth's surface is constantly changing. They also can simulate some changes, such as erosion, in a small tray of soil or a stream table and compare their observations with photographs of similar, but larger scale, changes.
By observing the day and night sky regularly, children in grades K-4 will learn to identify sequences of changes and to look for patterns in these changes. As they observe changes, such as the movement of an object's shadow during the course of a day, and the positions of the sun and the moon, they will find the patterns in these movements. They can draw the moon's shape for each evening on a calendar and then determine the pattern in the shapes over several weeks. These understandings should be confined to observations,
Weather
Mr. H. plans a year-long science activity integral to the entire school science program. The students are to observe and record information about the daily weather. Mr. H. begins the activity by assessing what students know, but realizes that students might use terms without understanding. He focuses on the aspects of weather that his teaching experience and knowledge from research on student abilities lead him to believe are developmentally appropriate, and he keeps a record of terms to help him modify his plans as the activity progresses. Students design instruments for measuring weather that are within the range of their skills and a parent provides expertise. They make measurements using their mathematical knowledge and skills; they organize data in a meaningful way and communicate the data to other students. There is an ebb and flow of teacher-directed, whole-class discussions and small-group work sessions.
[This example highlights some elements of Teaching Standards A, B, D, and E; Professional Development Standard C; the Content Standard on Unifying Concepts and Processes; K-4 Content Standards A, D, E, and F; and Program Standards A, C, and D.]
Mr. H.'s fourth grade class was in charge of the school weather station as part of the schoolwide science program. In planning for the weather station, Mr. H. reviewed the objectives he and his colleagues had defined for the activity. Because of their age, the students would not be studying the causes of weather change such as air pressure, the worldwide air currents, or the effects of land and sea masses. Rather, over the course of the year, they would identify and observe the elements of weather; devise and use measurement and data collection strategies; build measurement instruments; analyze data to find patterns and relationships within the data; and communicate their work to the entire school.
Mr. H. introduced the weather station to the students soon after school opened. After a discussion of students' experiences with and ideas about weather, Mr. H. asked the class what kinds of information they thought would be important to collect and how they might go about collecting it. The children quickly identified the need to record whether the day was sunny or cloudy, presence of precipitation, and the temperature. Mr. H. asked some questions, and the list became more complicated: What kinds of clouds were evident? How much precipitation accumulated? How did temperature change during the day? What was the wind speed and direction? One student said that he had heard on the weather report that there was a high-pressure front moving in. What is a front, he asked, and is it important? At the end of the discussion, someone mentioned humidity and recalled the muggy heat wave of the summer.
When Mr. H. thought about the lesson and reviewed what he was going to do next, he realized that much of what the students had said was predictable. He wondered about the last two items—humidity and air pressure. Those concepts were well beyond the students' ability to fully understand, yet they were familiar with the words. Mr. H. decided to continue, as he had planned, focusing on the most observable weather conditions and see whether the children's interests in humidity and air pressure were maintained.
The class spent time the next week discussing and planning how they were going
to measure weather conditions, what tools would they need, and how they would collect and organize their data. Groups worked in the classroom and in the library; each group chose one aspect of weather for its focus. Mr. H. spent some time with each group supporting their ideas, pushing them further, and providing specific guidance when needed. He encouraged the groups to get together and compare notes. Twice during the week, the whole class came together and groups shared their work while students critiqued and offered ideas.
Several weeks later, the weather station of the fourth grade was in operation. After much work, including some trial and error, library research, and the helpful input of a parent who was a skilled mechanic, the students were recording data twice a day for wind direction and speed, using a class-made anemometer and wind vane; temperature,
using a commercial thermometer (the students did make a thermometer following the directions in a book but decided that they would get better data with a commercial one); precipitation, using a rain gauge; and cloud formation. Design of the anemometer was extremely difficult. It was easy to build something that would turn in the wind, but the students needed help in figuring how to measure the speed. The children were also measuring air pressure with a homemade barometer that a parent had helped one group construct. Mr. H. supported this, although the children's ability to understand the concept was limited. The interest of the student and her parent and the class' familiarity with the term seemed reason enough.
The students recorded their data on charts in the classroom for 2 months. Then it was time to analyze the data, write the
first report for the class weather book, and make a report to the school. Again, the work began with a discussion. What were some of the ideas that the students had about the weather after all this measuring and recording? Were any patterns observed? Many students thought the temperature was getting lower; several noted that if it was windy one day, it rained the next day. As ideas were presented, other students agreed or challenged what was said. Mr. H. listened and wrote the ideas on a chart as the students spoke. When the discussion quieted, he turned the students' attention to the list and asked them to think about which of the ideas on the board they might actually be able to confirm by reviewing the data. They listed several and agreed on the following list for a starting place: Is the temperature getting lower? What is the relationship between the direction of the wind and the weather the next day? What happened when the pressure went down or up? Was it colder when it was cloudy?
Mr. H. reminded the students of some ways they might represent the data to help them in the analysis; he then assigned tasks, and the students returned to their groups. Several days later, the work was well under way. One group was working on a bar graph showing the total number of sunny, cloudy, and rainy days; another had made a temperature graph that showed the daily fluctuations and showed the weather definitely was getting colder; an interesting table illustrated that when the pressure dropped the weather usually seemed to get worse. The next challenge was to prepare an interesting report for the school, highlighting all that had been learned.
The weather class continued to operate the weather station all year. The students became quite independent and efficient in collecting data. The data were analyzed approximately every 2 months. Some new questions were considered, and the basic ones continued. Midyear Mr. H. was satisfied that the students understood the use of charts and graphs, and he introduced a simple computer program that the students could use to log their data.
Not only did students learn to ask questions and collect, organize, and present data, they learned how to describe daily weather changes in terms of temperature, windspeed and direction, precipitation, and humidity.
descriptions, and finding patterns. Attempting to extend this understanding into explanations using models will be limited by the inability of young children to understand that earth is approximately spherical. They also have little understanding of gravity and usually have misconceptions about the properties of light that allow us to see objects such as the moon. (Although children will say that they live on a ball, probing questions will reveal that their thinking may be very different.)
Students can discover patterns of weather changes during the year by keeping a journal. Younger students can draw a daily weather picture based on what they see out a window or at recess; older students can make simple charts and graphs from data they collect at a simple school weather station.
Emphasis in grades K-4 should be on developing observation and description skills and the explanations based on observations. Younger children should be encouraged to talk about and draw what they see and think. Older students can keep journals, use instruments, and record their observations and measurements.
Guide to the Content Standard
Fundamental concepts and principles that underlie this standard include
PROPERTIES OF EARTH MATERIALS
-
Earth materials are solid rocks and soils, water, and the gases of the atmosphere. The varied materials have different physical and chemical properties, which make them useful in different ways, for example, as building materials, as sources of fuel, or for growing the plants we use as food. Earth materials provide many of the resources that humans use.
-
Soils have properties of color and texture, capacity to retain water, and ability to support the growth of many kinds of plants, including those in our food supply.
-
Fossils provide evidence about the plants and animals that lived long ago and the nature of the environment at that time.
OBJECTS IN THE SKY
-
The sun, moon, stars, clouds, birds, and airplanes all have properties, locations, and movements that can be observed and described.
-
The sun provides the light and heat necessary to maintain the temperature of the earth.
CHANGES IN THE EARTH AND SKY
-
The surface of the earth changes. Some changes are due to slow processes, such as erosion and weathering, and some changes are due to rapid processes, such as landslides, volcanic eruptions, and earthquakes.
-
Weather changes from day to day and over the seasons. Weather can be described by measurable quantities, such as temperature, wind direction and speed, and precipitation.
-
Objects in the sky have patterns of movement. The sun, for example, appears to move across the sky in the same way every day, but its path changes slowly over the seasons. The moon moves across the sky on a daily basis much like the sun. The observable shape of the moon changes from day to day in a cycle that lasts about a month.
Science and Technology
Content Standard E
As a result of activities in grades K-4, all students should develop
-
Abilities of technological design
-
Understanding about science and technology
-
Abilities to distinguish between natural objects and objects made by humans
Developing Student Abilities and Understanding
The science and technology standards connect students to the designed world, offer them experience in making models of useful things, and introduce them to laws of nature through their understanding of how technological objects and systems work.
This standard emphasizes developing the ability to design a solution to a problem and understanding the relationship of science and technology and the way people are involved in both. This standard helps establish design as the technological parallel to inquiry in science. Like the science as inquiry standard, this standard begins the understanding of the design process, as well as the ability to solve simple design problems.
Children in grades K-4 understand and can carry out design activities earlier than they can inquiry activities, but they cannot easily tell the difference between the two, nor is it important whether they can. In grades K-4, children should have a variety of educational experiences that involve science and technology, sometimes in the same activity and other times separately. When the activities are informal and open, such as building a balance and comparing the weight of objects on it, it is difficult to separate inquiry from technological design. At other times, the distinction might be clear to adults but not to children.
Children's abilities in technological problem solving can be developed by firsthand experience in tackling tasks with a technological purpose. They also can study technological products and systems in their world—zippers, coat hooks, can openers, bridges, and automobiles. Children can engage in projects that are appropriately challenging for their developmental level—ones in which they must design a way to fasten, move, or communicate. They can study existing products to determine function and try to identify problems solved, materials used, and how well a product does what it is supposed to do. An old technological device, such as an apple peeler, can be used as a mystery object for students to investigate and figure out what it does, how it helps people, and what problems it might solve and cause. Such activities provide excellent opportunities to direct attention to specific technology—the tools and instruments used in science.
Suitable tasks for children at this age should have clearly defined purposes and be related with the other content standards. Tasks should be conducted within immediately familiar contexts of the home and school. They should be straightforward; there should be only one or two well-defined ways to solve the problem, and there should be a single, well-defined criterion for success. Any construction of objects should
Weather Instruments
Titles in this example emphasize some important components of the assessment process. Superficially, this assessment task is a simple matching task, but the teacher's professional judgment is still key. For example, is the term "wind gauge" most appropriate or should the more technical term "anemometer" be used? The teacher needs to decide if the use of either term places some students at a disadvantage. Teacher planning includes collecting pictures of weather instruments and ensuring that all students have equal opportunity to study them. A teacher who uses this assessment task recognizes that all assessments have strengths and weaknesses; this task is appropriate for one purpose, and other modes of assessment are appropriate for other purposes. This assessment task presupposes that students have developed some understanding of weather, technology, changing patterns in the environment, and the roles science and technology have in society. The teacher examines the patterns in the responses to evaluate the individual student responses.
[This example highlights some elements of Teaching Standards A, C, and D; Assessment Standards A, B, and D; and K-4 Content Standards D, E, and F.]
SCIENCE CONTENT: The K-4 content standard for earth science is supported by the fundamental concept that weather can be described in measurable quantities.
ASSESSMENT ACTIVITY: Students match pictures of instruments used to measure weather conditions with the condition the instrument measures.
ASSESSMENT TYPE: Individual, short-answer responses to matching item format.
DATA: Students' responses.
ASSESSMENT PURPOSE: When used in conjunction with other data, this assessment activity provides information to be used in assigning a grade.
CONTEXT: This assessment activity is appropriate at the end of a unit on the weather in grades 3 or 4.
ASSESSMENT EXERCISE:
Match pictures of the following weather instruments with the weather condition they measure:
-
Thermometers of various types, including liquid-expansion thermometers, metal-expansion thermometers and digital-electronic thermometers—used to measure temperature.
-
Barometers of various types, including aneroid and mercury types—used to measure air pressure.
-
Weather vanes—used to measure wind direction.
-
Wind gauges of various sorts—instruments to measure windspeed or velocity.
-
Hygrometers of various sorts—to measure moisture in the air.
-
Rain gauges of various sorts—used to measure depth of precipitation.
EVALUATING STUDENT PERFORMANCE:
EXEMPLARY PERFORMANCE: Student matches all instruments with their use.
AVERAGE PERFORMANCE: Student matches familiar forms of measuring instruments with their uses. A student might mistakenly say that the thermometer measures heat or might not understand the concepts of air pressure or humidity. Students at this age cannot be expected to develop sophisticated understanding of the concepts of air pressure, humidity, heat, temperature, speed, or velocity.
require developmentally appropriate manipulative skills used in elementary school and should not require time-consuming preparation and assembly.
Over the course of grades K-4, student investigations and design problems should incorporate more than one material and several contexts in science and technology. A suitable collection of tasks might include making a device to shade eyes from the sun, making yogurt and discussing how it is made, comparing two types of string to see which is best for lifting different objects, exploring how small potted plants can be made to grow as quickly as possible, designing a simple system to hold two objects together, testing the strength of different materials, using simple tools, testing different designs, and constructing a simple structure. It is important also to include design problems that require application of ideas, use of communications, and implementation of procedures—for instance, improving hall traffic at lunch and cleaning the classroom after scientific investigations.
Experiences should be complemented by study of familiar and simple objects through which students can develop observation and analysis skills. By comparing one or two obvious properties, such as cost and strength of two types of adhesive tape, for example, students can develop the abilities to judge a product's worth against its ability to solve a problem. During the K-4 years, an appropriate balance of products could come from the categories of clothing, food, and common domestic and school hardware.
A sequence of five stages—stating the problem, designing an approach, implementing a solution, evaluating the solution, and communicating the problem, design, and solution—provides a framework for planning and for specifying learning outcomes. However, not every activity will involve all of those stages, nor must any particular sequence of stages be followed. For example, some activities might begin by identifying a need and progressing through the stages; other activities might involve only evaluating existing products.
Guide to the Content Standard
Fundamental abilities and concepts that underlie this standard include
ABILITIES OF TECHNOLOGICAL DESIGN
[See Content Standard A (grades K-4)]
IDENTIFY A SIMPLE PROBLEM. In problem identification, children should develop the ability to explain a problem in their own words and identify a specific task and solution related to the problem.
PROPOSE A SOLUTION. Students should make proposals to build something or get something to work better; they should be able to describe and communicate their ideas. Students should recognize that designing a solution might have constraints, such as cost, materials, time, space, or safety.
IMPLEMENTING PROPOSED SOLUTIONS. Children should develop abilities to work individually and collaboratively and to use suitable tools, techniques, and quantitative measurements when appropriate. Students should demonstrate the ability to balance simple constraints in problem solving.
EVALUATE A PRODUCT OR DESIGN. Students should evaluate their own results or solutions to problems, as well as those of
other children, by considering how well a product or design met the challenge to solve a problem. When possible, students should use measurements and include constraints and other criteria in their evaluations. They should modify designs based on the results of evaluations.
COMMUNICATE A PROBLEM, DESIGN, AND SOLUTION. Student abilities should include oral, written, and pictorial communication of the design process and product. The communication might be show and tell, group discussions, short written reports, or pictures, depending on the students' abilities and the design project.
UNDERSTANDING ABOUT SCIENCE AND TECHNOLOGY
-
People have always had questions about their world. Science is one way of answering questions and explaining the natural world.
-
People have always had problems and invented tools and techniques (ways of doing something) to solve problems. Trying to determine the effects of solutions helps people avoid some new problems.
-
Scientists and engineers often work in teams with different individuals doing different things that contribute to the results. This understanding focuses primarily on teams working together and secondarily, on the combination of scientist and engineer teams.
-
Women and men of all ages, backgrounds, and groups engage in a variety of scientific and technological work.
-
Tools help scientists make better observations, measurements, and equipment for investigations. They help scientists see, measure, and do things that they could not otherwise see, measure, and do.
ABILITIES TO DISTINGUISH BETWEEN NATURAL OBJECTS AND OBJECTS MADE BY HUMANS
-
Some objects occur in nature; others have been designed and made by people to solve human problems and enhance the quality of life.
-
Objects can be categorized into two groups, natural and designed.
Science in Personal and Social Perspectives
Content Standard F
As a result of activities in grades K-4, all students should develop understanding of
-
Personal health
-
Characteristics and changes in populations
-
Types of resources
-
Changes in environments
-
Science and technology in local challenges
Developing Student Understanding
Students in elementary school should have a variety of experiences that provide initial understandings for various science-related personal and societal challenges. Central ideas related to health, populations, resources, and environments provide the foundations for students' eventual understandings
and actions as citizens. Although the emphasis in grades K-4 should be on initial understandings, students can engage in some personal actions in local challenges related to science and technology.
Teachers should be aware of the concepts that elementary school students have about health. Most children use the word ''germs" for all microbes; they do not generally use the words "virus" or "bacteria," and when they do, they do not understand the difference between the two. Children generally attribute all illnesses to germs without distinction between contagious and noncontagious diseases and without understanding of organic, functional, or dietary diseases. Teachers can expect students to exhibit little understanding of ideas, such as different origins of disease, resistance to infection, and prevention and cure of disease.
Children link eating with growth, health, strength, and energy, but they do not understand these ideas in detail. They understand connections between diet and health and that some foods are nutritionally better than others, but they do not necessarily know the reasons for these conclusions.
By grades 3 and 4, students regard pollution as something sensed by people and know that it might have bad effects on people and animals. Children at this age usually do not consider harm to plants as part of environmental problems; however, recent media attention might have increased students awareness of the importance of trees in the environment. In most cases, students recognize pollution as an environmental issue, scarcity as a resource issue, and crowded classrooms or schools as population problems. Most young students conceive of these problems as isolated issues that can be solved by dealing with them individually. For example, pollution can be solved by cleaning up the environment and producing less waste, scarcity can be solved by using less, and
|
Central ideas related to health, populations, resources, and environments provide the foundations for students' eventual understandings and actions as citizens. |
crowding can be solved by having fewer students in class or school. However, understanding the interrelationships is not the priority in elementary school.
As students expand their conceptual horizons across grades K-12, they will eventually develop a view that is not centered exclusively on humans and begin to recognize that individual actions accumulate into societal actions. Eventually, students must recognize that society cannot afford to deal only with symptoms: The causes of the problems must be the focus of personal and societal actions.
Guide to the Content Standard
Fundamental concepts and principles that underlie this standard include
[See Content Standard C (grades K-4)]
PERSONAL HEALTH
-
Safety and security are basic needs of humans. Safety involves freedom from danger, risk, or injury. Security involves feelings of confidence and lack of anxiety and fear. Student understandings include following safety rules for home and school, preventing abuse and neglect, avoiding injury, knowing whom to ask for help, and when and how to say no.
-
Individuals have some responsibility for their own health. Students should engage in personal care—dental hygiene, cleanliness, and exercise—that will maintain and improve health. Understandings include how communicable diseases, such as colds, are transmitted and some of the body's defense mechanisms that prevent or overcome illness.
-
Nutrition is essential to health. Students should understand how the body uses food and how various foods contribute to health. Recommendations for good nutrition include eating a variety of foods, eating less sugar, and eating less fat.
-
Different substances can damage the body and how it functions. Such substances include tobacco, alcohol, over-the-counter medicines, and illicit drugs. Students should understand that some substances, such as prescription drugs, can be beneficial, but that any substance can be harmful if used inappropriately.
CHARACTERISTICS AND CHANGES IN POPULATIONS
-
Human populations include groups of individuals living in a particular location. One important characteristic of a human population is the population density—the number of individuals of a particular population that lives in a given amount of space.
-
The size of a human population can increase or decrease. Populations will increase unless other factors such as disease or famine decrease the population.
TYPES OF RESOURCES
[See Content Standard D (grades K-4)]
-
Resources are things that we get from the living and nonliving environment to meet the needs and wants of a population.
-
Some resources are basic materials, such as air, water, and soil; some are produced from basic resources, such as food, fuel, and building materials; and some resources are nonmaterial, such as quiet places, beauty, security, and safety.
-
The supply of many resources is limited. If used, resources can be extended through recycling and decreased use.
CHANGES IN ENVIRONMENTS
[See Content Standard C (grades K-4)]
-
Environments are the space, conditions, and factors that affect an individual's and a population's ability to survive and their quality of life.
-
Changes in environments can be natural or influenced by humans. Some changes are good, some are bad, and some are neither good nor bad. Pollution is a change in the environment that can influence the health, survival, or activities of organisms, including humans.
-
Some environmental changes occur slowly, and others occur rapidly. Students should understand the different consequences of changing environments in small increments over long periods as compared with changing environments in large increments over short periods.
SCIENCE AND TECHNOLOGY IN LOCAL CHALLENGES
[See Content Standard E (grades K-4)]
-
People continue inventing new ways of doing things, solving problems, and getting work done. New ideas and inventions often affect other people; sometimes the effects are good and sometimes they are bad. It is helpful to try to determine in advance how ideas and inventions will affect other people.
-
Science and technology have greatly improved food quality and quantity, transportation, health, sanitation, and communication. These benefits of science and technology are not available to all of the people in the world.
History and Nature of Science
Content Standard G
As a result of activities in grades K-4, all students should develop understanding of
-
Science as a human endeavor
Developing Student Understanding
Beginning in grades K-4, teachers should build on students' natural inclinations to ask questions and investigate their world. Groups of students can conduct investigations that begin with a question and progress toward communicating an answer to the question. For students in the early grades, teachers should emphasize the experiences of investigating and thinking about explanations and not overemphasize memorization of scientific terms and information. Students can learn some things about scientific inquiry and significant people from history, which will provide a foundation for the development of sophisticated ideas related to the history and nature of science that will be developed in later years. Through the use of short stories, films, videos, and other examples, elementary teachers can introduce interesting historical examples of women and men (including minorities and people with disabilities) who have made contributions to science. The stories can highlight how these scientists worked—that is, the questions, procedures, and contributions of diverse individuals to science and technology. In upper elementary grades, students can read and share stories that express the theme of this standard—science is a human endeavor.
Guide to the Content Standard
Fundamental concepts and principles that underlie this standard include
SCIENCE AS A HUMAN ENDEAVOR
-
Science and technology have been practiced by people for a long time.
-
Men and women have made a variety of contributions throughout the history of science and technology.
-
Although men and women using scientific inquiry have learned much about the objects, events, and phenomena in nature, much more remains to be understood. Science will never be finished.
-
Many people choose science as a career and devote their entire lives to studying it. Many people derive great pleasure from doing science.
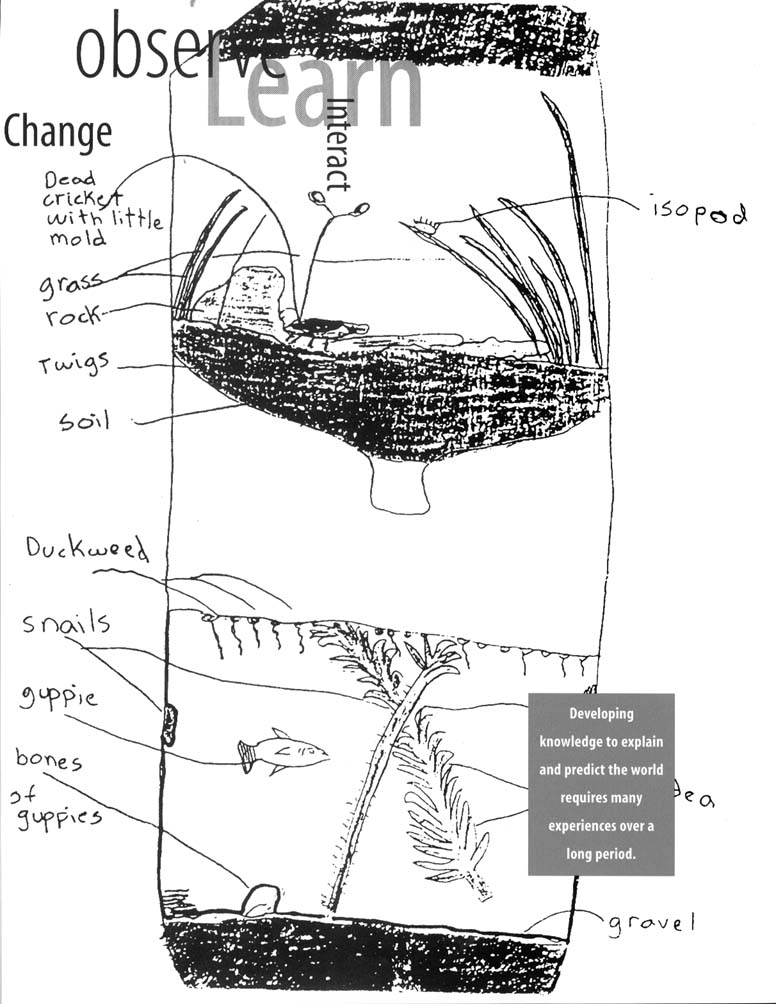
Content Standards: 5-8
Science as Inquiry
Content Standard A
As a result of activities in grades 5-8, all students should develop
-
Abilities necessary to do scientific inquiry
-
Understandings about scientific inquiry
Developing Student Abilities and Understanding
Students in grades 5-8 should be provided opportunities to engage in full and in partial inquiries. In a full inquiry students begin with a question, design an investigation, gather evidence, formulate an answer to the original question, and communicate the investigative process and results. In partial inquiries, they develop abilities and understanding of selected aspects of the inquiry process. Students might, for instance, describe how they would design an investigation, develop explanations based on scientific information and evidence provided through a classroom activity, or recognize and analyze several alternative explanations for a natural phenomenon presented in a teacher-led demonstration.
Students in grades 5-8 can begin to recognize the relationship between explanation and evidence. They can understand that background knowledge and theories guide the design of investigations, the types of observations made, and the interpretations of data. In turn, the experiments and investigations students conduct become experiences that shape and modify their background knowledge.
With an appropriate curriculum and adequate instruction, middle-school students can develop the skills of investigation and the understanding that scientific inquiry is guided by knowledge, observations, ideas, and questions. Middle-school students might have trouble identifying variables and controlling more than one variable in an experiment. Students also might have difficulties understanding the influence of different variables in an experiment—for
example, variables that have no effect, marginal effect, or opposite effects on an outcome.
Teachers of science for middle-school students should note that students tend to center on evidence that confirms their current beliefs and concepts (i.e., personal explanations), and ignore or fail to perceive evidence that does not agree with their current concepts. It is important for teachers of science to challenge current beliefs and concepts and provide scientific explanations as alternatives.
Several factors of this standard should be highlighted. The instructional activities of a scientific inquiry should engage students in identifying and shaping an understanding of the question under inquiry. Students should know what the question is asking, what
|
Students in grades 5-8 can begin to recognize the relationship between explanation and evidence. |
background knowledge is being used to frame the question, and what they will have to do to answer the question. The students' questions should be relevant and meaningful for them. To help focus investigations, students should frame questions, such as "What do we want to find out about …?", "How can we make the most accurate observations?", "Is this the best way to answer our questions?" and "If we do this, then what do we expect will happen?"
The instructional activities of a scientific inquiry should involve students in establishing and refining the methods, materials, and data they will collect. As students conduct investigations and make observations, they should consider questions such as "What data will answer the question?" and "What are the best observations or measurements to make?" Students should be encouraged to repeat data-collection procedures and to share data among groups.
In middle schools, students produce oral or written reports that present the results of their inquiries. Such reports and discussions should be a frequent occurrence in science programs. Students' discussions should center on questions, such as "How should we organize the data to present the clearest answer to our question?" or "How should we organize the evidence to present the strongest explanation?" Out of the discussions about the range of ideas, the background knowledge claims, and the data, the opportunity arises for learners to shape their experiences about the practice of science and the rules of scientific thinking and knowing.
The language and practices evident in the classroom are an important element of doing inquiries. Students need opportunities to present their abilities and understanding and to use the knowledge and language of science to communicate scientific explanations and ideas. Writing, labeling drawings, completing concept maps, developing spreadsheets, and designing computer graphics should be a part of the science education. These should be presented in a way that allows students to receive constructive feedback on the quality of thought and expression and the accuracy of scientific explanations.
This standard should not be interpreted as advocating a "scientific method." The conceptual and procedural abilities suggest a logical progression, but they do not imply a rigid approach to scientific inquiry. On the
contrary, they imply codevelopment of the skills of students in acquiring science knowledge, in using high-level reasoning, in applying their existing understanding of scientific ideas, and in communicating scientific information. This standard cannot be met by having the students memorize the abilities and understandings. It can be met only when students frequently engage in active inquiries.
Guide to the Content Standard
Fundamental abilities and concepts that underlie this standard include
ABILITIES NECESSARY TO DO SCIENTIFIC INQUIRY
IDENTIFY QUESTIONS THAT CAN BE ANSWERED THROUGH SCIENTIFIC INVESTIGATIONS. Students should develop the ability to refine and refocus broad and ill-defined questions. An important aspect of this ability consists of students' ability to clarify questions and inquiries and direct them toward objects and phenomena that can be described, explained, or predicted by scientific investigations. Students should develop the ability to identify their questions with scientific ideas, concepts, and quantitative relationships that guide investigation.
DESIGN AND CONDUCT A SCIENTIFIC INVESTIGATION. Students should develop general abilities, such as systematic observation, making accurate measurements, and identifying and controlling variables. They should also develop the ability to clarify their ideas that are influencing and guiding the inquiry, and to understand how those ideas compare with current scientific knowledge. Students can learn to formulate questions, design investigations, execute investigations, interpret data, use evidence to generate explanations, propose alternative explanations, and critique explanations and procedures.
USE APPROPRIATE TOOLS AND TECHNIQUES TO GATHER, ANALYZE, AND INTERPRET DATA. The use of tools and techniques, including mathematics, will be guided by the question asked and the investigations students design. The use of computers for the collection, summary, and display of evidence is part of this standard. Students should be able to access, gather, store, retrieve, and organize data, using hardware and software designed for these purposes.
DEVELOP DESCRIPTIONS, EXPLANATIONS, PREDICTIONS, AND MODELS USING EVIDENCE. Students should base their explanation on what they observed, and as they develop cognitive skills, they should be able to differentiate explanation from description—providing causes for effects and establishing relationships based on evidence and logical argument. This standard requires a subject matter knowledge base so the students can effectively conduct investigations, because developing explanations establishes connections between the content of science and the contexts within which students develop new knowledge.
THINK CRITICALLY AND LOGICALLY TO MAKE THE RELATIONSHIPS BETWEEN EVIDENCE AND EXPLANATIONS. Thinking critically about evidence includes deciding what evidence should be used and accounting for anomalous data. Specifically, students should be able to review data from a simple experiment, summarize the data, and form a logical argument about the cause-and-effect relationships in the experiment.
Pendulums
Ms. D. wants to focus on inquiry. She wants students to develop an understanding of variables in inquiry and how and why to change one variable at a time. This inquiry process skill is imparted in the context of physical science subject matter. The activity is purposeful, planned, and requires teacher guidance. Ms. D. does not tell students that the number of swings depends on the length of the pendulum, but creates an activity that awakens students' interest and encourages them to ask questions and seek answers. Ms. D. encourages students to look for applications of the science knowledge beyond the classroom. Students keep records of the science activities, and Ms. D. helps them understand that there are different ways to keep records of events. The activity requires mathematical knowledge and skills‥ The assessment, constructing a pendulum that swings at six swings per second, is embedded in the activity.
[This example highlights some elements of Teaching Standards B, C, and D; Assessment Standard B; 5-8 Content Standards A and B; and Program Standard C.]
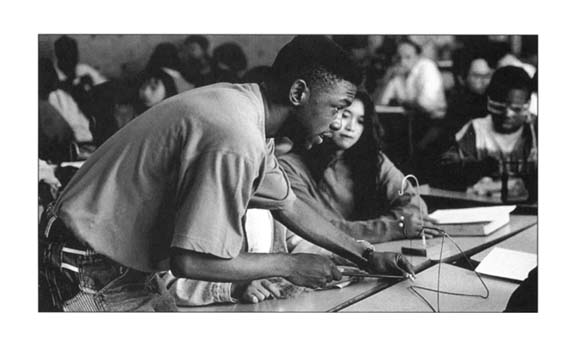
The students in Ms. D.'s fifth grade class are studying motion, direction, and speed. One experiment in this study is designed to enable the students to understand how and why to change one variable at a time. Ms. D. has the students form groups of four; each student has an assigned role. One student—the materials manager—goes to the supply table to pick up a length of string, scissors, tape, and washers of various sizes and weights. Each group is directed to use these materials to 1) construct a pendulum, 2) hang the pendulum so that it swings freely from a pencil taped to the surface of the desk, and 3) count the number of swings of the pendulum in 15 seconds.
The notetaker in each group records the result in a class chart. Ms. D. asks the students to examine the class data. Because the number of swings recorded by each group is different, a lively discussion begins about why this happened. The students decide to repeat the experiment to make sure that they have measured the time and counted the swings correctly. When the second set of
data are entered on the class data table, the results make it clear that the differences are not because students did not count swings or measure time correctly. Again the class discusses why the results are different. Some of the suggestions include the length of the string, the weight of the washer, the diameter of the washer, and how high the student starting the pendulum held the washer to begin the swing.
As each suggestion is made, Ms. D. writes it on the board. The class is then asked to design experiments that could determine which suggestion is correct. Each group chooses to do an experiment to test one of the suggestions, but before the group work continues, Ms. D. collects the pendulums that were used to generate the first and second sets of data. As the groups resume work, one group keeps the string the same length but attaches washers of different diameters and tries to start the swing at exactly the same place. Another group uses one piece of string and one washer, but starts the swing at higher and higher places on an arc. A third group cuts pieces of string of different lengths, but uses one washer and starts the swing at the same place each time. Discussion is animated as students set up their pendulums and the class quiets as they count the swings. Finally, each group shares with the rest of the class what they did and the data they collected. The class concludes that the difference in the number of swings that the pendulum makes is due to the different lengths of string.
The next day, students notice that Ms. D. has constructed a board for the pendulums at the front of the room. Across the top are pegs from which to hang pendulums, and across the bottom are consecutive numbers. The notetaker from each group is directed to hang the group's original pendulum on the peg corresponding to its number of swings in a fixed time. When all of the pendulums are hung on the peg board, the class is asked to interpret the results. After considerable discussion, the students conclude that the number of swings in a fixed time increases in a regular manner as the length of the string gets shorter.
Ms. D. notes that pendulums were constructed with five and seven swings per 15 seconds on the peg board, but no pendulum with six; she asks each group to construct a pendulum with six swings per 15 seconds. After much measuring and counting and measuring again, and serious discussion on what counts as a "swing," every group declares success. Ms. D. then asks how they can keep the information on the relationship between the length of the string and the number of swings in a form that is more convenient than the peg board and directs the students to make a drawing in their science journals to keep that data. Most students draw the pegboard with the pendulums of different lengths, but some students draw charts and a few make graphs. Ms. D. challenges students to find examples of pendulums at home and in their neighborhoods.
The next science class is spent discussing graphing as students move from their pictures of the string lengths, to lines, to points on a graph, and to a complete graph. Finally, each student is asked to use his or her graph to make a pendulum that will swing an exact number of times.
Students have described, explained, and predicted a natural phenomenon and learned about position and motion and about gathering, analyzing, and presenting data.
Students should begin to state some explanations in terms of the relationship between two or more variables.
RECOGNIZE AND ANALYZE ALTERNATIVE EXPLANATIONS AND PREDICTIONS. Students should develop the ability to listen to and respect the explanations proposed by other students. They should remain open to and acknowledge different ideas and explanations, be able to accept the skepticism of others, and consider alternative explanations.
[See Teaching Standard B]
COMMUNICATE SCIENTIFIC PROCEDURES AND EXPLANATIONS. With practice, students should become competent at communicating experimental methods, following instructions, describing observations, summarizing the results of other groups, and telling other students about investigations and explanations.
[See Program Standard C]
USE MATHEMATICS IN ALL ASPECTS OF SCIENTIFIC INQUIRY. Mathematics is essential to asking and answering questions about the natural world. Mathematics can be used to ask questions; to gather, organize, and present data; and to structure convincing explanations.
UNDERSTANDINGS ABOUT SCIENTIFIC INQUIRY
-
Different kinds of questions suggest different kinds of scientific investigations. Some investigations involve observing and describing objects, organisms, or events; some involve collecting specimens; some involve experiments; some involve seeking more information; some involve discovery of new objects and phenomena; and some involve making models.
-
Current scientific knowledge and understanding guide scientific investigations. Different scientific domains employ different methods, core theories, and standards to advance scientific knowledge and understanding.
-
Mathematics is important in all aspects of scientific inquiry.
-
Technology used to gather data enhances accuracy and allows scientists to analyze and quantify results of investigations.
-
Scientific explanations emphasize evidence, have logically consistent arguments, and use scientific principles, models, and theories. The scientific community accepts and uses such explanations until displaced by better scientific ones. When such displacement occurs, science advances.
-
Science advances through legitimate skepticism. Asking questions and querying other scientists' explanations is part of scientific inquiry. Scientists evaluate the explanations proposed by other scientists by examining evidence, comparing evidence, identifying faulty reasoning, pointing out statements that go beyond the evidence, and suggesting alternative explanations for the same observations.
-
Scientific investigations sometimes result in new ideas and phenomena for study, generate new methods or procedures for an investigation, or develop new technologies to improve the collection of data. All of these results can lead to new investigations.
Physical Science
Content Standard B
As a result of their activities in grades 5–8, all students should develop an understanding of
-
Properties and changes of properties in matter
-
Motions and forces
-
Transfer of energy
Developing Student Understanding
In grades 5–8, the focus on student understanding shifts from properties of objects and materials to the characteristic properties of the substances from which the materials are made. In the K-4 years, students learned that objects and materials can be sorted and ordered in terms of their properties. During that process, they learned that some properties, such as size, weight, and shape, can be assigned only to the object while other properties, such as color, texture, and hardness, describe the materials from which objects are made. In grades 5-8, students observe and measure characteristic properties, such as boiling points, melting points, solubility, and simple chemical changes of pure substances and use those properties to distinguish and separate one substance from another.
Students usually bring some vocabulary and primitive notions of atomicity to the science class but often lack understanding of the evidence and the logical arguments that support the particulate model of matter. Their early ideas are that the particles have the same properties as the parent material; that is, they are a tiny piece of the substance. It can be tempting to introduce atoms and molecules or improve students' understanding of them so that particles can be used as an explanation for the properties of elements and compounds. However, use of such terminology is premature for these stu
|
In grades 5-8, students observe and measure characteristic properties, such as boiling points, melting points, solubility, and simple chemical changes of pure substances and use those properties to distinguish and separate one substance from another. |
dents and can distract from the understanding that can be gained from focusing on the observation and description of macroscopic features of substances and of physical and chemical reactions. At this level, elements and compounds can be defined operationally from their chemical characteristics, but few students can comprehend the idea of atomic and molecular particles.
The study of motions and the forces causing motion provide concrete experiences on which a more comprehensive understanding of force can be based in grades 9-12. By using simple objects, such as rolling balls and mechanical toys, students can move from qualitative to quantitative descriptions of moving objects and begin to describe the forces acting on the objects. Students' everyday experience is that friction causes all moving objects to slow down and stop. Through experiences in which friction is
Funny Water
In this example, Mr. B makes his plans using his knowledge and understanding of science, students, teaching, and the district science program. His understanding and ability are the results of years of studying and reflection on his own teaching. He usually introduces new topics with a demonstration to catch the students' attention. He asks questions that encourage students to develop understanding and designs activities that require students to confirm their ideas and extend them to situations within and beyond the science classroom. Mr. B encourages students to observe, test, discuss, and write by promoting individual effort as well as by forming different-sized groups of students for various activities. Immense understanding, skill, creativity, and energy are required to organize and orchestrate ideas, students, materials, and events the way Mr. B. does with apparent ease. And Mr. B. might repeat an activity five times a day, adapting it to the needs of different classes of students, or he might teach four other school subjects.
[This example highlights some components of Teaching Standards A, B, D, and E; Professional Development Standard C; 5-8 Content Standard A and B; Program Standards A, B, and D; and System Standards D.]
Mr. B. was beginning a unit that would include the development of students' understanding of the characteristic properties of substances such as boiling points, melting points, solubility, and density. He wanted students to consolidate their experiences and think about the properties of substances as a foundation for the atomic theories they would gradually come to understand in high school. He knew that the students had some vocabulary and some notions of atomicity but were likely not to have any understanding of the evidence of the particulate nature of matter or arguments that support that understanding. Mr. B. started the unit with a study of density because the concept is important and because this study allowed him to gather data on the students' current understandings about matter.
As he had done the year before, he began the study with the density of liquids. He knew that the students who had been in the district elementary schools had already done some work with liquids and that all students brought experience and knowledge from their daily lives. To clarify the knowledge, understanding, and confusion students might have, Mr. B. prepared a set of short exercises for the opening week of the unit of study.
For the first day, he prepared two density columns: using two 1-foot-high, clear plastic cylinders, he poured in layers of corn syrup, liquid detergent, colored water, vegetable oil, baby oil, and methanol. As the students arrived, they were directed into two groups to examine the columns and discuss what they saw. After 10 minutes of conversation, Mr. B. asked the students to take out their notebooks and jot down observations and thoughts about why the different liquids separated.
When the writing ceased, Mr. B. asked, ''What did you observe? Do you have any explanations for what you see? What do you think is happening?" He took care to explain, "There are no right answers, and silence is OK. You need to think." Silence was followed by a few comments, and finally, a lively discussion ensued.
It's pretty
How do you get the colors to stay apart?
Like the ones on top are lighter or something like that.
The top looks like water.
I think the bottom liquids are heavier; they sink to the bottom.
It separated into different layers because each has different densities and they sit on top of each other.
"What do you mean by density?" asked Mr. B.
It's how packed the particles are.
This one is thick so it's on the bottom. This one is thinnest.
Doesn't oil have lighter density than water?
If we put a thicker liquid in, it would go to the bottom.
There's more of this one that's on the bottom.
The atoms in some are heavier than the ones in others.
Mr. B. realized how many different ways the students explained what they saw, for example, thickness and thinness, heaviness and lightness, more and less, different densities and atoms. The discussion gave him a sense for what the students were thinking. It was clear to him that the investigations he had planned for the following weeks to focus more closely on density would be worthwhile.
Mr. B. divided the class into seven groups of four the next day. On each of the group's tables were small cylinders. Mr. B warned the students not to drink the liquid. Each group was to choose one person to be the materials manager and one to be the recorder as they proceeded to find out what they could about the same liquids used the day before (all of which were available on the supply table). Only the materials manager was to come to the supply table for the liquids, and the recorders kept track of what they did. Forty minutes later, Mr. B. asked students to clean up and gather to share their observations.
Every group identified some of the liquids. The water was easy, as was the vegetable oil. Some students knew corn syrup, others recognized the detergent. Several groups combined two and three liquids and found that some of them mixed together, and others stayed separate. Some disagreements arose about which liquid floated on which. Mr. B. suggested that interested students come back during their lunch time to try to resolve these disagreements. One group replicated the large cylinder, shook it vigorously, and was waiting to see whether the liquids would separate. Mr. B. asked that group to draw what the cylinder contents looked like now, put it on the windowsill, and check it the next day.
Mr. B. began the third day with a large density column again. This time he gave a small object to each of four students—a piece of wood, aluminum, plastic, or iron. He asked the class to predict what would happen when each of the four objects was released into the column. The students predicted and watched as some objects sank to the bottom, and others stopped somewhere in the columns.
"What do you think is going on?" asked Mr. B. "How can you explain the way these objects behaved? I don't want answers now," he went on, "I want you to try out some more things yourselves and then we'll talk.'' He then divided the class into four groups and gave each a large density column with the liquid layers. The students worked in their groups for 30 minutes. The discussion was animated as different objects were tried: rubber bands, a penny, a nickel, a pencil,
When we dropped something lighter in, it stopped near the top.
The rubber band is lighter than the paper clip. The paper clip is heavy so it drops down.
The rubber band has buoyancy, if you know what that means.
The nickel went all the way to the bottom because it's heavier, but the pencil wouldn't go into the last layer because it was too thick. The pencil is wood and it's lighter; the nickel is silver and it's heavier.
The nickel is denser than the pencil.
Mr. B. listened to these observations and encouraged the students to respond to one another. Occasionally he asked for a clarification—"What do you mean by that?" "How did you do that?" His primary purpose was to hear the students' ideas and encourage them to explain them to one another.
The next day he began the last of the introductory experiences. When the students came in, Mr. B. asked them to divide into their four groups and go to the tables with the density columns. Beside each column were several pieces of wood of different sizes. Students were to think and talk about what the pieces might do in the column, try them out, have more discussion, and write down some of their ideas in their science notebooks.
When enough time had passed, Mr. B. called the groups together and asked for some volunteers to read from their notebooks. Some students were struggling with what they had seen:
They stuck in the middle of the column.
The pieces are not the same weight. The bigger ones are heavier. I don't know why they all stopped in the middle.
Others seemed to understand. One student read,
If you have a block of wood and cut it into millions of pieces, each piece would have the density of the original block. If that block of wood weighed one gram and you cut it into a million pieces the weight would change. But no matter how many times you cut something, the density will not change.
When this statement was read Mr. B. asked how many people agreed with it. Most students quickly asserted "yes." But how sure were they? Mr. B. pulled out a piece of wood larger than any of those that the students had tried. "What would happen if this piece of wood were dropped into the column?" Some students said immediately that it would stop where the smaller pieces had. Others were not quite so sure. This piece was quite a bit bigger. One student asked for a show of hands. Twelve students thought this big piece of wood would sink farther and 16 thought it would sink to the same level as the others. Mr. B. dropped it in. It stopped sinking where the others had. There were a few "yeahs," a few "what's," and some puzzled looks.
As a final teaser and check on students' understanding, Mr. B. brought out two transparent containers of colorless liquids. He asked the class to gather around, took a candle and cut two quite different-sized pieces from it. The students were asked to predict what would happen when the candle pieces were put in the liquids. Mr. B. dropped the pieces into the columns: In one container the big piece sank to the bottom; in the other, the small one floated on the top. Some students had predicted this result, saying that the bigger one was heavier and therefore would sink. Others were perplexed. The two pieces were made of the same wax so they shouldn't be different. Something was wrong. Were the two liquids really the same? Mr. B. removed the pieces of wax from the containers and reversed them. This time the little one sank and the big one floated. "Unfair," came a chorus of voices. "The liquids aren't the same."
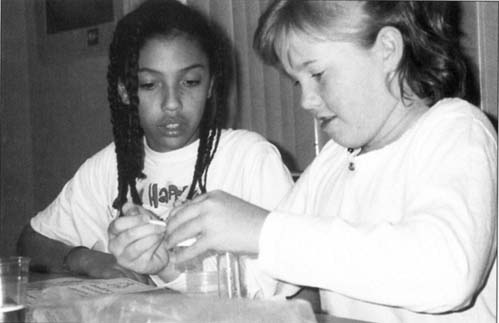
Mr. B. had used water and isopropyl alcohol. But he noticed several students were willing to explain the sinking of the larger piece of candle and not the smaller by the difference in the size of the piece.
Mr. B. closed the lesson by summing up. They had seen the density column and worked with the liquids themselves; they had tried floating objects in liquids; they had seen the pieces of wax in the liquids. What was the explanation for all these phenomena? For homework that night he asked them to do two things. They were to think about and write down any ideas they had about what was happening in all these experiences. He also asked them to think about and write about examples of these phenomena in their daily lives. After the students shared some of their observations from outside the classroom, Mr. B. would have the students observe as he boiled water to initiate discussion of boiling points.
reduced, students can begin to see that a moving object with no friction would continue to move indefinitely, but most students believe that the force is still acting if the object is moving or that it is "used up" if the motion stops. Students also think that friction, not inertia, is the principle reason objects remain at rest or require a force to move. Students in grades 5-8 associate force with motion and have difficulty understanding balanced forces in equilibrium, especially if the force is associated with static, inanimate objects, such as a book resting on the desk.
The understanding of energy in grades 5-8 will build on the K-4 experiences with light, heat, sound, electricity, magnetism, and the motion of objects. In 5-8, students begin to see the connections among those phenomena and to become familiar with the idea that energy is an important property of substances and that most change involves energy transfer. Students might have some of the same views of energy as they do of force—that it is associated with animate objects and is linked to motion. In addition, students view energy as a fuel or something that is stored, ready to use, and gets used up. The intent at this level is for students to improve their understanding of energy by experiencing many kinds of energy transfer.
Guide to the Content Standard
Fundamental concepts and principles that underlie this standard include
PROPERTIES AND CHANGES OF PROPERTIES IN MATTER
-
A substance has characteristic properties, such as density, a boiling point, and solubility, all of which are independent of the amount of the sample. A mixture of substances often can be separated into the original substances using one or more of the characteristic properties.
-
Substances react chemically in characteristic ways with other substances to form new substances (compounds) with different characteristic properties. In chemical reactions, the total mass is conserved. Substances often are placed in categories or groups if they react in similar ways; metals is an example of such a group.
-
Chemical elements do not break down during normal laboratory reactions involving such treatments as heating, exposure to electric current, or reaction with acids. There are more than 100 known elements that combine in a multitude of ways to produce compounds, which account for the living and nonliving substances that we encounter.
MOTIONS AND FORCES
[See Content Standard D (grades 5-8)]
-
The motion of an object can be described by its position, direction of motion, and speed. That motion can be measured and represented on a graph.
-
An object that is not being subjected to a force will continue to move at a constant speed and in a straight line.
-
If more than one force acts on an object along a straight line, then the forces will reinforce or cancel one another, depending on their direction and magnitude. Unbalanced forces will cause changes in the speed or direction of an object's motion.
[See Unifying Concepts and Processes]
TRANSFER OF ENERGY
-
Energy is a property of many substances and is associated with heat, light, electricity, mechanical motion, sound, nuclei, and the nature of a chemical. Energy is transferred in many ways.
-
Heat moves in predictable ways, flowing from warmer objects to cooler ones, until both reach the same temperature.
-
Light interacts with matter by transmission (including refraction), absorption, or scattering (including reflection). To see an object, light from that object—emitted by or scattered from it—must enter the eye.
-
Electrical circuits provide a means of transferring electrical energy when heat, light, sound, and chemical changes are produced.
-
In most chemical and nuclear reactions, energy is transferred into or out of a system. Heat, light, mechanical motion, or electricity might all be involved in such transfers.
-
The sun is a major source of energy for changes on the earth's surface. The sun loses energy by emitting light. A tiny fraction of that light reaches the earth, transferring energy from the sun to the earth. The sun's energy arrives as light with a range of wavelengths, consisting of visible light, infrared, and ultraviolet radiation.
Life Science
Content Standard C
As a result of their activities in grades 5-8, all students should develop understanding of
-
Structure and function in living systems
-
Reproduction and heredity
-
Regulation and behavior
-
Populations and ecosystems
-
Diversity and adaptations of organisms
Developing Student Understanding
In the middle-school years, students should progress from studying life science from the point of view of individual organisms to recognizing patterns in ecosystems and developing understandings about the cellular dimensions of living systems. For example, students should broaden their understanding from the way one species lives in its environment to populations and communities of species and the ways they interact with each other and with their environment. Students also should expand their investigations of living systems to include the study of cells. Observations and investigations should become increasingly quantitative, incorporating the use of computers and conceptual and mathematical models. Students in grades 5-8 also have the fine-motor skills to work with a light microscope and can interpret accurately what they see, enhancing their introduction to cells and microorganisms and establishing a foundation for developing understanding of molecular biology at the high school level.
Some aspects of middle-school student understanding should be noted. This period of development in youth lends itself to human biology. Middle-school students can develop the understanding that the body has organs that function together to maintain life. Teachers should introduce the general idea of structure-function in the context of human organ systems working together. Other, more specific and concrete examples, such as the hand, can be used to develop a specific understanding of structure-function in living systems. By middle-school, most students know about the basic process of sexual reproduction in humans. However, the student might have misconceptions about the role of sperm and eggs and about the sexual reproduction of flowering plants. Concerning heredity, younger middle-school students tend to focus on observable traits, and older students have some understanding that genetic material carries information.
Students understand ecosystems and the interactions between organisms and environments well enough by this stage to introduce ideas about nutrition and energy flow, although some students might be confused by charts and flow diagrams. If asked about common ecological concepts, such as community and competition between organisms, teachers are likely to hear responses based on everyday experiences rather than scientific explanations. Teachers should use the students' understanding as a basis to develop the scientific understanding.
Understanding adaptation can be particularly troublesome at this level. Many students think adaptation means that individuals change in major ways in response to environmental changes (that is, if the environment changes, individual organisms deliberately adapt).
Guide to the Content Standard
Fundamental concepts and principles that underlie this standard include
STRUCTURE AND FUNCTION IN LIVING SYSTEMS
-
Living systems at all levels of organization demonstrate the complementary nature of structure and function. Important levels of organization for structure and function include cells, organs, tissues, organ systems, whole organisms, and ecosystems.
-
All organisms are composed of cells—the fundamental unit of life. Most organisms are single cells; other organisms, including humans, are multicellular.
-
Cells carry on the many functions needed to sustain life. They grow and divide, thereby producing more cells. This requires that they take in nutrients, which they use to provide energy for the work that cells do and to make the materials that a cell or an organism needs.
-
Specialized cells perform specialized functions in multicellular organisms. Groups of specialized cells cooperate to form a tissue, such as a muscle. Different tissues are in turn grouped together to form larger functional units, called organs. Each type of cell, tissue, and organ has a distinct structure and set of functions that serve the organism as a whole.
-
The human organism has systems for digestion, respiration, reproduction, circulation, excretion, movement, control, and coordination, and for protection
-
Disease is a breakdown in structures or functions of an organism. Some diseases are the result of intrinsic failures of the system. Others are the result of damage by infection by other organisms.
from disease. These systems interact with one another.
REPRODUCTION AND HEREDITY
-
Reproduction is a characteristic of all living systems; because no individual organism lives forever, reproduction is essential to the continuation of every species. Some organisms reproduce asexually. Other organisms reproduce sexually.
-
In many species, including humans, females produce eggs and males produce sperm. Plants also reproduce sexually—the egg and sperm are produced in the flowers of flowering plants. An egg and sperm unite to begin development of a new individual. That new individual receives genetic information from its mother (via the egg) and its father (via the sperm). Sexually produced offspring never are identical to either of their parents.
-
Every organism requires a set of instructions for specifying its traits. Heredity is the passage of these instructions from one generation to another.
-
Hereditary information is contained in genes, located in the chromosomes of each cell. Each gene carries a single unit of information. An inherited trait of an individual can be determined by one or by many genes, and a single gene can influence more than one trait. A human cell contains many thousands of different genes.
-
The characteristics of an organism can be described in terms of a combination of traits. Some traits are inherited and others result from interactions with the environment.
REGULATION AND BEHAVIOR
-
All organisms must be able to obtain and use resources, grow, reproduce, and maintain stable internal conditions while living in a constantly changing external environment.
-
Regulation of an organism's internal environment involves sensing the internal environment and changing physiological activities to keep conditions within the range required to survive.
-
Behavior is one kind of response an organism can make to an internal or environmental stimulus. A behavioral response requires coordination and communication at many levels, including cells, organ systems, and whole organisms. Behavioral response is a set of actions determined in part by heredity and in part from experience.
-
An organism's behavior evolves through adaptation to its environment. How a species moves, obtains food, reproduces, and responds to danger are based in the species' evolutionary history.
POPULATIONS AND ECOSYSTEMS
-
A population consists of all individuals of a species that occur together at a given place and time. All populations living together and the physical factors with which they interact compose an ecosystem.
-
Populations of organisms can be categorized by the function they serve in an ecosystem. Plants and some microorganisms are producers—they make
-
For ecosystems, the major source of energy is sunlight. Energy entering ecosystems as sunlight is transferred by producers into chemical energy through photosynthesis. That energy then passes from organism to organism in food webs.
-
The number of organisms an ecosystem can support depends on the resources available and abiotic factors, such as quantity of light and water, range of temperatures, and soil composition. Given adequate biotic and abiotic resources and no disease or predators, populations (including humans) increase at rapid rates. Lack of resources and other factors, such as predation and climate, limit the growth of populations in specific niches in the ecosystem.
their own food. All animals, including humans, are consumers, which obtain food by eating other organisms. Decomposers, primarily bacteria and fungi, are consumers that use waste materials and dead organisms for food. Food webs identify the relationships among producers, consumers, and decomposers in an ecosystem.
DIVERSITY AND ADAPTATIONS OF ORGANISMS
-
Millions of species of animals, plants, and microorganisms are alive today. Although different species might look dissimilar, the unity among organisms becomes apparent from an analysis of internal structures, the similarity of their chemical processes, and the evidence of common ancestry.
-
Biological evolution accounts for the diversity of species developed through gradual processes over many generations. Species acquire many of their unique characteristics through biological adaptation, which involves the selection of naturally occurring variations in populations. Biological adaptations include changes in structures, behaviors, or physiology that enhance survival and reproductive success in a particular environment.
-
Extinction of a species occurs when the environment changes and the adaptive characteristics of a species are insufficient to allow its survival. Fossils indicate that many organisms that lived long ago are extinct. Extinction of species is common; most of the species that have lived on the earth no longer exist.
Earth and Space Science
Content Standard D
As a result of their activities in grades 5-8, all students should develop an understanding of
-
Structure of the earth system
-
Earth's history
-
Earth in the solar system
Developing Student Understanding
A major goal of science in the middle grades is for students to develop an understanding of earth and the solar system as a set of closely coupled systems. The idea of systems provides a framework in which students can investigate the four major interacting components of the earth system—geosphere
(crust, mantle, and core), hydrosphere (water), atmosphere (air), and the biosphere (the realm of all living things). In this holistic approach to studying the planet, physical, chemical, and biological processes act within and among the four components on a wide range of time scales to change continuously earth's crust, oceans, atmosphere, and living organisms. Students can investigate the water and rock cycles as introductory examples of geophysical and geochemical cycles. Their study of earth's history provides some evidence about co-evolution of the planet's main features—the distribution of land and sea, features of the crust, the composition of the atmosphere, global climate, and populations of living organisms in the biosphere.
By plotting the locations of volcanoes and earthquakes, students can see a pattern of geological activity. Earth has an outermost rigid shell called the lithosphere. It is made up of the crust and part of the upper mantle. It is broken into about a dozen rigid plates that move without deforming, except at boundaries where they collide. Those plates range in thickness from a few to more than 100 kilometers. Ocean floors are the tops of thin oceanic plates that spread outward from midocean rift zones; land surfaces are the tops of thicker, less-dense continental plates.
Because students do not have direct contact with most of these phenomena and the long-term nature of the processes, some explanations of moving plates and the evolution of life must be reserved for late in grades 5-8. As students mature, the concept of evaporation can be reasonably well understood as the conservation of matter combined with a primitive idea of particles and the idea that air is real. Condensation is less well understood and requires extensive observation and instruction to complete an understanding of the water cycle.
The understanding that students gain from their observations in grades K-4 provides the motivation and the basis from which they can begin to construct a model that explains the visual and physical relationships among earth, sun, moon, and the solar system. Direct observation and satellite data allow students to conclude that earth is a moving, spherical planet, having unique features that distinguish it from other planets in the solar system. From activities with trajectories and orbits and using the earth-sun-moon system as an example, students can develop the understanding that gravity is a ubiquitous force that holds all parts of the solar system together. Energy from the sun transferred by light and other radiation is the primary energy source for processes on earth's surface and in its hydrosphere, atmosphere, and biosphere.
By grades 5-8, students have a clear notion about gravity, the shape of the earth, and the relative positions of the earth, sun, and moon. Nevertheless, more than half of the students will not be able to use these models to explain the phases of the moon, and correct explanations for the seasons will be even more difficult to achieve.
Guide to the Content Standard
Fundamental concepts and principles that underlie this standard include
STRUCTURE OF THE EARTH SYSTEM
-
The solid earth is layered with a lithosphere; hot, convecting mantle; and dense, metallic core.
[See Content Standard F (grades 5-8)]
-
Lithospheric plates on the scales of continents and oceans constantly move at rates of centimeters per year in response to movements in the mantle. Major geological events, such as earthquakes, volcanic eruptions, and mountain building, result from these plate motions.
-
Land forms are the result of a combination of constructive and destructive forces. Constructive forces include crustal deformation, volcanic eruption, and deposition of sediment, while destructive forces include weathering and erosion.
-
Some changes in the solid earth can be described as the "rock cycle." Old rocks at the earth's surface weather, forming sediments that are buried, then compacted, heated, and often recrystallized into new rock. Eventually, those new rocks may be brought to the surface by the forces that drive plate motions, and the rock cycle continues.
-
Soil consists of weathered rocks and decomposed organic material from dead plants, animals, and bacteria. Soils are often found in layers, with each having a different chemical composition and texture.
-
Water, which covers the majority of the earth's surface, circulates through the crust, oceans, and atmosphere in what is known as the "water cycle." Water evaporates from the earth's surface, rises and cools as it moves to higher elevations, condenses as rain or snow, and falls to the surface where it collects in lakes, oceans, soil, and in rocks underground.
-
Water is a solvent. As it passes through the water cycle it dissolves minerals and gases and carries them to the oceans.
-
The atmosphere is a mixture of nitrogen, oxygen, and trace gases that include water vapor. The atmosphere has different properties at different elevations.
-
Clouds, formed by the condensation of water vapor, affect weather and climate.
-
Global patterns of atmospheric movement influence local weather. Oceans have a major effect on climate, because water in the oceans holds a large amount of heat.
-
Living organisms have played many roles in the earth system, including affecting the composition of the atmosphere, producing some types of rocks, and contributing to the weathering of rocks.
-
EARTH'S HISTORY
[See Content Standard C (grades 5-8)]
-
The earth processes we see today, including erosion, movement of lithospheric plates, and changes in atmospheric composition, are similar to those that occurred in the past. earth history is also influenced by occasional catastrophes, such as the impact of an asteroid or comet.
-
Fossils provide important evidence of how life and environmental conditions have changed.
EARTH IN THE SOLAR SYSTEM
[See Unifying Concepts and Processes]
-
The earth is the third planet from the sun in a system that includes the moon, the sun, eight other planets and their moons, and smaller objects, such as asteroids and comets. The sun, an average star, is the central and largest body in the solar system.
-
Most objects in the solar system are in regular and predictable motion. Those motions explain such phenomena as the day, the year, phases of the moon, and eclipses.
-
Gravity is the force that keeps planets in orbit around the sun and governs the rest of the motion in the solar system. Gravity alone holds us to the earth's surface and explains the phenomena of the tides.
-
The sun is the major source of energy for phenomena on the earth's surface, such as growth of plants, winds, ocean currents, and the water cycle. Seasons result from variations in the amount of the sun's energy hitting the surface, due to the tilt of the earth's rotation on its axis and the length of the day.
Science and Technology
Content Standard E
As a result of activities in grades 5-8, all students should develop
-
Abilities of technological design
-
Understandings about science and technology
Developing Student Abilities and Understanding
Students in grades 5-8 can begin to differentiate between science and technology, although the distinction is not easy to make early in this level. One basis for understanding the similarities, differences, and relationships between science and technology should be experiences with design and problem solving in which students can further develop some of the abilities introduced in grades K-4. The understanding of technology can be developed by tasks in which students have to design something and also by studying technological products and systems.
In the middle-school years, students' work with scientific investigations can be complemented by activities in which the purpose is to meet a human need, solve a
|
In the middle-school years, students' work with scientific investigations can be complemented by activities in which the purpose is to meet a human need, solve a human problem, or develop a product . . . |
human problem, or develop a product rather than to explore ideas about the natural world. The tasks chosen should involve the use of science concepts already familiar to students or should motivate them to learn new concepts needed to use or understand the technology. Students should also, through the experience of trying to meet a need in the best possible way, begin to appreciate that technological design and problem solving involve many other factors besides the scientific issues.
Suitable design tasks for students at these grades should be well-defined, so that the purposes of the tasks are not confusing. Tasks should be based on contexts that are immediately familiar in the homes, school, and immediate community of the students. The activities should be straightforward with only a few well-defined ways to solve the problems involved. The criteria for success and the constraints for design should be limited. Only one or two science ideas should be involved in any particular task. Any construction involved should be readily
The Egg Drop
This rich example includes both a description of teaching and an assessment task. Mr. S. has students engage in a full design activity, designing and testing a container that can prevent an egg from breaking when dropped. The technology activity was preceded by a science unit on force and motion so that students were able to use their understanding of science in the design process. He has carefully considered commercially prepared versions of this activity but modified them to create one based on his experiences and the needs of the students. He has considered the safety of the students. The use of the videotape of former students not only provides a local context for the activity, but provides students with ideas about the designs that work and do not work. After the enjoyable day, Mr. S. requires students to reflect on what they have learned and apply it to a new, but similar problem.
[This example highlights some elements of all of the Teaching Standards; Assessment Standard A; 5-8 Content Standards B and E; Program Standard D; and System Standard D.]
As Mr. S. reviewed his syllabus for the year, he saw the next unit and smiled. On Monday they would begin the ''Egg Drop"—the students, working in teams, would design a container for an uncooked egg. The time was right. During the period between the winter break and the new semester, the students had focused on the similarities and differences between science and technology. At the beginning of the second semester the students had completed activities and engaged in discussions until they demonstrated an adequate understanding of force, motion, gravity and acceleration. Now it was time to bring the knowledge of science principles to a design problem. The problem was to design a container that could be dropped from the second floor balcony without breaking the egg.
Some variation of the egg drop activity was found in just about every middle school science book that Mr. S. had ever seen. But over the years he had come to know what worked and what didn't, where to anticipate the students would have difficulties, and just how to phrase questions and challenges the students could respond to without being overwhelmed. He had developed some aspects of the unit that were special to him and to the students in Belle Vue Middle School. He knew when he introduced the idea that at least one student would have a tale to tell about dropping a carton of eggs when carrying groceries home from the store or when removing the carton from the refrigerator. While dropping eggs from the balcony was not part of the every day experience of the students, dropping things and having them break was.
On Monday, he would set the challenge, the constraints, and the schedule. They would begin with a whole class review of what the students knew about force, acceleration, and gravity and the design principles. He would have someone write these on a chart that they could hang on the wall during the unit. Next they would identify things they had seen fall gently without breaking and about the size, shape, material, and construction of these items. Finally he would tell the students the constraints: teams would be made up of three students each; materials would be limited to the 'stuff' available on the work table; teams would have to show him a sketch before they began building their container; they would have to conduct at least two trials with their container—one with a plastic egg and one
with a hard-cooked egg. For years, he had collected odds and ends—string and plastic, paper towel rolls end egg cartons, Styrofoam peanuts, cotton and other packing material. In the world outside of school, limited availability of materials was a real constraint. He was grateful that he taught in Florida where he could open the door and watch the students outside as they climbed to the second floor balcony to conduct their trial runs. He knew that if he taught up North, where they would have to do this activity from the gym balcony, he would have to plan differently as the class would have to move to and from the gym.
On Tuesday, he would have a few raw eggs for each class. He would have several students try to crush them by exerting force with their hands. He would need lab aprons, goggles, and plastic gloves for that. Then he would show the egg drop video. After the first few years, he learned to videotape the class on the day of the egg drop. He had edited a short video of some of the more spectacular egg drops—both successful and unsuccessful. The students enjoyed watching older brothers and sisters, and famous and infamous students. The students would then get into their groups and discuss the features of the containers in which the eggs broke and those in which the eggs did not break. He would challenge them to consider how they might improve the successful egg drop containers. Toward the end of the period, each group would have someone report to the class one thing the group had learned from the video and discussion.
Wednesday would be an intense day as students argued and sketched, sketched and argued, had plans approved, collected materials, bartered with other teams for materials, and tried to build a prototype of their container.
Thursday they would begin class with a discussion of why they needed to build a prototype and why they needed to do some trial runs with plastic and hard cooked eggs. He would ask them the advantages and disadvantages of using the plastic and hard cooked eggs in the trial runs. This would give them an opportunity to consider cost and the characteristics of models. There would be time in class to work and some groups would be ready to begin the field trials. He would need a supply of trash bags to use as drop cloths.
Friday's class would begin by reminding the students that the assessment for the egg drop would not be whether the egg broke, but rather how they would be able to share what they considered as they tried to solve the problem of designing a container for an egg so that the egg would drop 15 feet and not break. He would also remind them that the egg drop was scheduled for Wednesday, ready or not.
Monday would be an uninterrupted work day. On Tuesday they would by work in their groups to determine what would be needed to make their egg drop event a success. In his plans Mr. S. noted that he would need a setup team that would cover the ground below the balcony with trash bags. A clean up crew, again wearing plastic gloves, would gather the bags and get them into the disposal. He anticipated that they would want two class mates to have stopwatches to measure the time it took for the egg to drop. The students would want to determine where the egg should be held for the start of the egg drop. There were always heated arguments about whether the
starting line was from the arm of the dropper or from some point on the container. They would need someone to call "Drop!"
Wednesday would be the day of the egg drop. Thursday, the class would begin by meeting in their small groups to discuss what worked, what didn't, why, and what they would do differently if they were to do the egg drop design experiment again. Then they would discuss these same ideas as a whole class.
Friday, the students would fill the board with characteristics of good design procedures. Then they would write and sketch in their notebooks these characteristics and what each had learned from the egg drop activity. He knew from experience that the egg drop would be an engaging activity.
The "header titles" emphasize some important components of the assessment process.
SCIENCE CONTENT: The Content Standards for Science and Technology for students in Grades 5-8 call for them to understand and be able to solve a problem by using design principles. These include the ability to design a product; evaluate technological products; and communicate the process of technological design.
ASSESSMENT ACTIVITY: Following the egg drop activity, students each prepare a report on one thing they propose in order to improve their team's container and how they would test the effectiveness of their improvement.
ASSESSMENT TYPE: Individual. embedded in teaching.
ASSESSMENT PURPOSE: The teacher will use the information to assess student understanding of the process of design and for assigning a grade.
DATA: A report, written, sketched, or both, in which students describe an improvement to the container, the anticipated gains and losses from the improvement, and how they would propose to test the new container.
CONTEXT: The egg drop activity allows students the opportunity to bring scientific principles and creativity to a problem, while developing the skills of technology and having a good time. However, the excitement of the activity can overshadow the intended outcome of developing understanding and abilities of technological design. This assessment activity provides the opportunity for students to reflect on what they have experienced and articulate what they have come to understand. The activity comes after the design of an original container, the testing of that container, a class discussion on what worked and why, what didn't work and why, what they would do differently next time, and an opportunity to make notes in a personal journal for science class.
EVALUATING STUDENT PERFORMANCE: Student progress in understanding and doing design can be evaluated by comparing the student responses in the reports with the list generated by previous classes. The astute teacher will have made sure that the list included constraints such as cost, time, materials, and trade-offs. Criteria for a quality report might also include how well the student has differentiated between the design and its evaluation. The teacher might also consider the clarity of expression, as well as alternate ways used to present the information, such as drawings.
accomplished by the students and should not involve lengthy learning of new physical skills or time-consuming preparation and assembly operations.
During the middle-school years, the design tasks should cover a range of needs, materials, and aspects of science. Suitable experiences could include making electrical circuits for a warning device, designing a meal to meet nutritional criteria, choosing a material to combine strength with insulation, selecting plants for an area of a school, or designing a system to move dishes in a restaurant or in a production line.
Such work should be complemented by the study of technology in the students' everyday world. This could be achieved by investigating simple, familiar objects through which students can develop powers of observation and analysis—for example, by comparing the various characteristics of competing consumer products, including cost, convenience, durability, and suitability for different modes of use. Regardless of the product used, students need to understand the science behind it. There should be a balance over the years, with the products studied coming from the areas of clothing, food, structures, and simple mechanical and electrical devices. The inclusion of some nonproduct-oriented problems is important to help students understand that technological solutions include the design of systems and can involve communication, ideas, and rules.
The principles of design for grades 5-8 do not change from grades K-4. But the complexity of the problems addressed and the extended ways the principles are applied do change.
Guide to the Content Standard
Fundamental abilities and concepts that underlie this standard include
ABILITIES OF TECHNOLOGICAL DESIGN
[See Content Standard A (grades 5-8)]
IDENTIFY APPROPRIATE PROBLEMS FOR TECHNOLOGICAL DESIGN. Students should develop their abilities by identifying a specified need, considering its various aspects, and talking to different potential users or beneficiaries. They should appreciate that for some needs, the cultural backgrounds and beliefs of different groups can affect the criteria for a suitable product.
DESIGN A SOLUTION OR PRODUCT. Students should make and compare different proposals in the light of the criteria they have selected. They must consider constraints—such as cost, time, trade-offs, and materials needed—and communicate ideas with drawings and simple models.
IMPLEMENT A PROPOSED DESIGN. Students should organize materials and other resources, plan their work, make good use of group collaboration where appropriate, choose suitable tools and techniques, and work with appropriate measurement methods to ensure adequate accuracy.
EVALUATE COMPLETED TECHNOLOGICAL DESIGNS OR PRODUCTS. Students should use criteria relevant to the original purpose or need, consider a variety of factors that might affect acceptability and suitability for intended users or beneficiaries, and develop measures of quality with respect to such criteria and factors; they should also suggest
improvements and, for their own products, try proposed modifications.
[See Teaching Standard B]
COMMUNICATE THE PROCESS OF TECHNOLOGICAL DESIGN. Students should review and describe any completed piece of work and identify the stages of problem identification, solution design, implementation, and evaluation.
UNDERSTANDINGS ABOUT SCIENCE AND TECHNOLOGY
[See Content Standards A, F, & G (grades 5-8)]
-
Scientific inquiry and technological design have similarities and differences. Scientists propose explanations for questions about the natural world, and engineers propose solutions relating to human problems, needs, and aspirations. Technological solutions are temporary; technologies exist within nature and so they cannot contravene physical or biological principles; technological solutions have side effects; and technologies cost, carry risks, and provide benefits.
-
Many different people in different cultures have made and continue to make contributions to science and technology.
-
Science and technology are reciprocal. Science helps drive technology, as it addresses questions that demand more sophisticated instruments and provides principles for better instrumentation and technique. Technology is essential to science, because it provides instruments and techniques that enable observations of objects and phenomena that are otherwise unobservable due to factors such as quantity, distance, location, size, and speed. Technology also provides tools for investigations, inquiry, and analysis.
-
Perfectly designed solutions do not exist. All technological solutions have trade-offs, such as safety, cost, efficiency, and appearance. Engineers often build in back-up systems to provide safety. Risk is part of living in a highly technological world. Reducing risk often results in new technology.
-
Technological designs have constraints. Some constraints are unavoidable, for example, properties of materials, or effects of weather and friction; other constraints limit choices in the design, for example, environmental protection, human safety, and aesthetics.
-
Technological solutions have intended benefits and unintended consequences. Some consequences can be predicted, others cannot.
Science in Personal and Social Perspectives
Content Standard F
As a result of activities in grades 5-8, all students should develop understanding of
-
Personal health
-
Populations, resources, and environments
-
Natural hazards
-
Risks and benefits
-
Science and technology in society
Developing Student Understanding
Due to their developmental levels and expanded understanding, students in grades 5-8 can undertake sophisticated study of personal and societal challenges. Building on the foundation established in grades K-4, students can expand their study of health and establish linkages among populations, resources, and environments; they can develop an understanding of natural hazards, the role of technology in relation to personal and societal issues, and learn about risks and personal decisions. Challenges emerge from the knowledge that the products, processes, technologies and inventions of a society can result in pollution and environmental degradation and can involve some level of risk to human health or to the survival of other species.
The study of science-related personal and societal challenges is an important endeavor for science education at the middle level. By middle school, students begin to realize that illness can be caused by various factors, such as microorganisms, genetic predispositions, malfunctioning of organs and organ-systems, health habits, and environmental conditions. Students in grades 5-8 tend to focus on physical more than mental health. They associate health with food and fitness more than with other factors such as safety and substance use. One very important issue for teachers in grades 5-8 is overcoming students' perceptions that most factors related to health are beyond their control.
Students often have the vocabulary for many aspects of health, but they often do not understand the science related to the terminology. Developing a scientific understanding of health is a focus of this standard. Healthy behaviors and other aspects of health education are introduced in other parts of school programs.
By grades 5-8, students begin to develop a more conceptual understanding of ecological crises. For example, they begin to realize the cumulative ecological effects of pollution. By this age, students can study environmental issues of a large and abstract
|
Although students in grades 5-8 have some awareness of global issues, teachers should challenge misconceptions, such as anything natural is not a pollutant, oceans are limitless resources, and humans are indestructible as a species. |
nature, for example, acid rain or global ozone depletion. However, teachers should challenge several important misconceptions, such as anything natural is not a pollutant, oceans are limitless resources, and humans are indestructible as a species.
Little research is available on students' perceptions of risk and benefit in the context of science and technology. Students sometimes view social harm from technological failure as unacceptable. On the other hand, some believe if the risk is personal and voluntary, then it is part of life and should not be the concern of others (or society). Helping students develop an understanding of risks and benefits in the areas of health, natural hazards—and science and technology in general—presents a challenge to middle-school teachers.
Middle-school students are generally aware of science-technology-society issues
from the media, but their awareness is fraught with misunderstandings. Teachers should begin developing student understanding with concrete and personal examples that avoid an exclusive focus on problems.
Guide to the Content Standard
Fundamental concepts and principles that underlie this standard include
PERSONAL HEALTH
-
Regular exercise is important to the maintenance and improvement of health. The benefits of physical fitness include maintaining healthy weight, having energy and strength for routine activities, good muscle tone, bone strength, strong heart/lung systems, and improved mental health. Personal exercise, especially developing cardiovascular endurance, is the foundation of physical fitness.
-
The potential for accidents and the existence of hazards imposes the need for injury prevention. Safe living involves the development and use of safety precautions and the recognition of risk in personal decisions. Injury prevention has personal and social dimensions.
-
The use of tobacco increases the risk of illness. Students should understand the influence of short-term social and psychological factors that lead to tobacco use, and the possible long-term detrimental effects of smoking and chewing tobacco.
-
Alcohol and other drugs are often abused substances. Such drugs change how the body functions and can lead to addition.
-
Food provides energy and nutrients for growth and development. Nutrition requirements vary with body weight, age, sex, activity, and body functioning.
-
Sex drive is a natural human function that requires understanding. Sex is also a prominent means of transmitting diseases. The diseases can be prevented through a variety of precautions.
-
Natural environments may contain substances (for example, radon and lead) that are harmful to human beings. Maintaining environmental health involves establishing or monitoring quality standards related to use of soil, water, and air.
POPULATIONS, RESOURCES, AND ENVIRONMENTS
-
When an area becomes overpopulated, the environment will become degraded due to the increased use of resources.
-
Causes of environmental degradation and resource depletion vary from region to region and from country to country.
NATURAL HAZARDS
[See Content Standard D (grades 5-8)]
-
Internal and external processes of the earth system cause natural hazards, events that change or destroy human and wildlife habitats, damage property, and harm or kill humans. Natural hazards include earthquakes, landslides, wildfires, volcanic eruptions, floods, storms, and even possible impacts of asteroids.
-
Human activities also can induce hazards through resource acquisition, urban growth, land-use decisions, and waste disposal. Such activities can accelerate many natural changes.
-
Natural hazards can present personal and societal challenges because misidentifying the change or incorrectly estimating the rate and scale of change may result in either too little attention and significant
-
human costs or too much cost for unneeded preventive measures.
RISKS AND BENEFITS
-
Risk analysis considers the type of hazard and estimates the number of people that might be exposed and the number likely to suffer consequences. The results are used to determine the options for reducing or eliminating risks.
-
Students should understand the risks associated with natural hazards (fires, floods, tornadoes, hurricanes, earthquakes, and volcanic eruptions), with chemical hazards (pollutants in air, water, soil, and food), with biological hazards (pollen, viruses, bacterial, and parasites), social hazards (occupational safety and transportation), and with personal hazards (smoking, dieting, and drinking).
-
Individuals can use a systematic approach to thinking critically about risks and benefits. Examples include applying probability estimates to risks and comparing them to estimated personal and social benefits.
-
Important personal and social decisions are made based on perceptions of benefits and risks.
[See Content Standard E (grades 5-8)]
SCIENCE AND TECHNOLOGY IN SOCIETY
-
Science influences society through its knowledge and world view. Scientific knowledge and the procedures used by scientists influence the way many individuals in society think about themselves, others, and the environment. The effect of science on society is neither entirely beneficial nor entirely detrimental.
-
Societal challenges often inspire questions for scientific research, and social priorities often influence research priorities through the availability of funding for research.
-
Technology influences society through its products and processes. Technology influences the quality of life and the ways people act and interact. Technological changes are often accompanied by social, political, and economic changes that can be beneficial or detrimental to individuals and to society. Social needs, attitudes, and values influence the direction of technological development.
-
Science and technology have advanced through contributions of many different people, in different cultures, at different times in history. Science and technology have contributed enormously to economic growth and productivity among societies and groups within societies.
-
Scientists and engineers work in many different settings, including colleges and universities, businesses and industries, specific research institutes, and government agencies.
-
Scientists and engineers have ethical codes requiring that human subjects involved with research be fully informed about risks and benefits associated with the research before the individuals choose to participate. This ethic extends to potential risks to communities and property. In short, prior knowledge and consent are required for research involving human subjects or potential damage to property.
-
Science cannot answer all questions and technology cannot solve all human problems or meet all human needs. Students
-
should understand the difference between scientific and other questions. They should appreciate what science and technology can reasonably contribute to society and what they cannot do. For example, new technologies often will decrease some risks and increase others.
|
Science and technology have advanced through contributions of many different people, in different cultures, at different times in history. |
History and Nature of Science
Content Standard G
As a result of activities in grades 5-8, all students should develop understanding of
-
Science as a human endeavor
-
Nature of science
-
History of science
Developing Student Understanding
Experiences in which students actually engage in scientific investigations provide the background for developing an understanding of the nature of scientific inquiry, and will also provide a foundation for appreciating the history of science described in this standard.
The introduction of historical examples will help students see the scientific enterprise as more philosophical, social, and human. Middle-school students can thereby develop a better understanding of scientific inquiry and the interactions between science and society. In general, teachers of science should not assume that students have an accurate conception of the nature of science in either contemporary or historical contexts.
To develop understanding of the history and nature of science, teachers of science can use the actual experiences of student investigations, case studies, and historical vignettes. The intention of this standard is not to develop an overview of the complete history of science. Rather, historical examples are used to help students understand scientific inquiry, the nature of scientific knowledge, and the interactions between science and society.
Guide to the Content Standard
Fundamental concepts and principles that underlie this standard include
SCIENCE AS A HUMAN ENDEAVOR
-
Women and men of various social and ethnic backgrounds—and with diverse interests, talents, qualities, and motivations—engage in the activities of science, engineering, and related fields such as the health professions. Some scientists work in teams, and some work alone, but all communicate extensively with others.
-
Science requires different abilities, depending on such factors as the field of study and type of inquiry. Science is very much a human endeavor, and the work of science relies on basic human qualities, such as reasoning, insight, energy, skill, and creativity—as well as on scientific habits of mind, such as intellectual honesty, tolerance of ambiguity, skepticism, and openness to new ideas.
NATURE OF SCIENCE
-
Scientists formulate and test their explanations of nature using observation, experiments, and theoretical and mathematical models. Although all scientific ideas are tentative and subject to change and improvement in principle, for most major ideas in science, there is much experimental and observational confirmation. Those ideas are not likely to change greatly in the future. Scientists do and have changed their ideas about nature when they encounter new experimental evidence that does not match their existing explanations.
-
In areas where active research is being pursued and in which there is not a great deal of experimental or observational evidence and understanding, it is normal for scientists to differ with one another about the interpretation of the evidence or theory being considered. Different scientists might publish conflicting experimental results or might draw different conclusions from the same data. Ideally, scientists acknowledge such conflict and work towards finding evidence that will resolve their disagreement.
-
It is part of scientific inquiry to evaluate the results of scientific investigations, experiments, observations, theoretical models, and the explanations proposed by other scientists. Evaluation includes reviewing the experimental procedures, examining the evidence, identifying faulty reasoning, pointing out statements that go beyond the evidence, and suggesting alternative explanations for the same observations. Although scientists may disagree about explanations of phenomena, about interpretations of data, or about the value of rival theories, they do agree that questioning, response to criticism, and open communication are integral to the process of science. As scientific knowledge evolves, major disagreements are eventually resolved through such interactions between scientists.
HISTORY OF SCIENCE
-
Many individuals have contributed to the traditions of science. Studying some of these individuals provides further understanding of scientific inquiry, science as a human endeavor, the nature of science, and the relationships between science and society.
-
In historical perspective, science has been practiced by different individuals in different cultures. In looking at the history of many peoples, one finds that scientists and engineers of high achievement are considered to be among the most valued contributors to their culture.
-
Tracing the history of science can show how difficult it was for scientific innovators to break through the accepted ideas of their time to reach the conclusions that we currently take for granted.
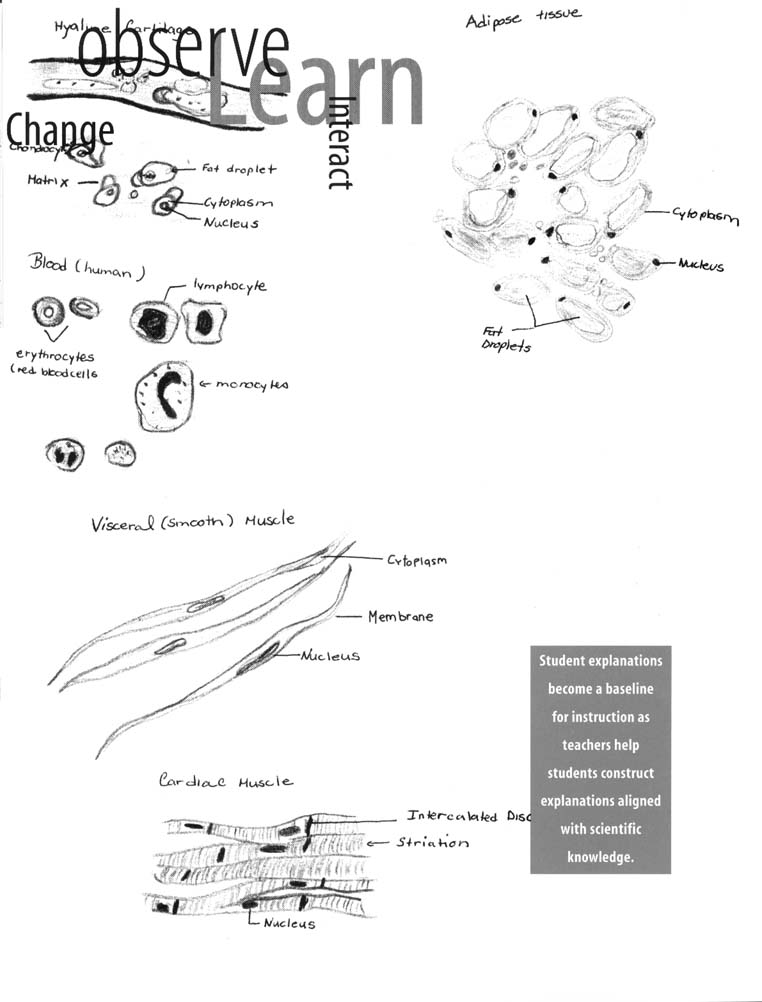
Content Standards: 9-12
Science as Inquiry
Content Standard A
As a result of activities in grades 9–12, all students should develop
-
Abilities necessary to do scientific inquiry
-
Understandings about scientific inquiry
Developing Student Abilities and Understanding
For students to develop the abilities that characterize science as inquiry, they must actively participate in scientific investigations, and they must actually use the cognitive and manipulative skills associated with the formulation of scientific explanations. This standard describes the fundamental abilities and understandings of inquiry, as well as a larger framework for conducting scientific investigations of natural phenomena.
In grades 9-12, students should develop sophistication in their abilities and understanding of scientific inquiry. Students can understand that experiments are guided by concepts and are performed to test ideas. Some students still have trouble with variables and controlled experiments. Further, students often have trouble dealing with data that seem anomalous and in proposing explanations based on evidence and logic rather than on their prior beliefs about the natural world.
One challenge to teachers of science and to curriculum developers is making science investigations meaningful. Investigations should derive from questions and issues that have meaning for students. Scientific topics that have been highlighted by current events provide one source, whereas actual science- and technology-related problems provide another source of meaningful investigations. Finally, teachers of science should remember that some experiences begin with little meaning for students but develop meaning through active involvement, continued
exposure, and growing skill and understanding.
A critical component of successful scientific inquiry in grades 9-12 includes having students reflect on the concepts that guide the inquiry. Also important is the prior establishment of an adequate knowledge base to support the investigation and help develop scientific explanations. The concepts of the world that students bring to school will shape the way they engage in science investigations, and serve as filters for their explanations of scientific phenomena. Left unexamined, the limited nature of students' beliefs will interfere with their ability to develop a deep understanding of science. Thus, in a full inquiry, instructional strategies such as small-group discussions, labeled drawings, writings, and concept mapping should be used by the teacher of science to gain information about students' current explanations. Those student explanations then become a baseline for instruction as teachers help students construct explanations aligned with scientific knowledge; teachers also help students evaluate their own explanations and those made by scientists.
Students also need to learn how to analyze evidence and data. The evidence they analyze may be from their investigations, other students' investigations, or databases. Data manipulation and analysis strategies need to be modeled by teachers of science and practiced by students. Determining the range of the data, the mean and mode values of the data, plotting the data, developing mathematical functions from the data, and looking for anomalous data are all examples of analyses students can perform. Teachers of science can ask questions, such as ''What explanation did you expect to develop from the data?" "Were there any surprises in the data?" "How confident do you feel about the accuracy of the data?" Students should answer questions such as these during full and partial inquiries.
Public discussions of the explanations proposed by students is a form of peer review of investigations, and peer review is an important aspect of science. Talking with peers about science experiences helps students develop meaning and understanding. Their conversations clarify the concepts and processes of science, helping students make sense of the content of science. Teachers of science should engage students in conversations that focus on questions, such as "How do we know?" "How certain are you of those results?" "Is there a better way to do the investigation?" "If you had to explain this to someone who knew nothing about the project, how would you do it?" "Is there an alternative scientific explanation for the one we proposed?" "Should we do the investigation over?" "Do we need more evidence?" "What are our sources of experimental error?" "How do you account for an explanation that is different from ours?"
Questions like these make it possible for students to analyze data, develop a richer knowledge base, reason using science concepts, make connections between evidence and explanations, and recognize alternative explanations. Ideas should be examined and discussed in class so that other students can benefit from the feedback. Teachers of science can use the ideas of students in their class, ideas from other classes, and ideas from texts, databases, or other sources—but
scientific ideas and methods should be discussed in the fashion just described.
Guide to the Content Standard
Fundamental abilities and concepts that underlie this standard include
ABILITIES NECESSARY TO DO SCIENTIFIC INQUIRY
IDENTIFY QUESTIONS AND CONCEPTS THAT GUIDE SCIENTIFIC INVESTIGATIONS. Students should formulate a testable hypothesis and demonstrate the logical connections between the scientific concepts guiding a hypothesis and the design of an experiment. They should demonstrate appropriate procedures, a knowledge base, and conceptual understanding of scientific investigations.
DESIGN AND CONDUCT SCIENTIFIC INVESTIGATIONS. Designing and conducting a scientific investigation requires introduction to the major concepts in the area being investigated, proper equipment, safety precautions, assistance with methodological problems, recommendations for use of technologies, clarification of ideas that guide the inquiry, and scientific knowledge obtained from sources other than the actual investigation. The investigation may also require student clarification of the question, method, controls, and variables; student organization and display of data; student revision of methods and explanations; and a public presentation of the results with a critical response from peers. Regardless of the scientific investigation performed, students must use evidence, apply logic, and construct an argument for their proposed explanations.
USE TECHNOLOGY AND MATHEMATICS TO IMPROVE INVESTIGATIONS AND COMMUNICATIONS. A variety of technologies, such as hand tools, measuring instruments, and calculators, should be an integral component of scientific investigations. The use of computers for the collection, analysis, and display of data is also a part of this standard. Mathematics plays an essential role in all aspects of an inquiry. For example, measurement is used for posing questions, formulas are used for developing explanations, and charts and graphs are used for communicating results.
FORMULATE AND REVISE SCIENTIFIC EXPLANATIONS AND MODELS USING LOGIC AND EVIDENCE. Student inquiries should culminate in formulating an explanation or model. Models should be physical, conceptual, and mathematical. In the process of answering the questions, the students should engage in discussions and arguments that result in the revision of their explanations. These discussions should be based on scientific knowledge, the use of logic, and evidence from their investigation.
RECOGNIZE AND ANALYZE ALTERNATIVE EXPLANATIONS AND MODELS. This aspect of the standard emphasizes the critical abilities of analyzing an argument by reviewing current scientific understanding, weighing the evidence, and examining the logic so as to decide which explanations and models are best. In other words, although there may be several plausible explanations, they do not all have equal weight. Students should be able to use scientific criteria to find the preferred explanations.
[See Teaching Standard B in Chapter 3]
COMMUNICATE AND DEFEND A SCIENTIFIC ARGUMENT. Students in school science programs should develop the abilities associated with accurate and effective communication. These include writing and following procedures, expressing concepts, reviewing information, summarizing data, using language appropriately, developing diagrams and charts, explaining statistical analysis, speaking clearly and logically, constructing a reasoned argument, and responding appropriately to critical comments.
UNDERSTANDINGS ABOUT SCIENTIFIC INQUIRY
[See Unifying Concepts and Processes]
[See Content Standard E (grades 9-12)]
[See Program Standard C]
-
Scientists usually inquire about how physical, living, or designed systems function. Conceptual principles and knowledge guide scientific inquiries. Historical and current scientific knowledge influence the design and interpretation of investigations and the evaluation of proposed explanations made by other scientists.
-
Scientists conduct investigations for a wide variety of reasons. For example, they may wish to discover new aspects of the natural world, explain recently observed phenomena, or test the conclusions of prior investigations or the predictions of current theories.
-
Scientists rely on technology to enhance the gathering and manipulation of data. New techniques and tools provide new evidence to guide inquiry and new methods to gather data, thereby contributing to the advance of science. The accuracy and precision of the data, and therefore the quality of the exploration, depends on the technology used.
-
Mathematics is essential in scientific inquiry. Mathematical tools and models guide and improve the posing of questions, gathering data, constructing explanations and communicating results.
-
Scientific explanations must adhere to criteria such as: a proposed explanation must be logically consistent; it must abide by the rules of evidence; it must be open to questions and possible modification; and it must be based on historical and current scientific knowledge.
-
Results of scientific inquiry—new knowledge and methods—emerge from different types of investigations and public communication among scientists. In communicating and defending the results of scientific inquiry, arguments must be logical and demonstrate connections between natural phenomena, investigations, and the historical body of scientific knowledge. In addition, the methods and procedures that scientists used to obtain evidence must be clearly reported to enhance opportunities for further investigation.
Physical Science
Content Standard B
As a result of their activities in grades 9-12, all students should develop an understanding of
-
Structure of atoms
-
Structure and properties of matter
-
Chemical reactions
-
Motions and forces
-
Conservation of energy and increase in disorder
-
Interactions of energy and matter
Developing Student Understanding
High-school students develop the ability to relate the macroscopic properties of substances that they study in grades K-8 to the microscopic structure of substances. This development in understanding requires students to move among three domains of thought—the macroscopic world of observable phenomena, the microscopic world of molecules, atoms, and subatomic particles, and the symbolic and mathematical world of chemical formulas, equations, and symbols.
The relationship between properties of matter and its structure continues as a major component of study in 9-12 physical science. In the elementary grades, students studied the properties of matter and the classification of substances using easily observable properties. In the middle grades, they examined change of state, solutions, and simple chemical reactions, and developed enough knowledge and experience to define the properties of elements and compounds. When students observe and integrate a wide variety of evidence, such as seeing copper "dissolved" by an acid into a solution and then retrieved as pure copper when it is displaced by zinc, the idea that copper atoms are the same for any copper object begins to make sense. In each of these reactions, the knowledge that the mass of the substance does not change can be interpreted by assuming that the number of particles does not change during their rearrangement in the reaction. Studies of student understanding of molecules indicate that it will be difficult for them to comprehend the very small size and large number of particles involved. The connection between the particles and the chemical formulas that represent them is also often not clear.
It is logical for students to begin asking about the internal structure of atoms, and it will be difficult, but important, for them to know "how we know." Quality learning and the spirit and practice of scientific inquiry are lost when the evidence and argument for atomic structure are replaced by direct assertions by the teacher and text. Although many experiments are difficult to replicate in school, students can read some of the actual reports and examine the chain of evidence that led to the development of the current concept of the atom. The nature of the atom is far from totally understood; scientists continue to investigate atoms and have discovered even smaller constituents of which neutrons and protons are made.
Laboratory investigation of the properties of substances and their changes through a range of chemical interactions provide a basis for the high school graduate to understand a variety of reaction types and their applications, such as the capability to liberate elements from ore, create new drugs, manipulate the structure of genes, and synthesize polymers.
Understanding of the microstructure of matter can be supported by laboratory experiences with the macroscopic and microscopic world of forces, motion (including vibrations and waves), light, and electricity. These experiences expand upon the ones that the students had in the middle school and provide new ways of understanding the movement of muscles, the transport of materials across cell membranes, the behavior of atoms and molecules, communication technologies, and the
movement of planets and galaxies. By this age, the concept of a force is better understood, but static forces in equilibrium and students' intuitive ideas about forces on projectiles and satellites still resist change through instruction for a large percentage of the students.
On the basis of their experiences with energy transfers in the middle grades, high-school students can investigate energy transfers quantitatively by measuring variables such as temperature change and kinetic energy. Laboratory investigations and descriptions of other experiments can help students understand the evidence that leads to the conclusion that energy is conserved. Although the operational distinction between temperature and heat can be fairly well understood after careful instruction, research with high-school students indicates that the idea that heat is the energy of random motion and vibrating molecules is difficult for students to understand.
Guide to the Content Standard
Fundamental concepts and principles that underlie this standard include
STRUCTURE OF ATOMS
-
Matter is made of minute particles called atoms, and atoms are composed of even smaller components. These components have measurable properties, such as mass and electrical charge. Each atom has a positively charged nucleus surrounded by negatively charged electrons. The electric force between the nucleus and electrons holds the atom together.
-
The atom's nucleus is composed of protons and neutrons, which are much more massive than electrons. When an element has atoms that differ in the number of neutrons, these atoms are called different isotopes of the element.
-
The nuclear forces that hold the nucleus of an atom together, at nuclear distances, are usually stronger than the electric forces that would make it fly apart. Nuclear reactions convert a fraction of the mass of interacting particles into energy, and they can release much greater amounts of energy than atomic interactions. Fission is the splitting of a large nucleus into smaller pieces. Fusion is the joining of two nuclei at extremely high temperature and pressure, and is the process responsible for the energy of the sun and other stars.
-
Radioactive isotopes are unstable and undergo spontaneous nuclear reactions, emitting particles and/or wavelike radiation. The decay of any one nucleus cannot be predicted, but a large group of identical nuclei decay at a predictable rate. This predictability can be used to estimate the age of materials that contain radioactive isotopes.
STRUCTURE AND PROPERTIES OF MATTER
-
Atoms interact with one another by transferring or sharing electrons that are furthest from the nucleus. These outer electrons govern the chemical properties of the element.
-
An element is composed of a single type of atom. When elements are listed in order according to the number of protons (called the atomic number), repeating patterns of physical and chemical properties identify families of elements
-
Bonds between atoms are created when electrons are paired up by being transferred or shared. A substance composed of a single kind of atom is called an element. The atoms may be bonded together into molecules or crystalline solids. A compound is formed when two or more kinds of atoms bind together chemically.
-
The physical properties of compounds reflect the nature of the interactions among its molecules. These interactions are determined by the structure of the molecule, including the constituent atoms and the distances and angles between them.
-
Solids, liquids, and gases differ in the distances and angles between molecules or atoms and therefore the energy that binds them together. In solids the structure is nearly rigid; in liquids molecules or atoms move around each other but do not move apart; and in gases molecules or atoms move almost independently of each other and are mostly far apart.
-
Carbon atoms can bond to one another in chains, rings, and branching networks to form a variety of structures, including synthetic polymers, oils, and the large molecules essential to life.
with similar properties. This "Periodic Table" is a consequence of the repeating pattern of outermost electrons and their permitted energies.
CHEMICAL REACTIONS
[See Content Standard C (Grades 9-12)]
-
Chemical reactions occur all around us, for example in health care, cooking, cosmetics, and automobiles. Complex chemical reactions involving carbon-based molecules take place constantly in every cell in our bodies.
-
Chemical reactions may release or consume energy. Some reactions such as the burning of fossil fuels release large amounts of energy by losing heat and by emitting light. Light can initiate many chemical reactions such as photosynthesis and the evolution of urban smog.
-
A large number of important reactions involve the transfer of either electrons (oxidation/reduction reactions) or hydrogen ions (acid/base reactions) between reacting ions, molecules, or atoms. In other reactions, chemical bonds are broken by heat or light to form very reactive radicals with electrons ready to form new bonds. Radical reactions control many processes such as the presence of ozone and greenhouse gases in the atmosphere, burning and processing of fossil fuels, the formation of polymers, and explosions.
-
Chemical reactions can take place in time periods ranging from the few femtoseconds (10-15 seconds) required for an atom to move a fraction of a chemical bond distance to geologic time scales of billions of years. Reaction rates depend on how often the reacting atoms and molecules encounter one another, on the temperature, and on the properties—including shape—of the reacting species.
-
Catalysts, such as metal surfaces, accelerate chemical reactions. Chemical reactions in living systems are catalyzed by protein molecules called enzymes.
MOTIONS AND FORCES
-
Objects change their motion only when a net force is applied. Laws of motion are used to calculate precisely the effects of forces on the motion of objects. The
-
Gravitation is a universal force that each mass exerts on any other mass. The strength of the gravitational attractive force between two masses is proportional to the masses and inversely proportional to the square of the distance between them.
-
The electric force is a universal force that exists between any two charged objects. Opposite charges attract while like charges repel. The strength of the force is proportional to the charges, and, as with gravitation, inversely proportional to the square of the distance between them.
-
Between any two charged particles, electric force is vastly greater than the gravitational force. Most observable forces such as those exerted by a coiled spring or friction may be traced to electric forces acting between atoms and molecules.
-
Electricity and magnetism are two aspects of a single electromagnetic force. Moving electric charges produce magnetic forces, and moving magnets produce electric forces. These effects help students to understand electric motors and generators.
magnitude of the change in motion can be calculated using the relationship F = ma, which is independent of the nature of the force. Whenever one object exerts force on another, a force equal in magnitude and opposite in direction is exerted on the first object.
CONSERVATION OF ENERGY AND THE INCREASE IN DISORDER
[See Content Standard C (grades 9-12)]
-
The total energy of the universe is constant. Energy can be transferred by collisions in chemical and nuclear reactions, by light waves and other radiations, and in many other ways. However, it can never be destroyed. As these transfers occur, the matter involved becomes steadily less ordered.
-
All energy can be considered to be either kinetic energy, which is the energy of motion; potential energy, which depends on relative position; or energy contained by a field, such as electromagnetic waves.
-
Heat consists of random motion and the vibrations of atoms, molecules, and ions. The higher the temperature, the greater the atomic or molecular motion.
-
Everything tends to become less organized and less orderly over time. Thus, in all energy transfers, the overall effect is that the energy is spread out uniformly. Examples are the transfer of energy from hotter to cooler objects by conduction, radiation, or convection and the warming of our surroundings when we burn fuels.
INTERACTIONS OF ENERGY AND MATTER
[See Content Standard D (grades 9-12)]
-
Waves, including sound and seismic waves, waves on water, and light waves, have energy and can transfer energy when they interact with matter.
-
Electromagnetic waves result when a charged object is accelerated or decelerated. Electromagnetic waves include radio waves (the longest wavelength), microwaves, infrared radiation (radiant heat), visible light, ultraviolet radiation, x-rays, and gamma rays. The energy of electromagnetic waves is carried in packets whose magnitude is inversely proportional to the wavelength.
-
Each kind of atom or molecule can gain or lose energy only in particular discrete amounts and thus can absorb and emit
-
In some materials, such as metals, electrons flow easily, whereas in insulating materials such as glass they can hardly flow at all. Semiconducting materials have intermediate behavior. At low temperatures some materials become superconductors and offer no resistance to the flow of electrons.
light only at wavelengths corresponding to these amounts. These wavelengths can be used to identify the substance.
Life Science
Content Standard C
As a result of their activities in grades 9-12, all students should develop understanding of
-
The cell
-
Molecular basis of heredity
-
Biological evolution
-
Interdependence of organisms
-
Matter, energy, and organization in living systems
-
Behavior of organisms
Developing Student Understanding
Students in grades K-8 should have developed a foundational understanding of life sciences. In grades 9-12, students' understanding of biology will expand by incorporating more abstract knowledge, such as the structure and function of DNA, and more comprehensive theories, such as evolution. Students' understandings should encompass scales that are both smaller, for example, molecules, and larger, for example, the biosphere.
Teachers of science will have to make choices about what to teach that will most productively develop student understanding of the life sciences. All too often, the criteria for selection are not clear, resulting in an overemphasis on information and an underemphasis on conceptual understanding. In describing the content for life sciences, the national standards focus on a small number of general principles that can serve as the basis for teachers and students to develop further understanding of biology.
Because molecular biology will continue into the twenty-first century as a major frontier of science, students should understand the chemical basis of life not only for its own sake, but because of the need to take informed positions on some of the practical and ethical implications of humankind's capacity to manipulate living organisms.
In general, students recognize the idea of species as a basis for classifying organisms, but few students will refer to the genetic basis of species. Students may exhibit a general understanding of classification. However, when presented with unique organisms, students sometimes appeal to "everyday" classifications, such as viewing jellyfish as fish because of the term "fish," and penguins as amphibians because they live on land and in water.
Although students may indicate that they know about cells, they may say that living systems are made of cells but not molecules, because students often associate molecules only with physical science.
Students have difficulty with the fundamental concepts of evolution. For example, students often do not understand natural
Fossils
The investigation in this example centers on the use of fossils to develop concepts about variation of characteristics in a population, evolution—including indicators of past environments and changes in those environments, the role of climate in biological adaptation, and use of geological data. High-school students generally exhibit interest in fossils and what the fossils indicate about organisms and their habitats. Fossils can be purchased from scientific supply houses, as well as collected locally in some places. In the investigation described here, the students conduct an inquiry to answer an apparently simple question: Do two slightly different fossils represent an evolutionary trend? In doing the activity, students rely on prior knowledge from life science. They use mathematical knowledge and skill. The focus of the discussion is to explain organized data.
[This example highlights some elements of Teaching Standards A, B, D, and E; 9-12 Content Standards A, C, D and the Unifying Concepts and Processes; and Program Standards A and C.]
The investigation begins with a task that students originally perceive as easy—describing the characteristics of two brachiopods to see if change has occurred. The student inquiries begin when the teacher, Mr. D., gives each student two similar but slightly different fossils and asks the students if they think an evolutionary trend can be discerned. The openness and ambiguity of the question results in mixed responses. Mr. D. asks for a justification of each answer and gently challenges the students' responses by posing questions such as: "How do you know? How could you support your answer? What evidence would you need? What if these fossils were from the same rock formation? How do you know that the differences are not normal variations in this species? What if the two fossils were from rock formations deposited 10 millions years apart? Can you tell if evolution has or has not occurred by examining only two samples?"
Mr. D. shows students two trays, each with about 100 carefully selected fossil brachiopods. He asks the students to describe the fossils. After they have had time to examine the fossils, he hears descriptions such as "They look like butterflies," and "They are kind of triangular with a big middle section and ribs." Then he asks if there are any differences between the fossils in the two trays. The students quickly conclude that they cannot really tell any differences based on the general description, so Mr. D. asks how they could tell if the fossil populations were different. From the ensuing discussion, students determine that quantitative description of specific characteristics, such as length, width, and number of ribs are most helpful.
Mr. D. places the students in groups of four and presents them with two trays of brachiopods. They are told to measure, record, and graph some characteristics of the brachiopod populations. The students decide what they want to measure and how to do it. They work for a class period measuring and entering their data on length and width of the brachiopods in the populations in a computer database. When all data are entered, summarized, and graphed, the class results resemble those displayed in the figure.
The students begin examining the graphs showing frequency distribution of the length and width of fossils. As the figure

Figure 1.
Graph showing characteristics of branchiopod populations.
indicates, the results for either dimension show a continuous variation for the two populations. Students observe that regardless of the dimension measured, the mean for the two populations differs.
After the graphs are drawn, Mr. D. asks the students to explain the differences in the populations. The students suggest several general explanations: evolution has not occurred—these are simply different kinds of brachiopods; evolution has occurred—the differences in the means for length and width demonstrate evolutionary change in the populations; evolution has not occurred—the differences are a result of normal variations in the populations.
Mr. D. takes time to provide some background information that the students should consider. He notes that evolution occurs in populations, and changes in a population's environment result in selection for those organisms best fit for the new environment. He continues with a few questions that again challenge the students' thinking: Did the geological evidence indicate the environment changed? How can you be sure that the fossils were not from different environments and deposited within a scale of time that would not explain the degree of evolutionary change? Why would natural selection for differences in length and width of brachiopods occur? What differences in structure and function are represented in the length and width of brachiopods?
The students must use the evidence from their investigations and other reviews of scientific literature to develop scientific explanations for the aforementioned general explanations. They take the next class period to complete this assignment.
After a day's work by the students on background research and preparation, Mr. D. holds a small conference at which the students' papers are presented and discussed. He focuses students on their ability to ask skeptical questions, evaluate the use of evidence, assess the understanding of geological and biological concepts, and review aspects of scientific inquiries. During the discussions, students are directed to address the following questions: What evidence would you look for that might indicate these brachiopods were the same or different species? What constitutes the same or different species? Were the rocks in which the fossils were deposited formed at the same or different times? How similar or different were the environments of deposition of the rocks? What is the effect of sample size on reliability of conclusions?
selection because they fail to make a conceptual connection between the occurrence of new variations in a population and the potential effect of those variations on the long-term survival of the species. One misconception that teachers may encounter involves students attributing new variations
|
Many misconceptions about the process of natural selection can be changed through instruction. |
to an organism's need, environmental conditions, or use. With some help, students can understand that, in general, mutations occur randomly and are selected because they help some organisms survive and produce more offspring. Other misconceptions center on a lack of understanding of how a population changes as a result of differential reproduction (some individuals producing more offspring), as opposed to all individuals in a population changing. Many misconceptions about the process of natural selection can be changed through instruction.
Guide to the Content Standard
Fundamental concepts and principles that underlie this standard include
THE CELL
[See Unifying Concepts and Processes]
-
Cells have particular structures that underlie their functions. Every cell is surrounded by a membrane that separates it from the outside world. Inside the cell is a concentrated mixture of thousands of different molecules which form a variety of specialized structures that carry out such cell functions as energy production, transport of molecules, waste disposal, synthesis of new molecules, and the storage of genetic material.
-
Most cell functions involve chemical reactions. Food molecules taken into cells react to provide the chemical constituents needed to synthesize other molecules. Both breakdown and synthesis are made possible by a large set of protein catalysts, called enzymes. The breakdown of some of the food molecules enables the cell to store energy in specific chemicals that are used to carry out the many functions of the cell.
-
Cells store and use information to guide their functions. The genetic information stored in DNA is used to direct the synthesis of the thousands of proteins that each cell requires.
-
Cell functions are regulated. Regulation occurs both through changes in the activity of the functions performed by proteins and through the selective expression of individual genes. This regulation allows cells to respond to their environment and to control and coordinate cell growth and division.
-
Plant cells contain chloroplasts, the site of photosynthesis. Plants and many microorganisms use solar energy to combine molecules of carbon dioxide and water into complex, energy rich organic compounds and release oxygen to the environment. This process of photosynthesis provides a vital connection between the sun and the energy needs of living systems.
-
Cells can differentiate, and complex multicellular organisms are formed as a highly organized arrangement of differentiated cells. In the development of
these multicellular organisms, the progeny from a single cell form an embryo in which the cells multiply and differentiate to form the many specialized cells, tissues and organs that comprise the final organism. This differentiation is regulated through the expression of different genes.
THE MOLECULAR BASIS OF HEREDITY
[See Content Standard B (grades 9-12)]
-
In all organisms, the instructions for specifying the characteristics of the organism are carried in DNA, a large polymer formed from subunits of four kinds (A, G, C, and T). The chemical and structural properties of DNA explain how the genetic information that underlies heredity is both encoded in genes (as a string of molecular ''letters") and replicated (by a templating mechanism). Each DNA molecule in a cell forms a single chromosome.
-
Most of the cells in a human contain two copies of each of 22 different chromosomes. In addition, there is a pair of chromosomes that determines sex: a female contains two X chromosomes and a male contains one X and one Y chromosome. Transmission of genetic information to offspring occurs through egg and sperm cells that contain only one representative from each chromosome pair. An egg and a sperm unite to form a new individual. The fact that the human body is formed from cells that contain two copies of each chromosome—and therefore two copies of each gene—explains many features of human heredity, such as how variations that are hidden in one generation can be expressed in the next.
-
Changes in DNA (mutations) occur spontaneously at low rates. Some of these changes make no difference to the organism, whereas others can change cells and organisms. Only mutations in germ cells can create the variation that changes an organism's offspring.
BIOLOGICAL EVOLUTION
[See Unifying Concepts and Processes]
-
Species evolve over time. Evolution is the consequence of the interactions of (1) the potential for a species to increase its numbers, (2) the genetic variability of offspring due to mutation and recombination of genes, (3) a finite supply of the resources required for life, and (4) the ensuring selection by the environment of those offspring better able to survive and leave offspring.
-
The great diversity of organisms is the result of more than 3.5 billion years of evolution that has filled every available niche with life forms.
-
Natural selection and its evolutionary consequences provide a scientific explanation for the fossil record of ancient life forms, as well as for the striking molecular similarities observed among the diverse species of living organisms.
-
The millions of different species of plants, animals, and microorganisms that live on earth today are related by descent from common ancestors.
-
Biological classifications are based on how organisms are related. Organisms are classified into a hierarchy of groups and subgroups based on similarities which reflect their evolutionary relationships. Species is the most fundamental unit of classification.
THE INTERDEPENDENCE OF ORGANISMS
-
The atoms and molecules on the earth cycle among the living and nonliving components of the biosphere.
-
Energy flows through ecosystems in one direction, from photosynthetic organisms to herbivores to carnivores and decomposers.
-
Organisms both cooperate and compete in ecosystems. The interrelationships and interdependencies of these organisms may generate ecosystems that are stable for hundreds or thousands of years.
-
Living organisms have the capacity to produce populations of infinite size, but environments and resources are finite. This fundamental tension has profound effects on the interactions between organisms.
-
Human beings live within the world's ecosystems. Increasingly, humans modify ecosystems as a result of population growth, technology, and consumption. Human destruction of habitats through direct harvesting, pollution, atmospheric changes, and other factors is threatening current global stability, and if not addressed, ecosystems will be irreversibly affected.
MATTER, ENERGY, AND ORGANIZATION IN LIVING SYSTEMS
[See Unifying Concepts and Processes]
-
All matter tends toward more disorganized states. Living systems require a continuous input of energy to maintain their chemical and physical organizations. With death, and the cessation of energy input, living systems rapidly disintegrate.
-
The energy for life primarily derives from the sun. Plants capture energy by absorbing light and using it to form strong (covalent) chemical bonds between the atoms of carbon-containing (organic) molecules. These molecules can be used to assemble larger molecules with biological activity (including proteins, DNA, sugars, and fats). In addition, the energy stored in bonds between the atoms (chemical energy) can be used as sources of energy for life processes.
-
The chemical bonds of food molecules contain energy. Energy is released when the bonds of food molecules are broken and new compounds with lower energy bonds are formed. Cells usually store this energy temporarily in phosphate bonds of a small high-energy compound called ATP.
-
The complexity and organization of organisms accommodates the need for obtaining, transforming, transporting, releasing, and eliminating the matter and energy used to sustain the organism.
-
The distribution and abundance of organisms and populations in ecosystems are limited by the availability of matter and energy and the ability of the ecosystem to recycle materials.
-
As matter and energy flows through different levels of organization of living systems—cells, organs, organisms, communities—and between living systems and the physical environment, chemical elements are recombined in different ways. Each recombination results in storage and dissipation of energy into
the environment as heat. Matter and energy are conserved in each change.
THE BEHAVIOR OF ORGANISMS
-
Multicellular animals have nervous systems that generate behavior. Nervous systems are formed from specialized cells that conduct signals rapidly through the long cell extensions that make up nerves. The nerve cells communicate with each other by secreting specific excitatory and inhibitory molecules. In sense organs, specialized cells detect light, sound, and specific chemicals and enable animals to monitor what is going on in the world around them.
-
Organisms have behavioral responses to internal changes and to external stimuli. Responses to external stimuli can result from interactions with the organism's own species and others, as well as environmental changes; these responses either can be innate or learned. The broad patterns of behavior exhibited by animals have evolved to ensure reproductive success. Animals often live in unpredictable environments, and so their behavior must be flexible enough to deal with uncertainty and change. Plants also respond to stimuli.
-
Like other aspects of an organism's biology, behaviors have evolved through natural selection. Behaviors often have an adaptive logic when viewed in terms of evolutionary principles.
-
Behavioral biology has implications for humans, as it provides links to psychology, sociology, and anthropology.
Earth and Space Science
Content Standard D
As a result of their activities in grades 9-12, all students should develop an understanding of
-
Energy in the earth system
-
Geochemical cycles
-
Origin and evolution of the earth system
-
Origin and evolution of the universe
Developing Student Understanding
During the high school years, students continue studying the earth system introduced in grades 5-8. At grades 9-12, students focus on matter, energy, crustal dynamics, cycles, geochemical processes, and the expanded time scales necessary to understand events in the earth system. Driven by sunlight and earth's internal heat, a variety of cycles connect and continually circulate energy and material through the components of the earth system. Together, these cycles establish the structure of the earth system and regulate earth's climate. In grades 9-12, students review the water cycle as a carrier of material, and deepen their understanding of this key cycle to see that it is also an important agent for energy transfer. Because it plays a central role in establishing and maintaining earth's climate and the production of many mineral and fossil fuel resources, the students' explorations are also directed toward the carbon cycle. Students use and extend their understanding of how
the processes of radiation, convection, and conduction transfer energy through the earth system.
In studying the evolution of the earth system over geologic time, students develop a deeper understanding of the evidence, first introduced in grades 5-8, of earth's past and unravel the interconnected story of earth's dynamic crust, fluctuating climate, and evolving life forms. The students' studies develop the concept of the earth system existing in a state of dynamic equilibrium. They will discover that while certain properties of the earth system may fluctuate on short or long time scales, the earth system will generally stay within a certain narrow range for millions of years. This long-term stability can be understood through the working of planetary geochemical cycles and the feedback processes that help to maintain or modify those cycles.
As an example of this long-term stability, students find that the geologic record suggests that the global temperature has fluctuated within a relatively narrow range, one that has been narrow enough to enable life to survive and evolve for over three billion years. They come to understand that some of the small temperature fluctuations have produced what we perceive as dramatic effects in the earth system, such as the ice ages and the extinction of entire species. They explore the regulation of earth's global temperature by the water and carbon cycles. Using this background, students can examine environmental changes occurring today and make predictions about future temperature fluctuations in the earth system.
Looking outward into deep space and deep time, astronomers have shown that we live in a vast and ancient universe. Scientists assume that the laws of matter are the same in all parts of the universe and over billions
|
. . . as many as half will need concrete examples and considerable help in following the multistep logic necessary to develop the understandings described here. |
of years. It is thus possible to understand the structure and evolution of the universe through laboratory experiments and current observations of events and phenomena in the universe.
Until this grade level, astronomy has been largely restricted to the behavior of objects in the solar system. In grades 9-12, the study of the universe becomes more abstract as students expand their ability to comprehend large distances, long time scales, and the nature of nuclear reactions. The age of the universe and its evolution into galaxies, stars, and planets—and eventually life on earth—fascinates and challenges students.
The challenge of helping students learn the content of this standard will be to present understandable evidence from sources that range over immense timescales—and from studies of the earth's interior to observations from outer space. Many students are capable of doing this kind of thinking, but as many as half will need concrete examples and considerable help in following the multistep logic necessary to develop the understandings described in this standard. Because direct experimentation is usually not possible
for many concepts associated with earth and space science, it is important to maintain the spirit of inquiry by focusing the teaching on questions that can be answered by using observational data, the knowledge base of science, and processes of reasoning.
Guide to the Content Standard
Fundamental concepts and principles that underlie this standard include
ENERGY IN THE EARTH SYSTEM
[See content Standard B (grades 9-12)]
-
Earth systems have internal and external sources of energy, both of which create heat. The sun is the major external source of energy. Two primary sources of internal energy are the decay of radioactive isotopes and the gravitational energy from the earth's original formation.
-
The outward transfer of earth's internal heat drives convection circulation in the mantle that propels the plates comprising earth's surface across the face of the globe.
-
Heating of earth's surface and atmosphere by the sun drives convection within the atmosphere and oceans, producing winds and ocean currents.
-
Global climate is determined by energy transfer from the sun at and near the earth's surface. This energy transfer is influenced by dynamic processes such as cloud cover and the earth's rotation, and static conditions such as the position of mountain ranges and oceans.
GEOCHEMICAL CYCLES
-
The earth is a system containing essentially a fixed amount of each stable chemical atom or element. Each element can exist in several different chemical reservoirs. Each element on earth moves among reservoirs in the solid earth, oceans, atmosphere, and organisms as part of geochemical cycles.
-
Movement of matter between reservoirs is driven by the earth's internal and external sources of energy. These movements are often accompanied by a change in the physical and chemical properties of the matter. Carbon, for example, occurs in carbonate rocks such as limestone, in the atmosphere as carbon dioxide gas, in water as dissolved carbon dioxide, and in all organisms as complex molecules that control the chemistry of life.
|
It is important to maintain the spirit of inquiry by focusing the teaching on questions that can be answered by using observational data, the knowledge base of science, and processes of reasoning. |
THE ORIGIN AND EVOLUTION OF THE EARTH SYSTEM
-
The sun, the earth, and the rest of the solar system formed from a nebular cloud of dust and gas 4.6 billion years ago. The early earth was very different from the planet we live on today.
-
Geologic time can be estimated by observing rock sequences and using fossils to correlate the sequences at various locations. Current methods include using the known decay rates of radioactive isotopes present in rocks to measure the time since the rock was formed.
-
Interactions among the solid earth, the oceans, the atmosphere, and organisms have resulted in the ongoing evolution of
-
Evidence for one-celled forms of life—the bacteria—extends back more than 3.5 billion years. The evolution of life caused dramatic changes in the composition of the earth's atmosphere, which did not originally contain oxygen.
the earth system. We can observe some changes such as earthquakes and volcanic eruptions on a human time scale, but many processes such as mountain building and plate movements take place over hundreds of millions of years.
THE ORIGIN AND EVOLUTION OF THE UNIVERSE
[See Content Standard A (grades 9-12)]
-
The origin of the universe remains one of the greatest questions in science. The "big bang" theory places the origin between 10 and 20 billion years ago, when the universe began in a hot dense state; according to this theory, the universe has been expanding ever since.
-
Early in the history of the universe, matter, primarily the light atoms hydrogen and helium, clumped together by gravitational attraction to form countless trillions of stars. Billions of galaxies, each of which is a gravitationally bound cluster of billions of stars, now form most of the visible mass in the universe.
-
Stars produce energy from nuclear reactions, primarily the fusion of hydrogen to form helium. These and other processes in stars have led to the formation of all the other elements.
Science and Technology
Content Standard E
As a result of activities in grades 9-12, all students should develop
-
Abilities of technological design
-
Understandings about science and technology
Developing Student Abilities and Understanding
This standard has two equally important parts—developing students' abilities of technological design and developing students' understanding about science and technology. Although these are science education standards, the relationship between science and technology is so close that any presentation of science without developing an understanding of technology would portray an inaccurate picture of science.
In the course of solving any problem where students try to meet certain criteria within constraints, they will find that the ideas and methods of science that they know, or can learn, can be powerful aids. Students also find that they need to call on other sources of knowledge and skill, such as cost, risk, and benefit analysis, and aspects of critical thinking and creativity. Learning experiences associated with this standard should include examples of technological achievement in which science has played a part and examples where technological advances contributed directly to scientific progress.
Students can understand and use the design model outlined in this standard. Students respond positively to the concrete,
practical, outcome orientation of design problems before they are able to engage in the abstract, theoretical nature of many scientific inquiries. In general, high school students do not distinguish between the roles of science and technology. Helping them do so is implied by this standard. This lack of distinction between science and technology is further confused by students' positive perceptions of science, as when they associate it with medical research and use the common phrase "scientific progress." However, their association of technology is often with environmental problems and another common phrase, "technological problems." With regard to the connection between science and technology, students as well as many adults and teachers of science indicate a belief that science influences technology. This belief is captured by the common and only partially accurate definition "technology is applied science.'' Few students understand that technology influences science. Unraveling these misconceptions of science and technology and developing accurate concepts of the role, place, limits, possibilities and relationships of science and technology is the challenge of this standard.
The choice of design tasks and related learning activities is an important and difficult part of addressing this standard. In choosing technological learning activities, teachers of science will have to bear in mind some important issues. For example, whether to involve students in a full or partial design problem; or whether to engage them in meeting a need through technology or in studying the technological work of others. Another issue is how to select a task that brings out the various ways in which science and technology interact, providing a basis for reflection on the nature of technology while learning the science concepts involved.
In grades 9-12, design tasks should explore a range of contexts including both those immediately familiar in the homes, school, and community of the students and those from wider regional, national, or global contexts. The tasks should promote different ways to tackle the problems so that different design solutions can be implemented by different students. Successful completion of design problems requires that the students meet criteria while addressing conflicting constraints. Where constructions are involved, these might draw on technical skills and understandings developed within the science program, technical and craft skills developed in other school work, or require developing new skills.
Over the high school years, the tasks should cover a range of needs, of materials, and of different aspects of science. For example, a suitable design problem could include assembling electronic components to control a sequence of operations or analyzing the features of different athletic shoes to see the criteria and constraints imposed by the sport, human anatomy, and materials. Some tasks should involve science ideas drawn from more than one field of science. These can be complex, for example, a machine that incorporates both mechanical and electrical control systems.
Although some experiences in science and technology will emphasize solving problems and meeting needs by focusing on products, experience also should include problems about system design, cost, risk, benefit, and very importantly, tradeoffs.
Because this study of technology occurs within science courses, the number of these activities must be limited. Details specified in this standard are criteria to ensure quality and balance in a small number of tasks and are not meant to require a large number of such activities. Many abilities and understandings of this standard can be developed as part of activities designed for other content standards.
Guide to the Content Standard
Fundamental abilities and concepts that underlie this standard include
ABILITIES OF TECHNOLOGICAL DESIGN
[See Content Standard A (grades 9-12)]
IDENTIFY A PROBLEM OR DESIGN AN OPPORTUNITY. Students should be able to identify new problems or needs and to change and improve current technological designs.
PROPOSE DESIGNS AND CHOOSE BETWEEN ALTERNATIVE SOLUTIONS. Students should demonstrate thoughtful planning for a piece of technology or technique. Students should be introduced to the roles of models and simulations in these processes.
IMPLEMENT A PROPOSED SOLUTION. A variety of skills can be needed in proposing a solution depending on the type of technology that is involved. The construction of artifacts can require the skills of cutting, shaping, treating, and joining common materials—such as wood, metal, plastics, and textiles. Solutions can also be implemented using computer software.
EVALUATE THE SOLUTION AND ITS CONSEQUENCES. Students should test any solution against the needs and criteria it was designed to meet. At this stage, new criteria not originally considered may be reviewed.
[See Teaching Standard B]
COMMUNICATE THE PROBLEM, PROCESS, AND SOLUTION. Students should present their results to students, teachers, and others in a variety of ways, such as orally, in writing, and in other forms—including models, diagrams, and demonstrations.
UNDERSTANDINGS ABOUT SCIENCE AND TECHNOLOGY
-
Scientists in different disciplines ask different questions, use different methods of investigation, and accept different types of evidence to support their explanations. Many scientific investigations require the contributions of individuals from different disciplines, including engineering. New disciplines of science, such as geophysics and biochemistry often emerge at the interface of two older disciplines.
-
Science often advances with the introduction of new technologies. Solving technological problems often results in new scientific knowledge. New technologies often extend the current levels of scientific understanding and introduce new areas of research.
-
Creativity, imagination, and a good knowledge base are all required in the work of science and engineering.
-
Science and technology are pursued for different purposes. Scientific inquiry is driven by the desire to understand the natural world, and technological design is driven by the need to meet human needs and solve human problems. Technology, by its nature, has a more direct effect on society than science because its purpose is to solve human problems, help humans
-
Technological knowledge is often not made public because of patents and the financial potential of the idea or invention. Scientific knowledge is made public through presentations at professional meetings and publications in scientific journals.
adapt, and fulfill human aspirations. Technological solutions may create new problems. Science, by its nature, answers questions that may or may not directly influence humans. Sometimes scientific advances challenge people's beliefs and practical explanations concerning various aspects of the world.
Science in Personal and Social Perspectives
Content Standard F
As a result of activities in grades 9-12, all students should develop understanding of
-
Personal and community health
-
Population growth
-
Natural resources
-
Environmental quality
-
Natural and human-induced hazards
-
Science and technology in local, national, and global challenges
Developing Student Understanding
The organizing principles for this standard do not identify specific personal and societal challenges, rather they form a set of conceptual organizers, fundamental understandings, and implied actions for most contemporary issues. The organizing principles apply to local as well as global phenomena and represent challenges that occur on scales that vary from quite short—for example, natural hazards—to very long—for example, the potential result of global changes.
By grades 9-12, many students have a fairly sound understanding of the overall functioning of some human systems, such
|
The organizing principles apply to local as well as global phenomena. |
as the digestive, respiratory, and circulatory systems. They might not have a clear understanding of others, such as the human nervous, endocrine, and immune systems. Therefore, students may have difficulty with specific mechanisms and processes related to health issues.
Most high school students have a concept of populations of organisms, but they have a poorly developed understanding of the relationships among populations within a community and connections between populations and other ideas such as competition for resources. Few students understand and apply the idea of interdependence when considering interactions among populations, environments, and resources. If, for example, students are asked about the size of populations and why some populations would be larger, they often simply describe rather than reason about interdependence or energy flow.
Students may exhibit a general idea of cycling matter in ecosystems, but they may center on short chains of the cyclical process
Photosynthesis
In this example, Ms. M. believes that her understanding of the history of scientific ideas enriches her understanding of the nature of scientific inquiry. She also wants the students to understand how ideas in science develop, change, and are influenced by values, ideas, and resources prevalent in society at any given time. She uses an historical approach to introduce an important concept in life science. She provokes an interest in the topic by purposely showing an overhead beyond what is developmentally appropriate for high-school students. Her lecture is interrupted with questions that encourage discussion among students. The research activity, primarily using print material which she has been collecting for a long time, includes discussion. The questions about factors that might influence contemporary research return the students to issues that are of immediate concern to them.
[This example highlights some elements of Teaching Standards A and B; 9–12 Content Standards A, C, F and G; and Program Standard B.]
Ms. M. was beginning the second round of planning for the high-school biology class. She had set aside three weeks for a unit on green plants. Now it was time to decide what would happen during those three weeks. Students came to the class with some knowledge and understanding about green plants, but they still had many questions. As a way to get students to focus some of their questions, and to highlight the interdependence of science and civilization, she was going to begin the unit with a lecture on photosynthesis. Lecturing was something she seldom did. However, the purpose here was not to lay out the details of the photosynthetic process, but to illustrate how the scientific community's knowledge of photosynthesis had changed over time.
She would begin the lecture by putting a transparency on the overhead projector of that detailed diagram of photosynthesis which had been sent to her free from one of the pharmaceutical companies. One of the high-school textbooks that she kept as a reference said that scientists now had described 80 separate but interdependent reactions that made up photosynthesis. The high-school students would not study these reactions. Rather, she wanted the students to observe the complexity of the current knowledge about photosynthesis, and this diagram was a useful introduction to her lecture. She would ask the students how long the scientific community had known about these many complex reactions; why this knowledge was important; how they had come to know so much; was there still more detail to be described?
Next she would ask the students to tell her what they already knew about photosynthesis. She expected most would recall that carbon dioxide, water, sugar, oxygen and sunlight were important and many would recall growing plants in dark cupboards and under boxes in middle school. The next two questions would have to be worded carefully: Why is photosynthesis so important or, put another way, what is the fundamental question that photosynthesis answers? And how long have scientists known about photosynthesis?
With this introduction, she would lecture about the seventeenth century experiment of
van Helmont and his tree and his conclusion that the weight of the plants came from water. Ms. M. would pause. "Was van Helmont wrong?", she would ask the students. She expected them to have difficulty conceiving that van Helmont had conducted an experiment, which they knew was essential to science, but that he had not obtained the answer they knew was correct. Ms. M. would help them analyze the experiment and the conclusions that could legitimately be drawn from it. She would then introduce more of the context of van Helmont's investigation: the prevailing belief about plants as a combination of fire and earth and how van Helmont's study was designed to refute this belief. She would comment that many researchers chose to repeat the tree study, and then she would allow students to discuss how (or whether) van Helmont's study had contributed to the science of photosynthesis.
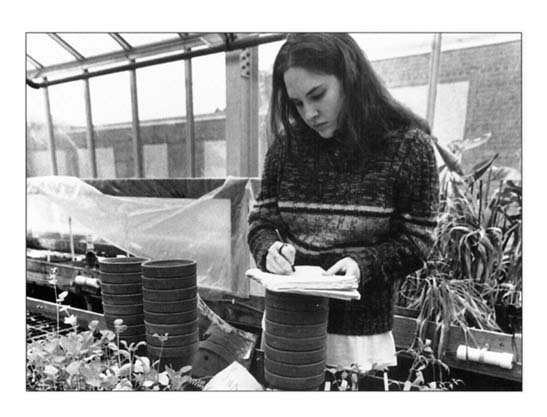
She would then continue her historical lecture using similar details from several other episodes. She would describe how chemists had learned to collect gases from chemical reactions, how Priestley used these new techniques, and how he then observed the effect that gases from plants produced on burning candles. She would note that Priestley did not know about oxygen, but viewed it as a purer form of air. She would mention how Ingenhousz expanded Priestley's finding by showing that the air was changed only when the plants were kept in sunlight, and how de Saussure confirmed that carbon dioxide was a gas needed for the same effect. She would detail how James Hutton had been involved in industrial debates about the quality of coal and was interested in why coal burned. He had interpreted plant imprints in coal as a clue that something from the sun was being stored in
plants and then fossilized as coal. The "something" would later be released again as light and heat as the coal burned. But Hutton had no concept of chemical or light energy—concepts introduced only decades later by Julius Mayer. Ms. M. would stop her history here. Students would review how various factors had shaped the development of early knowledge about photosynthesis. She would record and organize their views on the chalkboard. From this they would develop a set of questions for continuing the history on their own.
Ms. M. had collected a number of textbooks from different periods in the century. She would introduce them as a resource for sketching the changing status of knowledge about photosynthesis. She would have the students work in groups of five. Each group would prepare a brief presentation on ideas of photosynthesis during a particular historical period. After two days to gather information, each group would share the result of their research and together they would identify or infer what discoveries had been made in each period. Then, using the questions they had formulated earlier, the students would return to their groups to determine how each discovery had occurred. They would identify factors such as new technologies that were relevant to conducting investigations, the sources of funding for various research projects, the personal interests of researchers, occasions of luck or chance, and the theories that had guided research. Finally, each group would share two patterns that they had uncovered and how they had reached their conclusion.
Through this activity, students would come to realize that scientific understanding does not emerge all at once or fully formed. Further, the students recognized that each new concept reflected the personal backgrounds, time, and place of its discoverers. At the very end of the period Ms. M would ask the students to speculate on what scientists might ask about photosynthesis today or in the future, and what factors might shape their research.
and express the misconception that matter is created and destroyed at each step of the cycle rather than undergoing continuous transformation. Instruction using charts of the flow of matter through an ecosystem and emphasizing the reasoning involved with the entire process may enable students to develop more accurate conceptions.
Many high-school students hold the view that science should inform society about various issues and society should set policy about what research is important. In general, students have rather simple and naive ideas about the interactions between science and society. There is some research supporting the idea that S-T-S (science, technology, and society) curriculum helps improve student understanding of various aspects of science- and technology-related societal challenges.
Guide to the Content Standard
Fundamental concepts and principles that underlie this standard include
PERSONAL AND COMMUNITY HEALTH
[See Content Standard C (grades 9-12)]
-
Hazards and the potential for accidents exist. Regardless of the environment, the possibility of injury, illness, disability, or death may be present. Humans have a variety of mechanisms—sensory, motor, emotional, social, and technological—that can reduce and modify hazards.
-
The severity of disease symptoms is dependent on many factors, such as human resistance and the virulence of the disease-producing organism. Many diseases can be prevented, controlled, or cured. Some diseases, such as cancer, result from specific body dysfunctions and cannot be transmitted.
-
Personal choice concerning fitness and health involves multiple factors. Personal goals, peer and social pressures, ethnic and religious beliefs, and understanding of biological consequences can all influence decisions about health practices.
-
An individual's mood and behavior may be modified by substances. The modification may be beneficial or detrimental depending on the motives, type of substance, duration of use, pattern of use, level of influence, and short- and long-term effects. Students should understand that drugs can result in physical dependence and can increase the risk of injury, accidents, and death.
-
Selection of foods and eating patterns determine nutritional balance. Nutritional balance has a direct effect on growth and development and personal well-being. Personal and social factors—such as habits, family income, ethnic heritage, body size, advertising, and peer pressure—influence nutritional choices.
-
Families serve basic health needs, especially for young children. Regardless of the family structure, individuals have families that involve a variety of physical, mental, and social relationships that influence the maintenance and improvement of health.
-
Sexuality is basic to the physical, mental, and social development of humans. Students should understand that human sexuality involves biological functions, psychological motives, and cultural, ethnic, religious, and technological influences. Sex
is a basic and powerful force that has consequences to individuals' health and to society. Students should understand various methods of controlling the reproduction process and that each method has a different type of effectiveness and different health and social consequences.
POPULATION GROWTH
-
Populations grow or decline through the combined effects of births and deaths, and through emigration and immigration. Populations can increase through linear or exponential growth, with effects on resource use and environmental pollution.
-
Various factors influence birth rates and fertility rates, such as average levels of affluence and education, importance of children in the labor force, education and employment of women, infant mortality rates, costs of raising children, availability and reliability of birth control methods, and religious beliefs and cultural norms that influence personal decisions about family size.
-
Populations can reach limits to growth. Carrying capacity is the maximum number of individuals that can be supported in a given environment. The limitation is not the availability of space, but the number of people in relation to resources and the capacity of earth systems to support human beings. Changes in technology can cause significant changes, either positive or negative, in carrying capacity.
NATURAL RESOURCES
-
Human populations use resources in the environment in order to maintain and improve their existence. Natural resources have been and will continue to be used to maintain human populations.
-
The earth does not have infinite resources; increasing human consumption places severe stress on the natural processes that renew some resources, and it depletes those resources that cannot be renewed.
-
Humans use many natural systems as resources. Natural systems have the capacity to reuse waste, but that capacity is limited. Natural systems can change to an extent that exceeds the limits of organisms to adapt naturally or humans to adapt technologically.
ENVIRONMENTAL QUALITY
[See Content Standard C (grades 9-12)]
-
Natural ecosystems provide an array of basic processes that affect humans. Those processes include maintenance of the quality of the atmosphere, generation of soils, control of the hydrologic cycle, disposal of wastes, and recycling of nutrients. Humans are changing many of these basic processes, and the changes may be detrimental to humans.
-
Materials from human societies affect both physical and chemical cycles of the earth.
-
Many factors influence environmental quality. Factors that students might investigate include population growth, resource use, population distribution, overconsumption, the capacity of technology to solve problems, poverty, the role of economic, political, and religious views, and different ways humans view the earth.
NATURAL AND HUMAN-INDUCED HAZARDS
[See Content Standard D (grades 9-12)]
-
Normal adjustments of earth may be hazardous for humans. Humans live at the interface between the atmosphere driven
-
Human activities can enhance potential for hazards. Acquisition of resources, urban growth, and waste disposal can accelerate rates of natural change.
-
Some hazards, such as earthquakes, volcanic eruptions, and severe weather, are rapid and spectacular. But there are slow and progressive changes that also result in problems for individuals and societies. For example, change in stream channel position, erosion of bridge foundations, sedimentation in lakes and harbors, coastal erosions, and continuing erosion and wasting of soil and landscapes can all negatively affect society.
-
Natural and human-induced hazards present the need for humans to assess potential danger and risk. Many changes in the environment designed by humans bring benefits to society, as well as cause risks. Students should understand the costs and trade-offs of various hazards—ranging from those with minor risk to a few people to major catastrophes with major risk to many people. The scale of events and the accuracy with which scientists and engineers can (and cannot) predict events are important considerations.
by solar energy and the upper mantle where convection creates changes in the earth's solid crust. As societies have grown, become stable, and come to value aspects of the environment, vulnerability to natural processes of change has increased.
SCIENCE AND TECHNOLOGY IN LOCAL, NATIONAL, AND GLOBAL CHALLENGES
[See Content Standard E (grades 9-12)]
-
Science and technology are essential social enterprises, but alone they can only indicate what can happen, not what should happen. The latter involves human decisions about the use of knowledge.
-
Understanding basic concepts and principles of science and technology should precede active debate about the economics, policies, politics, and ethics of various science- and technology-related challenges. However, understanding science alone will not resolve local, national, or global challenges.
-
Progress in science and technology can be affected by social issues and challenges. Funding priorities for specific health problems serve as examples of ways that social issues influence science and technology.
-
Individuals and society must decide on proposals involving new research and the introduction of new technologies into society. Decisions involve assessment of alternatives, risks, costs, and benefits and consideration of who benefits and who suffers, who pays and gains, and what the risks are and who bears them. Students should understand the appropriateness and value of basic questions—"What can happen?"—"What are the odds?"—and ''How do scientists and engineers know what will happen?"
-
Humans have a major effect on other species. For example, the influence of humans on other organisms occurs through land use—which decreases space available to other species—and pollution—which changes the chemical composition of air, soil, and water.
History and Nature of Science
Content Standard G
As a result of activities in grades 9-12, all students should develop understanding of
-
Science as a human endeavor
-
Nature of scientific knowledge
-
Historical perspectives
Developing Student Understanding
The National Science Education Standards use history to elaborate various aspects of scientific inquiry, the nature of science, and science in different historical and cultural perspectives. The standards on the history and nature of science are closely aligned with the nature of science and historical episodes described in the American Association for the Advancement of Science Benchmarks for Science Literacy. Teachers
Scientists value peer review, truthful reporting about the methods and outcomes of investigations, and making public the results of work.
of science can incorporate other historical examples that may accommodate different interests, topics, disciplines, and cultures—as the intention of the standard is to develop an understanding of the human dimensions of science, the nature of scientific knowledge, and the enterprise of science in society—and not to develop a comprehensive understanding of history.
Little research has been reported on the use of history in teaching about the nature of science. But learning about the history of science might help students to improve their general understanding of science. Teachers should be sensitive to the students' lack of knowledge and perspective on time, duration, and succession when it comes to historical study. High school students may have difficulties understanding the views of historical figures. For example, students may think of historical figures as inferior because they did not understand what we do today. This "Whiggish perspective" seems to hold for some students with regard to scientists whose theories have been displaced.
Guide to the Content Standard
Fundamental concepts and principles that underlie this standard include
SCIENCE AS A HUMAN ENDEAVOR
-
Individuals and teams have contributed and will continue to contribute to the scientific enterprise. Doing science or engineering can be as simple as an individual conducting field studies or as complex as hundreds of people working on a major scientific question or technological problem. Pursuing science as a career or as a hobby can be both fascinating and intellectually rewarding.
-
Scientists have ethical traditions. Scientists value peer review, truthful reporting about the methods and outcomes of investigations, and making
-
Scientists are influenced by societal, cultural, and personal beliefs and ways of viewing the world. Science is not separate from society but rather science is a part of society.
public the results of work. Violations of such norms do occur, but scientists responsible for such violations are censured by their peers.
NATURE OF SCIENTIFIC KNOWLEDGE
-
c, as scientists strive for the best possible explanations about the natural world.
-
Scientific explanations must meet certain criteria. First and foremost, they must be consistent with experimental and observational evidence about nature, and must make accurate predictions, when appropriate, about systems being studied. They should also be logical, respect the rules of evidence, be open to criticism, report methods and procedures, and make knowledge public. Explanations on how the natural world changes based on myths, personal beliefs, religious values, mystical inspiration, superstition, or authority may be personally useful and socially relevant, but they are not scientific.
-
Because all scientific ideas depend on experimental and observational confirmation, all scientific knowledge is, in principle, subject to change as new evidence becomes available. The core ideas of science such as the conservation of energy or the laws of motion have been subjected to a wide variety of confirmations and are therefore unlikely to change in the areas in which they have been tested. In areas where data or understanding
|
Science distinguishes itself from other ways of knowing and from other bodies of knowledge through the use of empirical standards, logical arguments, and skepticism. |
-
are incomplete, such as the details of human evolution or questions surrounding global warming, new data may well lead to changes in current ideas or resolve current conflicts. In situations where information is still fragmentary, it is normal for scientific ideas to be incomplete, but this is also where the opportunity for making advances may be greatest.
HISTORICAL PERSPECTIVES
-
In history, diverse cultures have contributed scientific knowledge and technologic inventions. Modern science began to evolve rapidly in Europe several hundred years ago. During the past two centuries, it has contributed significantly to the industrialization of Western and non-Western cultures. However, other, non-European cultures have developed scientific ideas and solved human problems through technology.
-
Usually, changes in science occur as small modifications in extant knowledge. The daily work of science and engineering results in incremental advances in our understanding of the world and our
An Analysis of a Scientific Inquiry
By the "header titles" this example emphasizes some important components of the assessment process. Any boundary between assessment and teaching is lost in this example. Students engage in an analytic activity that requires them to use their understanding of all the science content standards. The activity assumes that they have maintained journals throughout their high school career and have had much previous experience with analyzing scientific inquiry. It would be unreasonable to expect them to successfully complete such an analysis without prior experience. The assessment task requires the use of criteria developed by the class and the teacher together for self assessment and peer assessment. Students may elect to improve the analysis or do another. The teacher uses the data to decide what further inquiries, analyses, or evaluations students might do.
[This example highlights Teaching Standards A, C, and E; Assessments Standards A, B, and E; and 9-12 Content Standard G.]
SCIENCE CONTENT: This activity focuses on all aspects of the Content Standard on the History and Nature of Science: Science as a human endeavor, nature of scientific knowledge, and historical perspectives on science.
ASSESSMENT ACTIVITY: Students read an account of an historical or contemporary scientific study and report on it.
ASSESSMENT TYPE: Performance, individual, group, public.
ASSESSMENT PURPOSE: The teacher uses the information gathered in this activity for assigning grades and for planning further activities involving analysis or inquiry.
DATA: Students' individual reports; student reviews of their peers' work; and teacher's observations.
CONTEXT: This assessment activity is appropriate at the end of 12th grade. Throughout the high school science program, students have read accounts of scientific studies and the social context in which the studies were conducted. Students sometimes read the scientist's own account of the investigation and sometimes an account of the investigation written by another person. The earlier the investigation, the more likely that the high school students are able to read and understand the scientist's original account. Reports by scientists on contemporary studies are likely to be too technical for students to understand, but accounts in popular science books or magazines should be accessible to high school students. Examples of contemporary and historical accounts appropriate to this activity include
Goodfield's An Imagined World
Weiner's The Beak of the Finch
Watson's The Double Helix
Darwin's Voyage of the Beagle
Project Physics Readers
In each student's science journal are notes on his or her own inquiries and the inquiries read about throughout the school science career, including an analysis of historical context in which the study was conducted. After completing each analysis, the science teacher had reviewed and commented on the analysis as well as on the student's developing sophis
tication in doing analysis. Questions that guided each student's analysis include
What factors—personal, technological, cultural, and/or scientific—led this person to the investigation?
How was the investigation designed and why was it designed as it was?
What data did the investigator collect?
How did the investigator interpret the data?
How were the investigator's conclusions related to the design of the investigation and to major theoretical or cultural assumptions, if any?
How did the investigator try to persuade others? Were the ideas accepted by contemporaries? Are they accepted today? Why or why not?
How did the results of this investigation influence the investigator, fellow investigators, and society more broadly?
Were there ethical dimensions to this investigation? If so, how were they resolved?
What element of this episode seems to you most characteristic or most revealing about the process of science? Why?
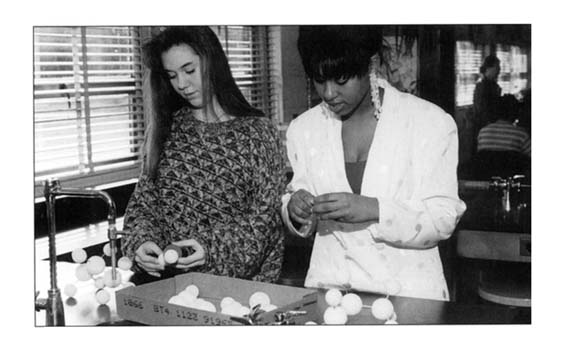
ASSESSMENT EXERCISE
Each student in the class selects an account of one scientific investigation and analyzes it using the questions above. When the analyses are completed, they are handed in to the teacher who passes them out to other members of the class for peer review. Prior to the peer reviews, the teacher and the class have reviewed the framework for analysis and established criteria for evaluating the quality of the analyses. The teacher reviews the peer reviews and, if appropriate, returns them to the author. The author will have the opportunity to revise the analysis on the basis of the peer review before submitting it to the teacher for a grade.
EVALUATION OF STUDENT RESPONSES
The teacher's grade will be based both on the student's progress in conducting such analyses and on how well the analysis meets the criteria set by the teacher in consultation with the class.
-
Occasionally, there are advances in science and technology that have important and long-lasting effects on science and society. Examples of such advances include the following
Copernican revolution
Newtonian mechanics
Relativity
Geologic time scale
Plate tectonics
Atomic theory
Nuclear physics
Biological evolution
Germ theory
Industrial revolution
Molecular biology
Information and communication
Quantum theory
Galactic universe
Medical and health technology
-
The historical perspective of scientific explanations demonstrates how scientific knowledge changes by evolving over time, almost always building on earlier knowledge.
ability to meet human needs and aspirations. Much can be learned about the internal workings of science and the nature of science from study of individual scientists, their daily work, and their efforts to advance scientific knowledge in their area of study.
References for Further Reading
Science as Inquiry
AAAS (American Association for the Advancement of Science). 1993. Benchmarks for Science Literacy. New York: Oxford University Press.
AAAS (American Association for the Advancement of Science). 1989. Science for All Americans: A Project 2061 Report on Literacy Goals in Science, Mathematics, and Technology. Washington DC.: AAAS.
Bechtel, W. 1988. Philosophy of Science: An Overview for Cognitive Science. Hillsdale, NJ: Lawrence Earlbaum.
Bingman, R. 1969. Inquiry Objectives in the Teaching of Biology. Boulder, CO and Kansas City, MO: Biological Sciences Curriculum Study and Mid-Continent Regional Educational Laboratory.
Carey, S., R. Evans, M. Honda, E. Jay, and C. Unger. 1989. An experiment is when you try it and see if it works: A study of grade 7 students' understanding of the construction of scientific knowledge. International Journal of Science Education, 11(5): 514-529.
Chinn, C.A., and W. F. Brewer. 1993. The role of anomalous data in knowledge acquisition: A theoretical framework and implications for science instruction. Review of Educational Research, 63(1): 1-49.
Connelly, F.M., M. W. Wahlstrom, M. Finegold, and F. Elbaz. 1977. Enquiry Teaching in Science: A Handbook for Secondary School Teachers. Toronto, Ontario: Ontario Institute for Studies in Education.
Driver, R. 1989. Students' conceptions and the learning of science: Introduction. International Journal of Science Education, 11(5): 481-490.
Duschl, R.A. 1990. Restructuring Science Education: The Importance of Theories and Their Development. New York: Teachers College Press.
Duschl, R.A., and R.J. Hamilton, eds. 1992. Philosophy of Science, Cognitive Psychology, and Educational Theory and Practice. Albany, NY: State University of New York Press.
Glaser, R. 1984. Education and thinking: The role of knowledge. American Psychologist, 39(2): 93-104.
Grosslight, L., C. Unger, E. Jay, and C.L. Smith. 1991. Understanding models and their use in science: Conceptions of middle and high school students and experts. [Special issue] Journal of Research in Science Teaching, 28(9): 799-822.
Hewson, P.W., and N.R. Thorley. 1989. The conditions of conceptual change in the classroom. International Journal of Science Education, 11(5): 541-553.
Hodson, D. 1992. Assessment of practical work: Some considerations in philosophy of science. Science & Education, 1(2): 115-134.
Hodson, D. 1985. Philosophy of science, science and science education. Studies in Science Education, 12: 25-57.
Kyle, W. C. Jr. 1980. The distinction between inquiry and scientific inquiry and why high school students should be cognizant of the distinction. Journal of Research in Science Teaching, 17(2): 123-130.
Longino, H.E. 1990. Science as Social Knowledge: Values and Objectivity in Scientific Inquiry. Princeton, NJ: Princeton University Press.
Mayer, W.V., ed. 1978. BSCS Biology Teachers' Handbook, third edition. New York: John Wiley and Sons.
Metz, K.E. 1991. Development of explanation: Incremental and fundamental change in children's physics knowledge. [Special issue] Journal of Research in Science Teaching, 28(9): 785-797.
NRC (National Research Council). 1988. Improving Indicators of the Quality of Science and Mathematics Education in Grades K-12. R.J. Murnane, and S.A. Raizen, eds. Washington, DC: National Academy Press.
NSRC (National Science Resources Center). 1996. Resources for Teaching Elementary School Science. Washington, DC: National Academy Press.
Ohlsson, S. 1992. The cognitive skill of theory articulation: A neglected aspect of science education . Science & Education, 1(2): 181-192.
Roth, K.J. 1989. Science education: It's not enough to 'do' or 'relate.' The American Educator, 13(4): 16-22; 46-48.
Rutherford, F.J. 1964. The role of inquiry in science teaching. Journal of Research in Science Teaching, 2: 80-84.
Schauble, L., L.E. Klopfer, and K. Raghavan. 1991. Students' transition from an engineering model to a science model of experimentation. [Special issue] Journal of Research in Science Teaching, 28(9): 859-882.
Schwab, J.J. 1958. The teaching of science as inquiry. Bulletin of the Atomic Scientists, 14: 374-379.
Schwab, J.J. 1964. The teaching of science as enquiry. In The Teaching of Science, J.J. Schwab and P.F. Brandwein, eds.: 3-103. Cambridge, MA: Harvard University Press.
Welch, W.W., L.E. Klopfer, G.S. Aikenhead, and J.T. Robinson. 1981. The role of inquiry in science education: Analysis and recommendations. Science Education, 65(1): 33-50.
Physical Science, Life Science, and Earth and Space Science
AAAS (American Association for the Advancement of Science). 1993. Benchmarks for Science Literacy. New York: Oxford University Press.
AAAS (American Association for the Advancement of Science). 1989. Science for All Americans: A Project 2061 Report on Literacy Goals in Science, Mathematics, and Technology. Washington, DC: AAAS.
Driver, R., A. Squires, P. Rushworth, and V. Wood-Robinson. 1994. Making Sense of Secondary Science: Research into Children's Ideas. London: Routledge.
Driver, R., E. Guesne, and A. Tiberghien, eds. 1985. Children's Ideas in Science. Philadelphia, PA.: Open University Press.
Fensham, P. J., R. F. Gunstone, and R. T. White, eds. 1994. The Content of Science: A Constructivist Approach to Its Teaching and Learning. Bristol, PA: Falmer Press.
Harlen, W. 1988. The Teaching of Science. London: Fulton.
NSTA (National Science Teachers Association). 1992. Scope, Sequence, Coordination. The Content Core: A Guide for Curriculum Designers. Washington, DC: NSTA.
Osborne, R.J., and P. Freyberg. 1985. Learning in Science: The Implications of 'Children's Science.' New Zealand: Heinemann.
Physical Science
AAPT (American Association of Physics Teachers). 1988. Course Content in High School Physics. High School Physics: Views from AAPT. College Park, MD: AAPT.
AAPT (American Association of Physics Teachers). 1986. Guidelines for High School Physics Programs. Washington, DC: AAPT.
ACS (American Chemical Society). 1996. FACETS Foundations and Challenges to Encourage Technology-based Science. Dubuque, Iowa: Kendall/Hunt.
ACS (American Chemical Society). 1993. ChemCom: Chemistry in the Community, second ed. Dubuque, Iowa: Kendall/Hunt.
Life Science
BSCS (Biological Sciences Curriculum Study). 1993. Developing Biological Literacy: A Guide to Developing Secondary and Post-Secondary Biology Curricula. Colorado Springs, CO: BSCS.
Jacob, F. 1982. The Possible and the Actual. Seattle: University of Washington Press.
Medawar, P.B., and J.S. Medawar. 1977. The Life Science: Current Ideas of Biology. New York: Harper and Row.
Moore, J.A. 1993. Science as a Way of Knowing: The Foundations of Modern Biology. Cambridge, MA: Harvard University Press.
Morowitz, H.J. 1979. Biological Generalizations and Equilibrium Organic Chemistry. In Energy Flow in Biology: Biological Organization as a Problem in Thermal Physics. Woodbridge, CT: Oxbow Press.
NRC (National Research Council). 1990. Fulfilling the Promise: Biology Education in Our Nation's Schools. Washington, DC: National Academy Press.
NRC (National Research Council). 1989. High-School Biology Today and Tomorrow. Washington, DC: National Academy Press.
Earth and Space Science
AGI (American Geological Institute). 1991. Earth Science Content Guidelines Grades K-12. Alexandria, VA: AGI.
AGI (American Geological Institute). 1991. Earth Science Education for the 21st Century: A Planning Guide. Alexandria, VA: AGI.
NRC (National Research Council). 1993. Solid-Earth Sciences and Society: A Critical Assessment. Washington, DC: National Academy Press.
Science and Technology
AAAS (American Association for the Advancement of Science). 1993. Benchmarks for Science Literacy. New York: Oxford University Press.
AAAS (American Association for the Advancement of Science). 1989. Science for All Americans: A Project 2061 Report on Literacy Goals in Science, Mathematics, and Technology. New York: Oxford University Press.
Johnson, J. 1989. Technology: A Report of the Project 2061 Phase I Technology Panel. Washington, DC: American Association for the Advancement of Science.
Selby, C.C. 1993. Technology: From myths to realities. Phi Delta Kappan, 74(9): 684-689.
Science in Personal and Social Perspectives
AAAS (American Association for the Advancement of Science). 1993. Benchmarks for Science Literacy. New York: Oxford University Press.
Gore, A. 1992. Earth in the Balance: Ecology and the Human Spirit. Boston: Houghton Mifflin.
Meadows, D.H., D.L. Meadows, and J. Randers. 1992. Beyond the Limits: Confronting Global Collapse, Envisioning a Sustainable Future. Post Mills, VT: Chelsea Green.
Miller, G.T. 1992. Living in the Environment: An Introduction to Environmental Science, 7th ed. Belmont, CA: Wadsworth.
Moore, J. 1985. Science as a Way of Knowing II: Human Ecology. Baltimore, MD: American Society of Zoologists.
NRC (National Research Council). 1993. Solid-Earth Sciences and Society. Washington, DC: National Academy Press.
Silver, C.S., and R.S. DeFries. 1990. One Earth, One Future: Our Changing Global Environment. Washington, DC: National Academy Press.
History and Nature of Science
In addition to references for Science as Inquiry, the following references are suggested.
AAAS (American Association for the Advancement of Science). 1993. Benchmarks for Science Literacy. New York: Oxford University Press.
Bakker, G., and L. Clark. 1988. Explanation: An Introduction to the Philosophy of Science. Mountain View, CA: Mayfield.
Cohen, I.B. 1985. Revolution in Science. Cambridge, MA: The Belknap Press of Harvard University Press.
Hacking, I. 1983. Representing and Intervening: Introductory Topics in the Philosophy of Natural Science. New York: Cambridge University Press.
Hoyingen-Huene, P. 1987. Context of discovery and context of justification. Studies in History and Philosophy of Science, 18(4): 501-515.
Klopfer, L. 1992. A historical perspective on the history and nature of science on school science programs. In Teaching About the History and Nature of Science and Technology: Background Papers, Biological Sciences Curriculum Study and Social Science Education Consortium: 105-129. Colorado Springs, CO: Biological Sciences Curriculum Study.
Machamer, P. 1992. Philosophy of science: An overview for educators. In Teaching About the History and Nature of Science and Technology: Background Papers, Biological Sciences Curriculum Study and Social Science Education Consortium: 9-17. Colorado Springs, CO: Biological Sciences Curriculum Study.
Malley, M. 1992. The Nature and History of Science. In Teaching About the History and Nature of Science and Technology: Background Papers, Biological Sciences Curriculum Study and Social Science Education Consortium: 67-79. Colorado Springs, CO: Biological Sciences Curriculum Study.
Moore, J.A. 1993. Science as a Way of Knowing: The Foundations of Modern Biology. Cambridge, MA.: Harvard University Press.
NRC (National Research Council). 1995. On Being a Scientist: Responsible Conduct in Research. 2nd ed. Washington, DC: National Academy Press.
Russell, T.L. 1981. What history of science, how much, and why? Science Education 65 (1): 51-64.