Chapter 7
Science Education Program Standards
The program standards are criteria for the quality of and conditions for school science programs. They focus on issues at the school and district levels that relate to opportunities for students to learn and opportunities for teachers to teach science.
The first three standards provide criteria to be used in making judgments about the quality of the K-12 science program. Those standards are directed at individuals and groups responsible for the design, development, selection, and adaptation of science programs. People involved include teachers, department chairs, curriculum directors, administrators, publishers, and school committees. Each school and district must translate the standards into programs that are consistent with the content, teaching, and assessment standards, as well as reflect the context and policies of the local district. Because the content standards outline what students should know, understand, and be able to
do without describing the organization of the program of study, program standards A, B, and C focus on criteria for the design of the program, course of study, and curriculum. In contrast, standards D, E, and F describe the conditions necessary to implement a comprehensive program that provides appropriate opportunities for all students to learn science.
The Standards
The program standards are rooted in the assumptions that thoughtful design and implementation of science programs at the school and district levels are necessary to provide comprehensive and coordinated experiences for all students across grade levels, and that coordinated experiences result in more effective learning. But a balance must be maintained. To the extent that district and school policies and consequent decisions provide guidance, support, and coordination among teachers, they can enhance the science program. However, if policies become restrictive and prescriptive, they make it difficult for teachers to use their professional ability in the service of their students.
Program Standard A
All elements of the K-12 science program must be consistent with the other National Science Education Standards and with one another and developed within and across grade levels to meet a clearly stated set of goals.
-
In an effective science program, a set of clear goals and expectations for students must be used to guide the design, implementation, and assessment of all elements of the science program.
-
Curriculum frameworks should be used to guide the selection and development of units and courses of study.
-
Teaching practices need to be consistent with the goals and curriculum frameworks.
-
Assessment policies and practices should be aligned with the goals, student expectations, and curriculum frameworks.
-
Support systems and formal and informal expectations of teachers must be aligned with the goals, student expectations and curriculum frameworks.
-
Responsibility needs to be clearly defined for determining, supporting, maintaining, and upgrading all elements of the science program.
[See Teaching Standard A]
IN AN EFFECTIVE SCIENCE PROGRAM, A SET OF CLEAR GOALS AND EXPECTATIONS FOR STUDENTS MUST BE USED TO GUIDE THE DESIGN, IMPLEMENTATION, AND ASSESSMENT OF ALL ELEMENTS OF THE SCIENCE PROGRAM. A science program begins with the goals and expectations for student achievement; it also includes the selection and organization of science content into curriculum frameworks, ways of teaching, and assessment strategies. The goals for a science program provide the statements of philosophy and the vision that drive the program and the statements of purpose that the program is designed to achieve.
[See Program Standard B]
CURRICULUM FRAMEWORKS SHOULD BE USED TO GUIDE THE SELECTION AND DEVELOPMENT OF UNITS AND COURSES OF STUDY. The curriculum framework provides a guide for moving the vision presented in the goals closer to reality. Teachers use the guide as they select and design specific school and classroom work. By specifying the sequence of topics in the curriculum, the guide ensures articulation and coherence across the curriculum. Using the framework, teachers design instruction that is based on the prior experiences of students but avoids unnecessary repetition. The framework guides the students as they move through their schooling.
TEACHING PRACTICES NEED TO BE CONSISTENT WITH THE GOALS AND CURRICULUM FRAMEWORKS. The program standards do not prescribe specific teaching behaviors, nor should district or school policies. There are many ways to teach science effectively while adhering to the basic tenets of the National Science Education Standards, but they must be consistent with the goals and framework of the district.
[See Teaching Standard C]
ASSESSMENT POLICIES AND PRACTICES SHOULD BE ALIGNED WITH THE GOALS, STUDENT EXPECTATIONS, AND CURRICULUM FRAMEWORKS. Within the science program, the alignment of assessment with curriculum and teaching is one of the most critical pieces of science education reform. If the assessment system at the school and district levels does not reflect the Standards and measure what is valued, the likelihood of reform is greatly diminished. Assessing only factual information inevitably leads to emphasis on factual teaching—a situation all too prevalent in schools today. Decision makers at the school and district levels, as well as community leaders and parents, must realize the nature of the science that is being taught and the strategies by which student understanding can be assessed. This will require letting go of some traditional methods of accountability and developing new assessment policies and practices at the classroom and district levels that are consistent with the program goals of the district and the assessment standards.
SUPPORT SYSTEMS AND FORMAL AND INFORMAL EXPECTATIONS OF TEACHERS MUST BE ALIGNED WITH THE GOALS, STUDENT EXPECTATIONS, AND CURRICULUM FRAMEWORKS. An effective science program requires an adequate support system, including resources of people, time, materials and finance, opportunities for staff development, and leadership that works toward the goals of the program. It is encoded formally in policy documents such as a teacher's handbook and informally in the unwritten norms that determine routines. The support system must support classroom teachers in teaching science as described in the Standards.
[See Teaching Standard F]
RESPONSIBILITY NEEDS TO BE CLEARLY DEFINED FOR DETERMINING, SUPPORTING, MAINTAINING, AND UPGRADING ALL ELEMENTS OF THE SCIENCE PROGRAM. Although all school personnel have responsibilities, clearly defined leadership at the school and district levels is
required for an effective science program. Leadership can be vested in a variety of people, including teachers, school administrators, and science coordinators. Who provides such leadership is not as critical as ensuring that the responsibilities for support, maintenance, assessment, review, revision, and improvement of the program are effectively carried out so that students have opportunities to learn and teachers have the opportunity to teach.
The alignment needed in a science program can be illustrated by considering scientific inquiry. The ability to understand and conduct scientific inquiry is an important goal for students in any science program. To accomplish this goal, teachers must provide students with many opportunities to engage in and reflect on inquiry about natural phenomena. The district and school must provide curriculum frameworks that highlight inquiry and the support of materials and time to make this type of teaching possible. And assessment tasks should require students to demonstrate an understanding of inquiry and an ability to inquire.
Program Standard B
The program of study in science for all students should be developmentally appropriate, interesting, and relevant to students' lives; emphasize student understanding through inquiry; and be connected with other school subjects.
-
The program of study should include all of the content standards.
-
Science content must be embedded in a variety of curriculum patterns that are developmentally appropriate, interesting, and relevant to students' lives.
-
The program of study must emphasize student understanding through inquiry.
-
The program of study in science should connect to other school subjects.
This standard sets criteria for the work of curriculum designers and developers, whether in school districts, research and development institutions, or commercial publishing houses. It also sets criteria for those who select curricula.
THE PROGRAM OF STUDY SHOULD INCLUDE ALL OF THE CONTENT STANDARDS. Science content, as defined by the Standards, includes eight categories—unifying concepts and processes in science, science as inquiry, physical science, life science, earth and space science, science and technology, science in personal and social perspectives, and history and nature of science. An effective science program includes activities for students to achieve understanding and ability in all categories.
SCIENCE CONTENT MUST BE EMBEDDED IN A VARIETY OF CURRICULUM PATTERNS THAT ARE DEVELOPMENTALLY APPROPRIATE, INTERESTING, AND RELEVANT TO STUDENTS' LIVES. Curriculum includes not only the content, but also the structure, organization, balance, and means of presentation of the content in the classroom. Designing curricula considers the teaching and assessment standards, as well as the program standards and the content standards.
The translation of content into curricula can and should take many forms. The Standards do not prescribe a single curriculum for students to achieve the content
standards. On the contrary, for students to experience science fully and to meet the goals of science education, a variety of curriculum patterns, structures, and emphases should be included in the activities, units, and courses that make up a total science program.
Regardless of organization, the science program should emphasize understanding natural phenomena and science-related social issues that students encounter in everyday life. Because inquiries into most natural phenomena and the process of resolving social issues that are science related involve understanding and ability from more than one content standard, science programs will contain activities, units, and courses that are designed to require knowledge and skill from more than one content standard. As an example, a unit on the quality of a river might emphasize the outcomes specified in the content standard on science as inquiry. At the same time, the unit might increase students' understanding of science in personal and social perspectives, life science, physical science, and earth and space science.
If teachers are to teach for understanding as described in the content standards, then coverage of great amounts of trivial, unconnected information must be eliminated from the curriculum. Integrated and thematic approaches to curriculum can be powerful; however they require skill and understanding in their design and implementation.
[See Teaching Standard A]
Effective science curriculum materials are developed by teams of experienced teachers, scientists, and science curriculum specialists using a systematic research and development process that involves repeated cycles of design, trial teaching with children, evaluation, and revision. Because this research and development process is labor intensive and requires considerable scientific, technical, and pedagogical expertise, teachers and school district personnel usually begin the design and development of a curriculum that meets local goals and frameworks with a careful examination of externally produced science materials. These materials are modified and adapted to meet the goals of the district and of teachers in that district, and to use the resources of the local community. However, care should be taken that in the adaptation of externally produced materials to local needs, the original intended purpose and design are not undermined.
Districtwide goals and expectations for student achievement, as well as the curriculum frameworks, serve to ensure coherence and articulation across grades, but they must not constrain the creativity and responsiveness of teachers in schools. While high-quality curriculum materials provide a critical base for teaching science, especially for new teachers and others new to teaching science as described in the Standards, teachers must have the flexibility to meet the science program goals in a variety of ways by adjusting and adapting curriculum materials to match their own and their students' strengths and interests.
The content standards are designed to be developmentally appropriate and to build understanding of basic ideas across the grade levels. In designing curricula, care should be taken to return to concepts in successive years so that students have the opportunity to increase and deepen their understanding and ability as they mature.
This gradual development of understanding and ability will be realized only if the concepts and capabilities designated for each grade level are congruent with the students' mental, affective, and physical abilities. Providing a range of student activities promotes learning, and some activities can be slightly beyond the students' developmental level. However, it is inappropriate to require students to learn terms and perform activities that are far beyond their cognitive and physical developmental level.
[See Content Standard A (all grade levels)]
THE PROGRAM OF STUDY MUST EMPHASIZE STUDENT UNDERSTANDING THROUGH INQUIRY. Inquiry is a set of interrelated processes by which scientists and students pose questions about the natural world and investigate phenomena; in doing so, students acquire knowledge and develop a rich understanding of concepts, principles, models, and theories. Inquiry is a critical component of a science program at all grade levels and in every domain of science, and designers of curricula and programs must be sure that the approach to content, as well as the teaching and assessment strategies, reflect the acquisition of scientific understanding through inquiry. Students then will learn science in a way that reflects how science actually works.
THE PROGRAM OF STUDY IN SCIENCE SHOULD CONNECT TO OTHER SCHOOL SUBJECTS. Student achievement in science and in other school subjects such as social studies, language arts, and technology is enhanced by coordination between and among the science program and other programs. Furthermore, such coordination can make maximal use of time in a crowded school schedule. As an example, the National Standards for Geography include knowledge about land forms, as does the earth and space science standard. A combined geography and science unit is natural. Oral and written communication skills are developed in science when students record, summarize, and communicate the results of inquiry to their class, school, or community. Coordination suggests that these skills receive attention in the language arts program as well as in the science program.
Program Standard C
The science program should be coordinated with the mathematics program to enhance student use and understanding of mathematics in the study of science and to improve student understanding of mathematics.
Science requires the use of mathematics in the collection and treatment of data and in the reasoning used to develop concepts, laws, and theories. School science and mathematics programs should be coordinated so that students learn the necessary mathematical skills and concepts before and during their use in the science program.
Coordination of science and mathematics programs provides an opportunity to advance instruction in science beyond the purely descriptive. Students gathering data in a science investigation should use tools of data analysis to organize these data and to formulate hypotheses for further testing. Using data from actual investigations from science in mathematics courses, students encounter all the anomalies of authentic problems—inconsistencies, outliers, and
The Solar System
In this example, students engage in an inquiry activity that includes both science and mathematics providing prerequisite knowledge for constructing physical models. Ms. B. begins by asking students what they already know about the solar system and maintains their interest by pointing out that some science and technology that they accept as ordinary have not always existed. In a careful sequence, each lesson in the inquiry builds on previous lessons. Students observe stars for a period of time, discuss patterns they observe, and seek confirmation of the patterns through additional observations. Students use manipulatives such as globes, rulers, and protractors to develop understanding. Mathematics is integral to this inquiry, so Ms. B has worked with the mathematics instructor to ensure coordination.
[This example highlights some elements of Teaching Standards A, B, D and E; 5–8 Content Standards A, B, F, and G, as well as Unifying Concepts and Processes; and Program Standards A, B, C, and D.]
Ms. B. was beginning the study of the solar system with the eighth grade class. In preparation for building models of the solar system, she wanted the students to estimate the circumference of the earth. The activity was designed to allow students to think and act like astronomers 500 years ago. She had spent some time with the mathematics teacher in order to coordinate part of the study with him. In fact, some of the science work would actually take place in the math class.
Ms. B. set the stage by reviewing what the students already knew about the solar system, especially about the earth, sun, and moon. Then they talked briefly about building models and determined that to make a scale model they would have to know how big each object in the solar system was and also the distances between them. Ms. B. asked whether they knew these facts about the sun, moon and earth. Someone said they could look it up. But Ms. B. said that although they could get the answer this way, instead they were going to try to find out for themselves, similar to the way astronomers learned new things.
She asked the students how they thought the circumference of the earth was measured. Someone said by measuring on a map. Someone else said by flying around it keeping track of the distance. Ms. B. told them, however, that Columbus had an approximate, but limited, idea of how big the earth was before anyone had gone around it. She said they were going to determine the circumference of the earth using the North Star. Ms. B. gave each student a diagram of the North Star and the stars of the Big and Little Dipper, drawn to scale. The stars were oriented the way they would be looking due north at about 8:00 p.m. in their town. She directed the students to observe and make sketches of the positions of the Big Dipper, the Little Dipper, and the North Star at dark and at least two hours later.
Several days later students compared notes on the stars. Almost everyone had found them, many for the first time. When they compared their observations, everyone had seen the stars move, but most students noticed that the North Star seemed to stay in the same place. They agreed that everyone should observe one more time that
night to confirm their observations. But for the moment it was agreed to assume—with the majority—that the North Star didn't seem to move at all.
With these observations, Ms. B. said, they were ready to try to find the circumference of the earth. She challenged each group of four to use their globes to answer the question: ''Since the North Star didn't appear to move, what direction would it be if you were standing at the North Pole?" After some time for thinking, discussing and moving the globe around, the class shared their answers. Several groups said it would be right overhead. Asked to explain why, they used their globes to illustrate that if it were not, it wouldn't stay due north as the earth turned.
Ms. B. then drew a sketch of the earth, with the familiar Western Hemisphere facing her, on the blackboard. She drew an arrow straight up from the North Pole, pointing to the North Star, and she also made a dot on the equator at the edge of her sketch on the Gilbert and Ellis Islands in the Pacific. She asked: "Which way is the North Star for someone in the Gilbert and Ellis Islands?"
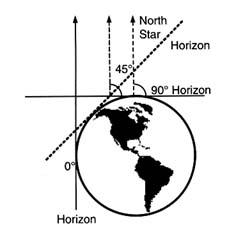
Figure 1.
Ms. B.'s Sketch of the earth
Each group was directed to reach a consensus of where to draw the arrow from the Gilbert and Ellis Islands on the sketch, but some could not. Each group, and the holdouts, put an arrow on the board to illustrate their answer. One arrow pointed straight up, and the rest pointed at a range of angles, most toward a point near the top of the blackboard. How could they find out who was accurate? Ms. B. suggested that they use what they knew to try to decide who among the groups might be right. To help the students get started on this task, she asked each group how high up they thought the North Star was. According to where their arrows pointed, most had assumed that the North Star was only a few earth diameters above the North Pole. Ms. B. then asked what the students thought the distance to the North Star really was compared with the size of the earth. Now many students said that it must be very far away because it's a star and stars are very far away. In the end consensus was reached that if the North Star were very far away—a great many earth diameters—the straight up arrow in the sketch would point to this star, no matter where one was on the drawing of the earth.
Then Ms. B. drew a line straight across the top of the earth in her sketch to indicate the horizon at the North Pole, pointing out that on the blackboard the angle from the horizon to the North Star was 90 degrees. If you were standing on the North Pole you would look straight up to see the North Star. She asked the students where the inhabitants of the Gilbert and Ellis Islands on the equator, ¼ of the way around the earth away, would look. She also made a mark on her diagram
1/8 of the earth's circumference south from the North Pole and asked at what angle above the horizon the inhabitants there would have to look to find the North Star. Discussion followed, with a variety of different quick answers. Ms. B. challenged the groups to use their compasses and protractors to make a drawing that would give them the answers. When the groups had come up with some ideas, she led them in a discussion on how the angle changed as the distance around the earth from the pole changed. They agreed that it got smaller and smaller, going from 90 degrees at the pole to 45 degrees 1/8 of the way around, and 0 degrees at the equator.
The next day, Ms. B. put a graph with the three points the students had found so far on the board. She asked how they could predict the angle of the North Star for two points, A and B, which she added to the graph, one halfway between the 45 degree point and the pole and the other halfway between the 45 degree point and the equator? The students suggested a straight line on the graph which fitted their three points would represent the relationship between the angle and distance around the earth. The students also agreed that this was just a guess. Ms. B. asked how they could be more certain and they decided they could go back to their drawing, use their protractors to put A and B on it, and measure what the angle of the North Star would be.
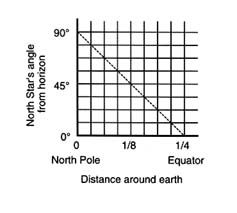
Figure 2.
Ms. B.'s Graph
The result of their graphic investigation confirmed that a straight line seemed to be a good graph for the relationship between the angle formed by the North Star and the horizon and distance around the earth.
Ms. B. then told them that in Columbus' day it was known from ground travel that the distance between a town in Scandinavia where the North Star angle was 67 degrees and another in Italy where the North Star angle was 43 degrees was about 3,000 miles. People who knew what the students now knew could figure out the circumference of the earth. The groups were to take their data to math class where they would have time to figure out the earth's circumference and then proceed to look in the library for the best modern value.
The next day, the class discussed how well they had done in getting a value for the earth's size. In succeeding days they calculated the distance to the moon and its circumference and looked up the same information for the sun. They also learned how modern astronomers calculate distances and size. Finally, using the data, each group designed a scale model of the sun, moon, and earth.
errors—which they might not encounter with contrived textbook data.
If teachers of mathematics use scientific examples and methods, understanding in both disciplines will be enhanced. For mathematics, coordination reinforces the perspective of investigation and experimentation that is emphasized in the National Council of Teachers of Mathematics (NCTM) standards. The mathematics that students should understand and use in the study of science as articulated in the NCTM mathematics standards are listed in Table 7.1.
Connecting the science and mathematics programs requires coordination at the school and district levels. Those who develop guiding frameworks must work together to ensure that the potential for connection is in place at the district level. At the school level, teachers of mathematics and science must develop and implement a coordinated program.
Program Standard D
The K-12 science program must give students access to appropriate and sufficient resources, including quality teachers, time, materials and equipment, adequate and safe space, and the community.
-
The most important resource is professional teachers.
-
Time is a major resource in a science program.
-
Conducting scientific inquiry requires that students have easy, equitable, and frequent opportunities to use a wide range of equipment, materials, supplies, and other resources for experimentation and direct investigation of phenomena.
-
Collaborative inquiry requires adequate and safe space.
-
Good science programs require access to the world beyond the classroom.
[See System Standard D]
Learning science requires active inquiry into the phenomena of the natural world. Such inquiry requires rich and varied resources in an adequate and safe environment. The specific criteria for a science learning environment will depend on many factors such as the needs of the students and the characteristics of the science program. A student with rich experience in a topic might need access to additional resources within or outside the school; a student with a different language background might need supporting materials in that language; a student with a physical disability might need specially designed equipment; and a student with little experience using computer technology might need a tutor or a tutorial program. District policy makers and those in charge of budget allocations must provide the resources, and then school-level administrators and teachers must make sure that, once allocated, the resources are well used.
THE MOST IMPORTANT RESOURCE IS PROFESSIONAL TEACHERS. Needless to say, students must have access to skilled, professional teachers. Teachers must be prepared to teach science to students with diverse strengths, needs, experiences, and approaches to learning. Teachers must know the content they will teach, understand the nature of learning, and use a range of teaching strategies for science. Hiring practices must ensure that teachers are prepared to teach science and should include successful teachers of science in the selection of their new colleagues.
TABLE 7.1. EXAMPLES OF MATHEMATICS THAT STUDENTS SHOULD USE AND UNDERSTAND
|
GRADES K-4 |
GRADES 5-8 |
GRADES 9-12 |
|
Measure, collect, and organize data |
Represent situations verbally, numerically, graphically, geometrically, or symbolically |
Develop ability to use realistic applications and modeling in trigonometry |
|
Explore chance |
||
|
Recognize and describe patterns |
Use estimations |
Understand connections within a problem situation, its model as a function in symbolic form, and the graph of that function |
|
Use variables to express relationship |
Identify and use functional relationships |
|
|
Develop skills of estimation and judgment |
Develop and use tables, graphs, and rules to describe situations |
Use functions that are constructed as models of real-world problems |
|
|
Use statistical methods to describe, analyze, evaluate, and make decisions |
Know how to use statistics and probability |
|
|
Use geometry in solving problems |
|
|
|
Create experimental and theoretical models of situations involving probabilities |
|
|
Source: NCTM, 1989 |
||
Districts should use the professional development standards to provide teachers with opportunities to develop and enhance the needed capabilities for effective science teaching. Funding and professional time for such development is an essential part of district budgets.
The emphasis on the need for professional teachers of science does not diminish the need for other school personnel who enhance the science program. In addition to an administrative team and teaching colleagues, other support personnel might include the resource librarian, a laboratory technician, or maintenance staff.
TIME IS A MAJOR RESOURCE IN A SCIENCE PROGRAM. Science must be allocated sufficient time in the school program every day, every week, and every year. The content standards define scientific literacy; the amount of time required to achieve scientific literacy for all students depends on the particular program. The time devoted to science education must be allocated to meet the needs of an inquiry-based science program. No matter what the scheduling model, a school schedule needs to provide sufficient and flexible use of time to accommodate the needs of the students and what is being learned. In addition to time with students and with colleagues, teachers of science also spend considerable time preparing materials, setting up activities, creating the learning environment, and organizing student experiences. This time must be built into the daily teaching schedule.
CONDUCTING SCIENTIFIC INQUIRY REQUIRES THAT STUDENTS HAVE EASY, EQUITABLE, AND FREQUENT OPPORTUNITIES TO USE A WIDE RANGE OF EQUIPMENT, MATERIALS, SUPPLIES, AND OTHER RESOURCES FOR EXPERIMENTATION AND DIRECT INVESTIGATION OF PHENOMENA. Some equipment is general purpose and should be part of every school's science inventory, such as magnifiers or microscopes of appropriate sophistication, measurement tools, tools for data analysis, and computers with software for supporting investigations. Other materials are topic specific, such as a water table for first graders or a reduced-resistance air table for physics investigations; such specialized materials also need to be made available. Many materials are consumable and need to be replenished regularly. Furthermore, policy makers need to bear in mind that equipment needs to be upgraded frequently and requires preventive maintenance.
Given that materials appropriate for inquiry-based science teaching are central to achieving the educational goals set forth in the Standards, it is critical that an effective infrastructure for material support be a part of any science program. School systems need to develop mechanisms to identify exemplary materials, store and maintain them, and make them accessible to teachers in a timely fashion. Providing an appropriate infrastructure frees teachers' time for more appropriate tasks and ensures that the necessary materials are available when needed. Because science inquiry is broader than first-hand investigation, print, video, and technology sources of information and simulation are also required. These are included in the materials-support infrastructure.
The teaching standards consistently make reference to the responsiveness and flexibility to student interests that must be evidenced in classrooms that reflect effective science teaching. The content standard on inquiry sets the expectation that students will develop the ability to perform a full inquiry. For such inquiry-based teaching to become a reality, in addition to what is regularly maintained in the school and district, every teacher of science needs an easily accessible budget for materials and equipment as well as for unanticipated expenses that arise as students and teachers pursue their work.
COLLABORATIVE INQUIRY REQUIRES ADEQUATE AND SAFE SPACE. There must be space for students to work together in groups, to engage safely in investigation with materials, and to display both work in progress and finished work. There also must be space for the safe and convenient storage of the materials needed for science. At the lower grade levels, schools do not need separate rooms for laboratories. In fact, it is an advantage in terms of long-term studies and making connections between school subject areas to have science as an integral part of the classroom environment. At the upper grade levels, laboratories become critical to provide the space, facilities, and equipment needed for inquiry and to ensure that the teacher and students can conduct investigations without risk. All spaces where students do inquiry must meet appropriate safety regulations.
GOOD SCIENCE PROGRAMS REQUIRE ACCESS TO THE WORLD BEYOND THE CLASSROOM. District and school leaders must allocate financial support to provide opportunities for students to investigate the
world outside the classroom. This may mean budgeting for trips to nearby points of interest, such as a river, archaeological site, or nature preserve; it could include contracting with local science centers, museums, zoos, and horticultural centers for visits and programs. Relationships should be developed with local businesses and industry to allow students and teachers access to people and the institutions, and students must be given access to scientists and other professionals in higher education and the medical establishment to gain access to their expertise and the laboratory settings in which they work. Communication technology has made it possible for anyone to access readily people throughout the world. This communication technology should be easily accessible to students.
Much of this standard is acknowledged as critical, even if unavailable, for students in secondary schools. It must be emphasized, however, that this standard applies to the entire science program and all students in all grades. In addition, this standard demands quality resources that often are lacking and seem unattainable in some schools or districts. Missing resources must not be an excuse for not teaching science. Many teachers and schools "make do" or improvise under difficult circumstances (e.g., crowded classrooms, time borrowed from other subjects, and materials purchased with personal funds). A science program based on the National Science Education Standards is a program constantly moving toward replacing such improvisation with necessary resources.
Program Standard E
All students in the K-12 science program must have equitable access to opportunities to achieve the National Science Education Standards.
[See System Standard E]
All students, regardless of sex, cultural or ethnic background, physical or learning disabilities, future aspirations, or interest in science, should have the opportunity to attain high levels of scientific literacy. By adopting this principle of equity and excellence, the Standards prescribe the inclusion of all students in challenging science learning opportunities and define a high level of understanding that all students should achieve. In particular, the commitment to science for all implies inclusion of those who traditionally have not received encouragement and opportunity to pursue science—women and girls, students of color, students with disabilities, and students with limited English proficiency. It implies attention to various styles of learning, adaptations to meet the needs of special students and differing sources of motivation. And it also implies providing opportunities for those students interested in and capable of moving beyond the basic program. Given this diversity of student needs, experiences, and backgrounds, and the goal that all students will achieve a common set of standards, schools must support high-quality, diverse, and varied opportunities to learn science.
The understandings and abilities described in the content standards are outcomes for all students; they do not represent different expectations for different groups of
students. Curriculum developers, local policy makers, and teachers of science must make decisions about and provide the resources required to accommodate the different rates of learning.
The principles of equity and excellence have implications for the grouping of students. There are science activities for which grouping is appropriate and activities for which grouping is not appropriate. Decisions about grouping are made by considering the purpose and demands of the activity and the needs, abilities, and interests of students. A Standards-based science program ensures that all students participate in challenging activities adapted to diverse needs.
The principles of equity and excellence also bear on Program Standard A—coherence and consistency—and Program Standard B—curriculum. All dimensions of a science program adhere to the principle of science for all. Themes and topics chosen for curricula should support the premise that men and women of diverse backgrounds engage in and participate in science and have done so throughout history. Teaching practice is responsive to diverse learners, and the community of the classroom is one in which respect for diversity is practiced. Assessment practices adhere to the standard of fairness and do not unfairly assume the perspective or experience of a particular group. Assessment practices also are modified appropriately to accommodate the needs of students with disabilities or other special conditions.
Program Standard F
Schools must work as communities that encourage, support, and sustain teachers as they implement an effective science program.
-
Schools must explicitly support reform efforts in an atmosphere of openness and trust that encourages collegiality.
-
Regular time needs to be provided and teachers encouraged to discuss, reflect, and conduct research around science education reform.
-
Teachers must be supported in creating and being members of networks of reform.
-
An effective leadership structure that includes teachers must be in place.
[See Teaching Standard F]
Many previous reform efforts have failed because little attention was paid to the connection between teacher enhancement, curriculum development, and the school as a social and intellectual community. Teachers with new ideas, skills, and exemplary materials often worked in an environment where reform was not valued or supported.
SCHOOLS MUST EXPLICITLY SUPPORT REFORM EFFORTS IN AN ATMOSPHERE OF OPENNESS AND TRUST THAT ENCOURAGES COLLEGIALITY. All too frequently today the norms of relationships in schools promote isolation, conformity, competition, and distrust—and teachers are treated as technicians. Significant change is called for in the vision of science education reform described by the Standards. Collegiality, openness, and trust must be valued; teachers must be acknowledged and
treated as professionals whose work requires understanding and ability. This change cannot happen within the science program alone; it demands the transformation of entire schools into communities of adult learners focused on the study and improvement of teaching and learning. Without movement toward the school as a community of learners engaged in reflective practice, the vision of science teaching and learning promoted by the Standards is unlikely to flourish.
[See Professional Development Standard C]
REGULAR TIME NEEDS TO BE PROVIDED AND TEACHERS ENCOURAGED TO DISCUSS, REFLECT, AND CONDUCT RESEARCH AROUND SCIENCE EDUCATION REFORM. The transformation of schools into centers of inquiry requires explicit action to remove destructive practical and policy constraints to reform. Schedules must be realigned, time provided, and human resources deployed such that teachers can come together regularly to discuss individual student learning needs and to reflect and conduct research on practice. In a community of learners, teachers work together to design the curriculum and assessment. They also design and take part in other professional growth activities. Time must be available for teachers to observe other classrooms, team teach, use external resources, attend conferences, and hold meetings during the school day.
TEACHERS MUST BE SUPPORTED IN CREATING AND BEING MEMBERS OF NETWORKS OF REFORM. For teachers to study their own teaching and their students' learning effectively and work constructively with their colleagues, they need tangible and moral support. Collaboration must be developed with outside institutions such as colleges and universities, professional societies, science-rich centers, museums, and business and industry to ensure that the expertise needed for growth and change is available from within and outside the school. Teachers need the opportunity to become part of the larger world of professional teachers of science through participating in networks, attending conferences, and other means.
Teachers of science also need material support. As communities of learners, schools should make available to teachers professional journals, books, and technologies that will help them advance their knowledge. These same materials support teachers as they use research and reflection to improve their teaching.
AN EFFECTIVE LEADERSHIP STRUCTURE THAT INCLUDES TEACHERS MUST BE IN PLACE. Developing a community of learners requires strong leadership, but that leadership must change dramatically from the hierarchical and authoritarian leadership often in place in schools and in school districts today. Leadership should emerge from a shared vision of science education and from an understanding of the professional, social, and cultural norms of a school that is a community of learners.
The leadership structure might take many forms, but it inevitably requires that teachers and administrators rethink traditional roles and responsibilities and take on new ones. School leaders must structure and sustain suitable support systems for the work that teachers do. They are responsible for
ensuring that agreed-upon plans for time, space, and resources are carried out. They must model the behaviors they seek by becoming learners themselves with the teaching staff. They are advocates for the school program in the district and community. They monitor the work of the school and the staff and provide corrective feedback that enhances effective functioning. There are many possible ways to structure a community of learners that reflect the norms and demands described in this standard. However, regardless of the structure, roles and responsibilities must be explicit and accountability clearly assigned.
Changing Emphases
The National Science Education Standards envision change throughout the system. The program standards encompass the following changes in emphases:
|
LESS EMPHASIS ON |
MORE EMPHASIS ON |
|
Developing science programs at different grade levels independently of one another |
Coordinating the development of the K-12 science program across grade levels |
|
Using assessments unrelated to curriculum and teaching |
Aligning curriculum, teaching, and assessment |
|
Maintaining current resource allocations for books |
Allocating resources necessary for hands-on inquiry teaching aligned with the Standards |
|
Textbook- and lecture-driven curriculum |
Curriculum that supports the Standards and includes a variety of components, such as laboratories emphasizing inquiry and field trips |
|
Broad coverage of unconnected factual information |
Curriculum that includes natural phenomena and science-related social issues that students encounter in everyday life |
|
Treating science as a subject isolated from other school subjects |
Connecting science to other school subjects, such as mathematics and social studies |
|
Science learning opportunities that favor one group of students |
Providing challenging opportunities for all students to learn science |
|
Limiting hiring decisions to the administration |
Involving successful teachers of science in the hiring process |
|
Maintaining the isolation of teachers |
Treating teachers as professionals whose work requires opportunities for continual learning and networking |
|
Supporting competition |
Promoting collegiality among teachers as a team to improve the school |
|
Teachers as followers |
Teachers as decision makers |
References for Further Reading
Anderson, R., and H. Pratt. 1995. Local Leadership for Science Education Reform. Dubuque, IA: Kendall/Hunt.
Clewell, B.C., B.T. Anderson, and M.E. Thorpe. 1992. Breaking the Barriers: Helping Female and Minority Students Succeed in Mathematics and Science. San Francisco: Jossey-Bass.
Cole, M., and P. Griffin, eds. 1987. Contextual Factors in Education: Improving Science and Mathematics for Minorities and Women. Madison, WI: Committee on Research on Mathematics, Science, and Technology Education, Wisconsin Center for Education Research.
Darling-Hammond, L. 1993. Reframing the school reform agenda: Developing capacity for school transformation. Phi Beta Kappan, June, 1993.
Fullan, M., and S. Stiegelbauer. 1991. The New Meaning of Educational Change, 2nd ed. New York: Teachers College Press.
Geography Education Standards Project. 1994. Geography for Life. Washington, DC: National Geographic Research and Exploration.
Lieberman, A., ed. 1988. Building a Professional Culture in Schools. New York: Teachers College Press.
NCTM (National Council of Teachers of Mathematics). 1989. Curriculum Evaluation Standards for School Mathematics. Reston, VA: NCTM.
Oakes, J. 1990. Multiplying Inequalities: The Effect of Race, Social Class, and Tracking on Opportunities to Learn Mathematics and Science. Santa Monica, CA: RAND Corporation.
Porter, A. 1993. School delivery standards. Educational Researcher 22(5): 24-30.
Stevenson, H.W., and J.W. Stigler. 1992. The Learning Gap: Why Our Schools Are Failing and What We Can Learn from Japanese and Chinese Education. New York: Summit Books.