
2
U.S. AGRICULTURE YESTERDAY AND TODAY: The Colleges' Changed Environment
This chapter describes some of the main ways in which the U.S. farm and agricultural industry has evolved since the colleges' early years and some of the ways in which the colleges have contributed to those changes through science and technology development. The chapter's main goal is to provide an economic backdrop for a discussion of the current and evolving role of the colleges of agriculture in addressing society's needs and concerns. It draws heavily on data and reports generated by the U.S. Department of Agriculture's Economic Research Service (ERS).
-
In 1860 at the dawn of the decade that would put the land grant college system in the history books, one-half of the U.S. population lived on farms and more than one-half of the labor force worked on them. The numbers of farms continued to rise until the 1920s. In the decades that followed, however, U.S. citizens left farming in massive numbers for other ways of life and alternative types of employment. By 1990 the farm population was less than one-third of what it had been in 1860, and by 1992 there were slightly fewer farms than there had been in 1860 (Table 2-1).
-
It is important to understand that these trends, in addition to having changed the profile of the national landscape, are also indicators of economic progress. The same number of farms and farmers can feed vastly larger numbers of people today than 100 years ago. The fact that so many more people could be fed with relatively little farm labor input meant that farm workers became available to other industries—industries that taught them different skills and paid them higher wages. Essentially, the release of labor from farming fueled the growth of the rest of the U.S. economy, although this change did not come without significant adjustment costs for communities and families.
Farm productivity has improved since the inception of and as the result of land grant colleges of agriculture.
TABLE 2-1
Total U.S. Population Statistics Compared to Farm Population Statistics, 1840–1992
-
The colleges of agriculture generated many of the scientific and management advances that contributed to the growth of productivity in U.S. agriculture. Such advances include hybrid seeds, improved farm and production management techniques, improved genetic stock of food animals, and sophisticated financial management strategies. Total factor productivity—that is, the output generated by all farm inputs working together—increased almost 150 percent between 1948 and 1991 (Table 2-2).
-
Many studies of public investments in agricultural science, such as those listed in Table 2-3, show large economic payoffs. They find high rates of return to U.S. agricultural research and development, even though the range of estimates is large and methodological problems make accurate measurement very difficult (Alston et al., 1994).
-
A significant portion of the gain in productivity in agriculture is the result of the substitution of "modern" inputs—mechanical and chemical—for labor hours and land area. For example, farm labor input decreased 65 percent from 1948 to 1991, while chemical inputs increased 176 percent over these same years (Table 2-2). The application of farm chemicals, combined with other yield-enhancing technologies such as improved crop varieties, has made it possible to produce more food and fiber on virtually the same amount of land. Yield-enhancing technologies have also helped the United States become the world's leading exporter of farm and agricultural products. The agricultural trade balance has been favorable every year since 1960, and agricultural products compose about 10 percent of total U.S. merchandise exports (Executive Office of the President, 1995).
TABLE 2-2
Productivity and Input Use in U.S. Agriculture (1982 = 100)
|
Year |
Total Factor Productivity |
Selected Indexes of Input Use |
|
|
|
|
Farm Labor |
Chemical |
|
1948 |
52 |
251 |
34 |
|
1950 |
50 |
237 |
43 |
|
1955 |
54 |
211 |
45 |
|
1960 |
60 |
163 |
58 |
|
1965 |
71 |
141 |
73 |
|
1970 |
77 |
119 |
76 |
|
1975 |
84 |
114 |
91 |
|
1980 |
82 |
108 |
131 |
|
1982 |
100 |
100 |
100 |
|
1985 |
110 |
89 |
101 |
|
1990 |
126 |
87 |
90 |
|
1991 |
124 |
88 |
94 |
|
NOTE: In computing productivity and input use indexes, 1982 is used as the base year. Farm output measures the annual volume of net farm production available for eventual human use through farm sales or on-farm consumption. Total factor productivity is measured by farm output per unit of total factor input. SOURCE: Adapted from Executive Office of the President. 1994. Economic Report of the President. Washington, D.C.: U.S. Government Printing Office |
|||
-
Despite public benefits, concerns about modern farming technologies, particularly the impacts of farm chemicals on human health, soil and water quality, and wildlife, have intensified in recent years. Mechanical technologies can also have adverse effects on soil quality and soil erosion. There is evidence that agricultural chemicals and sediments are impairing the quality of some surface and groundwater resources and imposing costs on water users (U.S. Department of Agriculture, Economic Research Service, Natural Resources and Environment Division, 1994). Thus agricultural research has been directed, more recently, toward developing production technologies that are both cost-effective substitutes for machines and chemicals and less risky in terms of environmental and health costs.
-
Technologies developed and in use that can reduce reliance on mechanical and chemical inputs and, at the same time, enhance farm productivity include integrated pest management and other "best-management" practices, such as crop rotations with legumes, integrated livestock-crop systems with manure applications, and management-intensive grazing (see Vandeman et al., 1994, for an assessment of integrated pest management [IPM] adoption). Also, reliance on conventional chemical pest control is being reduced through the ongoing development of biological controls and through classical plant breeding methods that continue to improve crop resistance to insects and disease.
-
Frontier developments in biotechnology may also offer the opportunity to achieve greater compatibility between farm productivity and environmental quality. Scientists in both the public and private sectors are working to apply bioengineering techniques to the development of pest-and disease-resistant crops. For example, advances in biological nitrogen fixation technologies could make plants more efficient in absorbing nitrogen and thereby reduce the need for synthetic nitrogen fertilizers derived from fossil fuels. Bioengineering techniques are also being directed toward improving crop tolerance to chemical herbicides, which will reduce crop loss from weeds but, some argue, could reinforce the use of chemical controls (Caswell et al., 1994).
TABLE 2-3
Studies Reporting Estimated Annual Rates of Return on Investments in U.S. Agricultural Research and Development, 1958–1990
|
Author |
Year |
Commodity |
Period |
Rate of Return (percent) |
|
Griliches |
1958 |
Hybrid corn |
1940–1955 |
35–40 |
|
|
|
Hybrid sorghum |
1940–1957 |
20 |
|
Griliches |
1964 |
Aggregate |
1949–1959 |
35–40 |
|
Latimer |
1964 |
Aggregate |
1949–1959 |
NS |
|
Peterson |
1967 |
Poultry |
1915–1960 |
21–25 |
|
Evenson |
1986 |
Aggregate |
1949–1959 |
47 |
|
Schmitz and Seckler |
1970 |
Tomato harvester |
1958–1969 |
37–46 |
|
Huffmana |
1974 |
Maize |
1959–1964 |
>16 |
|
Cline |
1975 |
Aggregate |
1939–1948 |
41–50 |
|
|
|
|
1949–1958 |
39–47 |
|
|
|
|
1959–1968 |
32–39 |
|
|
|
|
1969–1972 |
28–35 |
|
Peterson and Bredahl |
1975 |
Aggregate |
1937–1942 |
50 |
|
|
|
|
1947–1957 |
51 |
|
|
|
|
1957–1962 |
49 |
|
|
|
|
1967–1972 |
34 |
|
Bredahl and Peterson |
1976 |
Cash grains |
1969 |
36 |
|
|
|
Poultry |
1969 |
37 |
|
|
|
Dairy |
1969 |
43 |
|
|
|
Livestock |
1969 |
47 |
|
Huffmana |
1977 |
Crops |
1959–1964 |
110 |
|
Peterson and Fitzharris |
1977 |
Aggregate |
1937–1972 |
34–51 |
|
|
|
|
1937–1942 |
50 |
|
|
|
|
1947–1952 |
51 |
|
|
|
|
1957–1962 |
49 |
|
|
|
|
1957–1972 |
34 |
|
Evenson |
1978 |
Aggregate |
1948–1971 |
110 |
|
Evenson et al. |
1979 |
Aggregate |
1868–1926 |
65 |
|
|
|
|
1927–1950 |
95–110 |
|
|
|
|
1948–1971 |
45 |
|
Knutson and Tweeten |
1979 |
Aggregate |
1949–1972 |
28–47 |
|
Lu, Cline and Quance |
1979 |
Aggregate |
1939–1972 |
23.5–30.5 |
|
White et al. |
1979 |
Aggregate |
1929–1977 |
28–37 |
|
Davis and Peterson |
1981 |
Aggregate |
1949–1974 |
37–100 |
|
Norton |
1981 |
Cash grains |
1969 |
31–57 |
|
|
|
Poultry |
|
30–55 |
|
|
|
Dairy |
|
27–50 |
|
|
|
Livestock |
|
56–111 |
|
Otto and Havlicek |
1981 |
Corn |
1967–1979 |
152–210 |
|
|
|
Wheat |
|
79–148 |
|
White and Havlicek |
1982 |
Aggregate |
1943–1977 |
7–36 |
|
Lyu, White and Liu |
1984 |
Aggregate |
1949–1981 |
66–83 |
|
Braha and Tweeten |
1986 |
Aggregate |
1959–1982 |
47 |
|
Huffman and Evenson |
1989 |
Allb |
1950–1982 |
43 |
|
|
|
Cropsb |
1950–1982 |
45 |
|
|
|
Livestockb |
1950–1982 |
11 |
|
|
|
Allc |
1950–1982 |
67 |
|
|
|
Cropsc |
1950–1982 |
57 |
|
|
|
Livestockc |
1950–1982 |
83 |
|
|
|
Alld |
1950–1982 |
83 |
|
|
|
Cropsd |
1950–1982 |
90 |
|
|
|
Livestockd |
1950–1982 |
71 |
|
NOTE: NS, not statistically significant. a Huffman (1974) and Huffman (1977) cover the corn-belt regions. The regional coverage of all other studies is national. b Public-sector applied research. c Public-sector pre-technology science. d Private-sector research. SOURCE: Adapted from Alston, J. M., P. G. Pardey, and H. O. Carter, eds. 1994. Valuing UC Agricultural Research and Extension. Agricultural Issues Center Pub. No. VR-1. Davis: University of California, Division of Agricultural and Natural Resources. |
||||
TABLE 2-4
Dollars (billions) Spent on Food Consumption and U.S. Farm Value's Share
|
|
Personal Consumption Expenditures |
|
|
|
|
Year |
Total |
All Food |
Domestically Produced Food |
Farm-Level Value of Food Produced and Consumed in the U.S. |
|
1950 |
192.1 |
53.9 (28.1) |
44.0 |
18.0 (41.0) |
|
1960 |
332.4 |
82.6 (24.8) |
66.9 |
22.3 (33.3) |
|
1970 |
646.5 |
142.1 (22.0) |
110.6 |
35.5 (32.1) |
|
1980 |
1,748.1 |
341.8 (19.6) |
264.4 |
81.7 (30.9) |
|
1990 |
3,761.2 |
604.8 (16.1) |
449.8 |
106.2 (23.6) |
|
1994 |
4,627.0 |
679.1a (15.0) |
510.6 |
109.6 (21.5) |
|
NOTE: Numbers in parentheses under ''All Food'' show percent of total personal consumption expenditures. Numbers in parentheses under "Farm Level Value …" show percent of personal consumption expenditures for domestically produced food. a Preliminary. SOURCE: Total and all food personal consumption expenditures are from the Economic Report of the President, 1995 (Executive Office of the President. 1995. Budget of the United States Government. Washington, D.C.: U.S. Government Printing Office). Personal consumption expenditures for domestically produced food and farm value are from USDA, ERS, Food Cost Review, AER No. 696, 1993 and personal communication form 1994 update. |
||||
Farm-productivity gains translate into lower food costs.
-
Research targeted to improve farm productivity has benefited consumers in both the United States and other countries. Increased productivity means that the same farm output can be produced at lower production cost; thus the cost of farm commodities to industries that manufacture food and fiber products (or to countries that import farm commodities) is reduced. These savings are passed on, at least partially, to final consumers.
-
The consumer benefit translates into U.S. families spending, on average, a relatively small share of their personal consumption expenditures on food. That average share is now 15 percent, down from 28 percent in 1950 (Table 2-4). In other words, over the decades total personal consumption of all goods and services has increased much faster than has personal expenditures on food. As concern with food costs has lessened, other consumer concerns have gained visibility. Food safety, the amount of fats and cholesterol in food products, and the application of biotechnology to food production are currently food issues that concern U.S. consumers (see box copy, p. 23).
-
Affordability of food is still an issue for low-income consumers. Insufficient family income and inadequate food distribution and access are often more at issue, however, than high farm-commodity costs. Because of inadequate access from inner city and poor rural areas to competitively priced retail outlets, food prices in low-income areas tend to be 20 to 36 percent higher than in higher-income areas (McGrath Morris et al., 1992; Troutt, 1993). It is also the case that all U.S. consumers pay higher-than-free-market prices for sugar, dairy, and peanut products because of government programs designed to support prices to domestic producers.
|
What Americans Think about Food Issues A range of polls support the finding that consumers care about food issues. Stated consumer concerns may be in line with or different than scientifically supported knowledge about health and safety risks. There is incomplete evidence regarding the impact of consumer concerns on food purchases and consumption. According to a nationwide survey commissioned by Public Voice for Food and Health Policy, a national nonprofit advocacy organization, concern among U.S. citizens about the effects agricultural chemicals have on health and the environment is very strong and widespread. The poll, conducted in 1993 by Fingerhut/Granados Opinion Research Company, found that a majority of U.S. citizens were "very concerned" about how chemicals used to grow food affect the health of young children (68 percent); health problems caused generally by chemicals and pesticides used to grow food (60 percent); pesticides and fertilizers getting into the water supply (71 percent); and the risk of severe food poisoning from bacteria in meat (61 percent). The Public Voice poll is interesting in that it contrasts food-related health and environmental concerns with other health and environmental concerns. The poll found somewhat smaller percentages of people "very concerned" about health problems caused by secondary smoke—that is, smoke from other peoples' cigarettes (55 percent); health problems caused by air pollution from cars and industries (47 percent); and the effects of antibiotics and growth hormones used in meat and milk products (54 percent). The Center for Produce Quality (CPQ), a nonprofit foundation created by the Produce Marketing Association and the United Fresh Fruit and Vegetable Association, found in a 1992 nationwide poll that adults were generally confident about the safety of fresh fruits and vegetables, but that 61 percent were nonetheless "very concerned'' about pesticide residues. CPQ found that between 1989 and 1992 increased concern about pesticide residues was paralleled by growing consumer concerns about virtually all food-related issues, including nutritional value, fat, salmonella, cholesterol, and animal growth hormones. The International Food Information Council of the American Dietetic Association found in 1993 that 44 percent of adults surveyed were "very concerned" about the effects their diet has on their health and that an additional 40 percent were ''fairly concerned." In addition, they found that a strong majority of adults agreed that there are too many conflicting reports about nutrition. A 1993 poll of 1,000 shoppers, conducted by the Food Marketing Institute, found that taste was the most important consideration when selecting food. Ninety-one percent of the shoppers considered taste "very important." Other factors were also ranked "very important" by a majority of shoppers including nutrition (75 percent), price (74 percent), and product safety (72 percent). The same study found that food attributes considered by a majority of the shoppers polled to be "serious hazards" included residues such as pesticides and herbicides (79 percent) and antibiotics and hormones in poultry and |
|
livestock (55 percent). Other attributes considered "something of a hazard" included nitrites in food, irradiated foods, additives and preservatives, and artificial coloring. SOURCES: The following unpublished reports were used: Morris, P. M., A. Rosenfeld, and M. Bellinger. 1993. What Americans Think About Agrichemicals: A Nationwide Survey on Health, the Environment, and Public Policy. Washington, D.C.: Public Voice for Food and Health Policy; Center for Produce Quality. Produce Confidence, Consumption Grow. Alexandria, VA: Center for Produce Quality; American Dietetic Association. 1994. How Are Americans Making Food Choices? Washington, D.C.: International Food Information Council, American Dietetic Association; Food Marketing Institute. 1993 Trends. Washington, D.C.: Food Marketing Institute. |
-
Many U.S. citizens may have little sense of the continuing benefits they receive as a result of farm productivity-enhancing research. One reason the benefits are not readily apparent is that the raw-product component of retail food costs is so small. The effects of lower wheat prices on food prices in the supermarket, for example, may be all but unobservable after processing, packaging, marketing, shipping, and retail costs are added on; and these beyond-the-farm-gate costs have risen substantially over the years. U.S. farmers received only 21 percent of what U.S. consumers spent for domestically produced food in 1994, compared with 41 percent in 1950 (Table 2-4). The increasing share of food consumer away from home further increases the gap between farm-level commodity prices and retail food costs.
THE CHANGING STRUCTURE OF U.S. AGRICULTURE
-
Over the decades, although the number of U.S. farms decreased, the amount of land used for farming stayed more or less the same. As individual farms got larger they also became considerably more unequal in their contributions to national farm output. Concentration of commercial production is perhaps the most striking feature of modern U.S. agriculture. Today, only 3.6 percent of all farms account for one-half the value of all farm output, and 1.5 percent of all farms account for one-third of all output (Table 2-5). Of the approximately 2 million farms, about 280,000 provide most of the food and fiber that enter commercial channels. Although the contribution of agricultural research to farm-sector concentration is uncertain, what is clear is that relatively little research has been directed toward understanding the causes of this trend or its social implications or effects on the food system.
-
In addition to the fact that only a small fraction of all farms account for most farm output is the fact that most farm households do not rely on farm sales for most of their household income. A recent ERS report (Hoppe, 1994) examined farm businesses and farm operator households in county groupings labeled as follows:
-
farming-dependent counties (20 percent of local earnings come from farming),
-
major farming counties (less than 20 percent of local earnings come from farming, but farms in these counties rank in the top 20 percent of U.S. counties in total farm earnings), and
-
residual counties (all other U.S. counties, including metropolitan counties).
-
TABLE 2-5
Total U.S. Farms and Concentration of Farm Output, 1990-1992
|
|
|
Farms Accounting for One-Half of Outputa |
Farms Accounting for One-Third of Output |
||
|
Year |
Number of Farms |
Percent of All Farms |
Average Acres per Farm |
Percent of All Farms |
Average Acres per Farm |
|
1900 |
5,751,830 |
17.1 |
369 |
NA |
NA |
|
1940 |
5,938,897 |
11.6 |
611 |
5.2 |
989 |
|
1969 |
2,736,914 |
8.1 |
1,611 |
1.9 |
3,305 |
|
1987 |
2,102,278 |
3.6 |
2,792 |
1.5 |
3,921 |
|
1992 |
1,925,300 |
NA |
NA |
NA |
NA |
|
NOTE: Output is measured as sales. NA, data not available. a Includes farms accounting for one-third of all output. SOURCE: Peterson, R., and N. Brooks. 1993. The Changing Concentration of U.S. Agricultural Production During the 20th Century: 14th Annual Report to the Congress on the Status of the Family Farm. Agriculture Information Bulletin No. 671. Washington, D.C.: U.S. Department of Agriculture, Economic Research Service. |
|||||
TABLE 2-6
Financial Characteristics of Farm-Operator Households, by County Group, 1990
|
|
County Groups |
|||
|
Variable |
Farming-Dependent |
Major Farming |
Residual |
Total |
|
Number of farm-operator households |
229,811 |
424,762 |
1,083,446 |
1,738,019 |
|
Household income ($ per household) |
$40,413 |
$52,624 |
$33,370 |
$39,007 |
|
Farm-related income |
15,127 |
10,042 |
2,066 |
5,742 |
|
Off-farm incomea |
25,286 |
42,582 |
31,304 |
33,265 |
|
Wages and salaries |
12,942 |
19,298 |
17,239 |
17,174 |
|
Interest or dividends |
2,483 |
4,494 |
2,846 |
3,201 |
|
Other off-farm incomeb |
4,269 |
6,226 |
5,133 |
5,286 |
|
Negative income (% of households) |
||||
|
Farm-related income |
38.4 |
53.9 |
59.5 |
55.3 |
|
Total household income |
9.6 |
11.2 |
7.4 |
8.6 |
|
Farm income compared with off-farm income (% of households) |
|
|
|
|
|
No off-farm income |
11.0 |
10.0 |
6.8 |
8.1 |
|
Farm income less |
60.5 |
71.3 |
81.8 |
76.4 |
|
Farm income equal or greater |
28.5 |
18.7 |
11.4 |
15.5 |
|
Net worth of farm operated ($ per household)c |
$342,215 |
$461,407 |
$278,308 |
$331,506 |
|
NOTE: A "farm-operator household" is one that either works on the farm of makes day-to-day decisions about such things as planting, harvesting, feeding, and marketing. It may share the net worth of the farm with one or more other nonoperator farm households. a Includes off-farm business income not shown separately. b Net income from estates and trusts, rental income from nonfarm properties, royalties from mineral leases, retirement/disability income, annuities, alimony, regular contributions from persons not in the household, and any other miscellaneous sources of income. c Net worth may be shared with nonoperator farm households. SOURCE: Hoppe, R. A. 1994. Farming Operations and Households in Farming Areas: A Closer Look. Agricultural Economic Report No. 685. Washington, D.C.: U.S. Department of Agriculture, Economic Research Service. |
||||
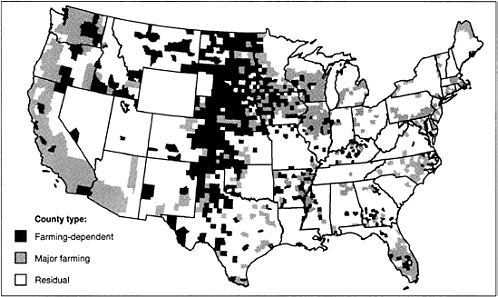
FIGURE 2-1
Dependence on income from farming is shown according to county types: farming-dependent, major farming, and residual. SOURCE: Hoppe, R. A. 1994. Farming Operations and Households in Farming Areas: A Closer Look. Agricultural Economic Report No. 685. Washington, D.C.: Economic Research Service, U.S. Department of Agriculture.
-
Table 2-6 shows that for almost 80 percent of farm-operator households, farm-related income is less than off-farm income. Off-farm income is least important (in relation to farm-related income) in farming-dependent counties, which are located predominately in the northern Midwest and Great Plains states and some parts of the Northwest (Figure 2-1).
-
Specialized production is another characteristic of the modern farm economy. Whereas decades ago farms may have been integrated production units producing a variety of crop and livestock products to meet home and local market needs, today they usually specialize in products that represent their region's "comparative advantage" in national and international markets. For example, more than 70 percent of total U.S. sales of corn, soybeans, and hogs derive from several midwest "corn belt" states; about 70 percent of poultry is produced in counties concentrated in six or seven southeastern states; and about 70 percent of tobacco is produced in counties concentrated in four to five eastern states (Table 2-7 and Figure 2-2).
-
In addition, the farm economies of some regions depend heavily on their regional production specialties. For example, the Great Plains counties that specialize in cattle, wheat, and sorghum count on these commodities for more than 80 percent of their farm sales; the poultry-specializing counties count on poultry for almost 70 percent of farm sales; and the dairy-specializing counties of the Northeast and Great Lakes states depend on dairy product sales for more than 55 percent of their farm sales (Table 2-7 and Figure 2-2).
TABLE 2-7
Production Specialization in the U.S. Farm Economy
|
Production Specialty/Specialty Group |
Number of Specializing Counties |
Percent of Total County-Cluster Farm Sales |
Percent of Total U.S. Sales of Commodity/Commodities |
|
Corn/soybeans/hogs |
508 |
64 |
72/73/71 |
|
Poultry |
248 |
66 |
68 |
|
Dairy |
164 |
56 |
42 |
|
Gattle/wheat/sorghum |
343 |
81 |
37/41/65 |
|
Tobacco |
135 |
37 |
69 |
|
Cattle (part-time) |
371 |
56 |
11 |
|
Fruit |
26 |
47 |
60 |
|
Other crops |
116 |
27 |
47 |
|
Vegetables/nursery |
86 |
38 |
63/70 |
|
Wheat/oats/other grain |
115 |
51 |
22/19/42 |
|
Cotton |
103 |
45 |
59 |
|
Sheep/cattle/other livestock |
75 |
73 |
39/4/32 |
|
Total counties |
2,290 |
|
|
|
SOURCE: Adapted from Sommer, J. E., and F. K. Hines. 1991. Diversity in U.S. Agriculture: A New Delineation by Farming Characteristics, AER No. 646. Washington, D.C.: Economic Research Service, U.S. Department of Agriculture. |
|||
Across the nation, agricultural interests and concerns vary from one constituent group to another and from one state to another.
-
Vertical integration—a system that combines previously separated stages of the production and delivery system in a single firm—is increasing in some areas of the United States, particularly areas specializing in swine and poultry production. Vertical integration can take a number of forms but may typically involve contractual relationships between the "integrators" and the producers. The trend toward vertical integration results from a number of factors including advances in food technology and greater globalization of agricultural production and trade. In the case of pork, for example, the process of engineering the final product to meet specific consumer demands begins at the hog production level. Vertical integration also assures processors a steady supply of inputs so that they can consistently utilize their plants at optimum capacity and seek expansions in product markets (Council on Food, Agricultural, and Resource Economics, 1994).
-
The above described changes in U.S. farming do not diminish the economic importance of the agriculture complex to the United States. The food and fiber sector of the domestic economy is large, accounting for 18 percent of U.S. employment and about 16 percent of "value added" to domestic production (Table 2-8). Most employment and value added production occurs beyond the farm gate—in food processing, manufacturing, transportation, and retailing in stores and in restaurants—but farm production underpins all these non-farm activities. Furthermore, the forestry sector, which is intertwined with farming in some parts of the country, accounts for another 5 percent of the value of national economic output (U.S. Department of Agriculture, 1990a).
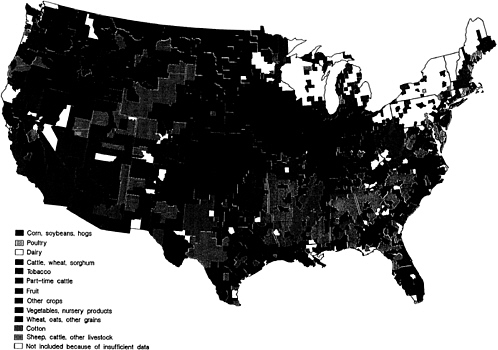
FIGURE 2-2
Map shows patterns of agricultural specialization, by multicounty cluster, based on twelve individual commodities or commodity groups. SOURCE: Sommer, J. E., and F. K. Hines. 1991. Diversity in U.S. Agriculture: A New Delineation by Farming Characteristics, AER No. 646. Washington, D.C.: Economic Research Service, U.S. Department of Agriculture.
TABLE 2-8
The Food and Fiber Sector's Contribution to the U.S. Economy, 1982–1992
|
|
Year |
||||||||||
|
Item |
1982 |
1983 |
1984 |
1985 |
1986 |
1987 |
1988 |
1989 |
1990 |
1991 |
1992 |
|
Millions of Workers |
|||||||||||
|
Employment |
|||||||||||
|
Total food and fiber |
22.9 |
23.0 |
22.6 |
22.3 |
22.4 |
22.4 |
22.7 |
23.4 |
23.5 |
23.2 |
22.8 |
|
Farm sector |
2.4 |
2.8 |
2.3 |
2.0 |
2.0 |
2.0 |
2.0 |
2.0 |
2.1 |
2.0 |
2.0 |
|
Nonfarm sectors |
20.5 |
20.2 |
20.3 |
20.2 |
20.3 |
20.5 |
20.6 |
21.4 |
21.4 |
21.2 |
20.8 |
|
Food processing |
1.7 |
1.6 |
1.6 |
1.6 |
1.6 |
1.6 |
1.5 |
1.5 |
1.5 |
1.5 |
1.5 |
|
Manufacturing |
3.6 |
3.5 |
3.4 |
3.3 |
3.2 |
3.1 |
3.0 |
3.2 |
3.1 |
3.1 |
3.0 |
|
Transportation, trade and retailing |
7.2 |
7.2 |
7.3 |
7.4 |
7.5 |
7.5 |
7.6 |
7.9 |
8.0 |
7.9 |
7.8 |
|
Eating |
4.6 |
4.7 |
4.7 |
4.7 |
4.8 |
5.0 |
5.2 |
5.3 |
5.4 |
5.3 |
5.2 |
|
All other |
3.4 |
3.2 |
3.2 |
3.2 |
3.2 |
3.2 |
3.3 |
3.5 |
3.5 |
3.5 |
3.4 |
|
Total domestic economy |
110.2 |
111.6 |
113.5 |
115.5 |
117.8 |
119.9 |
121.7 |
123.9 |
124.8 |
125.3 |
127.0 |
|
Percent of Total U.S. Labor Force |
|||||||||||
|
Farm sector |
2.1 |
2.5 |
2.0 |
1.8 |
1.7 |
1.6 |
1.7 |
1.6 |
1.7 |
1.6 |
1.6 |
|
Nonfarm sectors |
17.5 |
16.7 |
16.5 |
17.5 |
17.3 |
17.1 |
17.0 |
17.3 |
17.2 |
16.9 |
16.4 |
|
Total domestic economy |
100.0 |
100.0 |
100.0 |
100.0 |
100.0 |
100.0 |
100.0 |
100.0 |
100.0 |
100.0 |
100.0 |
|
$ Billions |
|||||||||||
|
Value added by activity |
|
|
|
|
|
|
|
|
|
|
|
|
Total food and fiber |
622.6 |
630.5 |
672.1 |
697.8 |
716.6 |
744.7 |
784.5 |
850.3 |
889.8 |
913.8 |
950.2 |
|
Farm sector |
58.7 |
40.9 |
55.5 |
58.5 |
52.6 |
53.0 |
49.7 |
65.2 |
68.1 |
63.4 |
67.0 |
|
Nonfarm sectors |
563.9 |
589.6 |
616.6 |
639.3 |
664.0 |
691.7 |
734.9 |
785.0 |
821.7 |
850.4 |
883.2 |
|
Food processing |
72.6 |
76.9 |
80.5 |
82.3 |
87.4 |
86.2 |
91.8 |
96.1 |
99.8 |
103.4 |
106.2 |
|
Manufacturing |
105.0 |
108.3 |
109.9 |
109.8 |
113.2 |
111.5 |
115.2 |
124.5 |
125.6 |
130.8 |
135.7 |
|
Transportation, trade and retailing |
187.2 |
193.2 |
201.2 |
208.9 |
212.0 |
222.5 |
235.7 |
247.2 |
257.4 |
265.6 |
277.5 |
|
Eating |
57.4 |
60.5 |
62.9 |
64.5 |
66.0 |
73.0 |
78.5 |
80.7 |
85.6 |
88.3 |
90.9 |
|
All other |
141.8 |
150.7 |
162.1 |
173.8 |
185.3 |
198.4 |
213.8 |
236.6 |
253.2 |
262.3 |
272.9 |
|
Total domestic economy |
3,149.6 |
3,405.0 |
3,777.2 |
4,038.7 |
4,268.6 |
4,539.9 |
4,900.4 |
5,250.8 |
5,546.1 |
5,722.9 |
6,038.5 |
|
Percent of Total U.S. Economy |
|||||||||||
|
Farm sector |
1.9 |
1.2 |
1.5 |
1.4 |
1.2 |
1.2 |
1.0 |
1.2 |
1.2 |
1.1 |
1.1 |
|
Nonfarm sectors |
17.9 |
17.3 |
16.3 |
15.8 |
15.6 |
15.2 |
15.0 |
15.0 |
14.8 |
14.9 |
14.6 |
|
Total domestic economy |
100.0 |
100.0 |
100.0 |
100.0 |
100.0 |
100.0 |
100.0 |
100.0 |
100.0 |
100.0 |
100.0 |
|
SOURCE: Data are from USDA Economic Research Service (ERS). |
|||||||||||
-
The importance of agriculture to other aspects of U.S. life, though harder to measure, is no less important. The relationship between diet and human health, for example, is increasingly recognized by scientists and the general public. Heart disease, cancer, stroke, and diabetes—the four leading causes of death in the United States—have been linked to diet. According to some research, proper diet might forestall at least 20 percent of deaths, annually, from these four causes; other factors include genetic predisposition, smoking, and exercise. Hypertension, osteoporosis, and obesity, which affect productivity and life span, are also diet-related (Frazão, 1995). Also, increasingly recognized is the fact that farmers own or manage the majority of privately held land and thus de facto manage the associated natural resources including watersheds and wildlife.
-
The ways in which states differ may be significant to the future of the colleges of agriculture. Characteristics of states' farm sectors differ; the role of agriculture in state economies differs, as do the interfaces between agriculture and other state land uses. Characteristics of states' population sectors differ; the importance of rural, suburban, and urban constituencies varies as do the income levels and age and ethnic demographics of each state's communities.
TABLE 2-9
Total Cash Receipts (thousands of dollars) from Farming, 1990
-
Each state's unique blend of characteristics causes each to contribute differently to the U.S. farm economy. Three states, California, Texas, and Iowa, account for nearly one-quarter of the national value (cash receipts) of farm marketings (Table 2-9). These together with Nebraska and Illinois yield more than one-third of total marketed U.S. farm output, although other states, as noted above, are vitally important for specific types of crop or livestock production.
-
Despite the fact that these states are major contributors to national farm output, for California, Texas, and Illinois farm marketing receipts amount to only 3 percent of gross state product. On the other hand, in Iowa and Nebraska farm marketings equal 18 and 26 percent, respectively, of the value of gross state product. Across the country, only eight states generate more than 10 percent of their gross state product from farming, with Nebraska, North Dakota, and South Dakota (wheat producing states) being the most dependent on farm income (Table 2-9). (For a discussion of methodological issues in developing conceptually consistent measures of the role of agriculture in state economies, see Leones et al., 1994.)
-
Across the nation farming rarely provides significant state employment opportunities in relation to other industries. Only North and South Dakota employ more than 10 percent of their labor force in farm jobs. However, many if not most states look to farm-related industries, mostly the wholesale and retail trades, to provide a significant share of state employment. The agricultural processing and marketing industry is particularly important to employment in several southern states (Table 2-10).
-
Today the population of most states is significantly urban, and the farm sector has decreased proportionately; however, the size of the state's farm sector may have little bearing on the prominence of rural communities. For example, California, Texas, Florida, and Illinois, and to a lesser extent Minnesota and Wisconsin, are all large contributors to national farm production but are predominately urban states. (See Appendix Table 1 for a breakdown, by state, of the distribution of the U.S. population.) This contrast may suggest significant state pressures to balance urban and farm interests. Allocation of water in western states, particularly California, is one of the most prominent examples of competing farm and urban needs. Establishing animal production facilities near urban and suburban areas constitutes another area of friction between urban population and the farming sector in some states.
-
Some states have significant rural populations—like Delaware, Maine, and Vermont—but small farm sectors that contribute minimally to either national or state farm output. For these states, rural community and economic development issues may diverge significantly from farm issues. A few states, such as Idaho, Iowa, South Dakota, North Dakota, and Montana, have both large rural populations and large farm sectors that contribute significantly to the state economy (Table 2-8 and see Appendix Table 1). In these states, rural and farm issues may still be closely intertwined.
-
At the same time that the agricultural concerns and priorities of local communities and individual states are changing, U.S. agriculture and its needs are increasingly shaped by international forces. For example, recent international accords like the North American Free Trade Agreement and those reached under the auspices of the General Agreement on Tariffs and Trade increase the integration of U.S. agriculture into global commodity and food markets and may limit the use of trade policies and subsidies to protect agriculture from international competition. In this environment, U.S. agriculture looks to other countries for new customers for its products and to science and technology for ways to stay ahead in intensely competitive markets. Also, while U.S. agriculture contributes, along with the agricultural industries of other nations, to today's abundant world food supplies, rapid world population growth leads many to stress the importance of sustaining and enhancing the productivity of the world's food-producing resources.
TABLE 2-10
U.S. Employment on Farms and in Farm-Related Industries, by State, 1990
ISSUES FOR DISCUSSION
-
How have the dramatic changes in the U.S. economy—particularly in the role of farming—affected the interests of U.S. citizens in the services of the land grant colleges of agriculture? In particular, how are the interests of urban, suburban, and non-farm rural residents shaping the programs and priorities of colleges of agriculture?
-
Although consumers have clearly benefited from agricultural science and technology, many perceive farmers to be the colleges' ''traditional'' clientele; but what type of farmer does today's and tomorrow's college serve? Are the needs and priorities of large commercial entities and vertically integrated operations the same as those of smaller, part-time, limited resource, or hobby farmers?
-
Over time, states have become increasingly diverse with respect to the roles of farming, agribusiness, and rural communities and the way in which agricultural issues interact with other state issues. Are colleges of agriculture differently adapting their programs to the particular needs of their states?
-
What is the role of the land grant colleges of agriculture in working with farmers and agricultural firms in adapting to increasingly open and competitive world markets? As global populations and food needs continue to grow, what is the role of U.S. colleges in contributing to the productivity and sustainability of agriculture world wide?
SUGGESTED READINGS
Alston, Julian M., Philip G. Pardey, and Harold O. Carter, eds. Valuing UC Agricultural Research and Extension. Davis: University of California, 1994.
Caswell, Margriet, Keith O. Fuglie, and Cassandra A. Klotz. Agricultural Biotechnology: An Economic Perspective, AER No. 687. Washington, D.C.: Economic Research Service, U.S. Department of Agriculture, 1994.
Cochrane, Willard W. The Development of American Agriculture: An Historical Analysis. Minneapolis: University of Minnesota Press, 1979.
Dacquel, Laarni T., and Donald C. Dahmann. Residents of Farms and Rural Areas: 1991, U.S. Bureau of the Census, Current Population Reports Series P20, No. 472. Washington, D.C.: U.S. Government Printing Office, 1993.
Dahmann, Donald C., and Laarni T. Dacquel. Residents of Farms and Rural Areas: 1990, U.S. Bureau of the Census, Current Population Reports Series P-20, No. 457. Washington, D.C.: U.S. Government Printing Office, 1992.
Dodson, Charles B. Profitability of Farm Businesses: A Regional, Farm Type, and Size Analysis, Statistical Bulletin No. 884. Washington, D.C.: Economic Research Service, U.S. Department of Agriculture, 1994.
Frazão, Elizabeth. Consumer Concerns About Nutrition: Opportunities for the Food Sector, AIB No. 705. Washington, D.C.: Economic Research Service, U.S. Department of Agriculture, 1994.
Hoppe, Robert A. Farming Operations and Households in Farming Areas: A Closer Look, AER No. 685. Washington, D.C.: Economic Research Service, U.S. Department of Agriculture, 1994.
Leones, Julie, Gerald Schulter, and George Goldman. "Redefining agriculture in interindustry analysis." American Journal of Agricultural Economics 76(December 1994):1123-1129.
Kennedy, Eileen, and Howarth E. Boui. Linkages Between Agriculture and Nutrition: Implications for Policy and Research. Washington, D.C.: International Food Policy Research Institute, 1993.
National Research Council. Alternative Agriculture. Washington, D.C.: National Academy Press, 1989.
National Research Council. Pesticides in the Diets of Infants and Children. Washington, D.C.: National Academy Press, 1993.
Peterson, R. Neal, and Nora L. Brooks. The Changing Concentration of U.S. Agricultural Production During the 20th Century, AIB No. 671. Washington, D.C.: Economic Research Service, U.S. Department of Agriculture, 1993.
Pinstrup-Andersen, Per. World Food Trends and Future Food Security . Washington, D.C.: International Food Policy Research Institute, 1994.
Sommer, Judith E., and Fred K. Hines. Diversity in U.S. Agriculture: A New Delineation by Farming Characteristics, AER No. 646. Washington, D.C.: Economic Research Service, U.S. Department of Agriculture, 1991.
Vandeman, Ann, Jorge Fernandez-Cornejo, Sharon Jans, and Biing-Hwan Lin. Adoption of Integrated Pest Management in U.S. Agriculture, AIB No. 707. Washington, D.C.: Economic Research Service, U.S. Department of Agriculture, 1994.


