
3
THE COLLEGES OF AGRICULTURE: Academic Programs and Demographics of Students and Graduates
This chapter introduces the first of the land grant colleges' functions, that of academic instruction. It draws on data collected, compiled, and maintained by the Food and Agricultural Education Information System (FAEIS), which is supported by the U.S. Department of Agriculture and managed by Texas A&M University, to report trends in student enrollment and graduates, student demographics, and the types of agriculture-related degrees of most interest to students at different stages of training. This chapter also utilizes the results of a survey of Ph.D. scientists, conducted by the National Research Council's Office of Scientific and Engineering Personnel, to compare employment and demographic characteristics of agricultural scientists to those of all other scientists.
-
When the Morrill Act of 1862 was enacted, the framers undoubtedly intended that a teacher would be hired by the college to teach practical skills in farming and the mechanical arts. In keeping with the tradition of the European educational system, that would mean hiring a "professor of agriculture"—someone with extensive, broad-based knowledge of the subject—to lead a cadre of support staff to help carry out the teaching function. Although this model had worked well in such fields as theology, philosophy, law, medicine, and the classics, it did not fit the needs of U.S. agriculture. The simplest reason for why it did not is that the expertise needed for animal-based agriculture is very different than the expertise needed for plant-based agriculture.
-
In 1862 there were virtually no persons trained either in agriculture or in the sciences relating to agriculture; and so the colleges, often by trial and error, had to develop their own faculty members, sometimes by recruiting highly skilled farmers. Although these farmers had expertise in animal or crop production, they did not have the requisite expertise in both. Consequently, from the outset, land grant colleges began to move from the generalist in agriculture to the specialist in agriculture. With this move came the need for more involvement from more people.
-
By the end of the 19th century most colleges of agriculture already had several departments in their administrative structure. In the 20th century the degree of specialization, and the number of specialists, increased exponentially as the knowledge base expanded (in large part as the result of the Hatch Act, which established a research function in the agricultural experiment station). It became necessary to teach increasingly specialized courses not only to undergraduate students, but most particularly to the graduate students who would soon be in a position to make practical use of this new knowledge base both in the field and as teachers and researchers. Consequently, there was an explosion of curricula, majors, and options—and people—with a high degree of specialization (see box copy, p. 36).
-
The trend toward increasing specialization, with its consequent increase in organizational structuring to accommodate curricula, majors, and options, continued until recently when it was recognized that issues facing society are exceedingly complex and require interdisciplinary teams to work on solutions. That realization is causing reorganization within many colleges of agriculture and the creation of interdisciplinary programs, centers, and institutes. Examples of this are degree programs in environmental sciences, centers for sustainable agriculture, and centers for biotechnology. These centers can exist as hard-wall entities (where faculty is brought together in one building), but many are instituted as soft-wall centers (where faculty is disbursed in various academic departments but come together for programmatic needs). Integration of such disciplines as animal science, horticulture, agronomy, plant pathology, entomology, natural resources, agricultural economics, and rural sociology, among others, may play an important role in the future of U.S. agriculture and of the land grant system.
-
Higher education in agriculture, food, and natural resource sciences is supported by USDA grants. The major education grants administered by the USDA Office of Higher Education include: the higher education challenge grants program ($4 million in 1995); the higher education multicultural scholars program ($1 million in 1995); the 1890 institution capacity building grants program (about $9 million in 1995); and the USDA food and agricultural sciences national needs graduate fellowship grants program ($3.5 million in 1995) (National Association of State Universities and Land-Grant Colleges, 1995).
Land grant colleges of agriculture account for about 1 percent of all students enrolled at public institutions of higher education, but for higher percentages at land grant universities.
|
Academic Specializations in Agriculture, Forestry, and Renewable Natural Resources
|
||||||||||||||||||||||||||||
|
||||||||||||||||||||||||||||||||||||||||||||
ENROLLMENT: LAND GRANT VERSUS NON-LAND GRANT
-
In the fall of 1991 there were approximately 10 million undergraduates and 1 million graduate students (both full and part time) enrolled in U.S. public institutions of higher education (U.S. Department of Education, 1993). Between 80 and 85 thousand of these undergraduates (<1 percent) and about 22 thousand graduate students (2 percent) were enrolled at land grant colleges of agriculture (Table 3-1).1
TABLE 3-1
Fall Enrollment, by Degree Program, at Land Grant Colleges of Agriculture, 1984–1993
-
In contrast to these aggregate data, at many land grant universities enrollment in colleges of agriculture is a larger percentage of university-wide or campus-wide enrollment. For example, at the University of California, Davis—the most "agricultural" of the University of California campuses—in the early 1990s about 25 percent of campus enrollment was in the college of agriculture. At North Carolina State University, enrollment in the college of agriculture was about 13 percent of university-wide enrollment; at Mississippi State it was about 10 percent. At the University of Illinois and the Pennsylvania State University, college of agriculture enrollment was 6 to 7 percent of university enrollment (U.S. Department of Education, 1993).
-
As noted in Chapter 1, some non-land grant colleges and universities also have agriculture schools or colleges. In the fall of 1993, nationwide enrollment in all colleges of agriculture, renewable natural resources, and forestry comprised more than 137,000 students, 80 percent of whom were enrolled in the land grant colleges of agriculture (Food and Agricultural Education Information System, 1994; Table 3-1).
-
Although total enrollment at public colleges and universities increased steadily from the mid-1980s through the early 1990s, land grant colleges of agriculture struggled to keep students (U.S. Department of Education, 1993). For example, enrollment in the colleges' bachelor's degree programs fell off sharply between 1984 and 1986 but recovered fully by 1992 (Table 3-1). Most colleges went on to report higher enrollment in 1993 than in 1992 (Table 3-2).
TABLE 3-2 Fall Enrollment, by Region, at Land Grant Colleges of Agriculture, 1990 and 1992
|
|
Undergraduate |
Graduate |
||
|
University |
1990 |
1992 |
1990 |
1992 |
|
North-Central |
||||
|
Southern Illinois State U. |
700 |
788 |
98 |
104 |
|
U. of Illinois |
1,815 |
1,897 |
595 |
629 |
|
Purdue U. |
1,839 |
2,042 |
439 |
516 |
|
Iowa State U. |
2,248 |
2,392 |
635 |
797 |
|
Kansas State U. |
1,440 |
1,634 |
367 |
406 |
|
Michigan State U. |
2,507 |
2,521 |
682 |
782 |
|
U. of Minnesota |
747 |
1,253 |
507 |
517 |
|
U. of Missouri |
1,648 |
1,846 |
417 |
411 |
|
Lincoln U. |
NR |
184 |
NR |
0 |
|
North Dakota State U. |
NR |
738 |
NR |
169 |
|
U. of Nebraska |
1,139 |
1,344 |
478 |
366 |
|
The Ohio State U. |
1,880 |
1,694 |
517 |
555 |
|
South Dakota State U. |
1,077 |
1,440 |
190 |
212 |
|
U. of Wisconsin, Madison |
1,889 |
2,025 |
1,227 |
1,256 |
|
Regional total |
18,929 |
21,798 |
6,152 |
6,720 |
|
Northeastern |
||||
|
U. of Connecticut |
421 |
550 |
144 |
161 |
|
U. of Delaware |
627 |
605 |
61 |
105 |
|
Delaware State U. |
64 |
82 |
0 |
0 |
|
U. of Massachusetts |
1,872 |
2,192 |
408 |
428 |
|
U. of Maryland |
830 |
795 |
267 |
251 |
|
U. of Maryland, Eastern Shore |
92 |
147 |
18 |
12 |
|
U. of Maine, Orono |
636 |
651 |
0 |
49 |
|
U. of New Hampshire |
1,158 |
1,587 |
186 |
184 |
|
Rutgers—The State U. of New Jersey |
2,862 |
2,908 |
560 |
604 |
|
Cornell U. |
3,029 |
3,081 |
1,085 |
1,128 |
|
The Pennsylvania State U. |
1,912 |
2,194 |
358 |
415 |
|
U. of Rhode Island |
664 |
808 |
190 |
0 |
|
U. of Vermont |
787 |
724 |
83 |
84 |
|
West Virginia U. |
1,170 |
1,319 |
181 |
190 |
|
Regional total |
16,124 |
17,643 |
3,541 |
3,611 |
|
Southern |
||||
|
Auburn U. |
512 |
645 |
248 |
282 |
|
Alabama A&M U. |
339 |
357 |
109 |
167 |
|
U. of Arkansas, Pine Bluff |
340 |
196 |
0 |
1 |
|
U. of Arkansas, Fayetteville |
795 |
868 |
285 |
270 |
|
U. of Florida |
1,049 |
1,377 |
695 |
457 |
|
Florida A&M U. |
NR |
146 |
NR |
21 |
|
U. of Georgia |
913 |
1,031 |
241 |
247 |
|
U. of Guam |
13 |
14 |
0 |
0 |
|
U. of Kentucky |
745 |
890 |
276 |
259 |
|
Louisiana State U. |
1,028 |
1,008 |
564 |
463 |
|
Southern U. |
NR |
287 |
NR |
0 |
|
Mississippi State U. |
1,070 |
1,104 |
313 |
354 |
|
Alcorn State U. |
100 |
150 |
0 |
33 |
|
North Carolina State U. |
2,677 |
3,034 |
707 |
742 |
|
North Carolina A&T U. |
239 |
NR |
61 |
NR |
|
Oklahoma State U. |
1,187 |
1,327 |
297 |
356 |
|
Langston U. |
28 |
34 |
0 |
0 |
|
U. of Puerto Rico |
552 |
577 |
76 |
97 |
|
Clemson U. |
541 |
821 |
232 |
309 |
-
Enrollment in doctorate programs increased steadily over the same period (Table 3-1). Nonetheless, graduate student enrollment in agricultural sciences has been losing ground versus other areas of science. In 1981 graduate enrollment in agricultural sciences (not including agricultural economics or agricultural engineering) accounted for 4 percent of graduate enrollment in all sciences; by 1991 agricultural science's share had dropped to 3 percent. Graduate enrollment in agricultural engineering also declined as a percent of enrollment in all engineering during this same period (U.S. Department of Education, 1993).
-
USDA has divided the states according to four major geographic regions—northeastern, north-central, southern, and western (Figure 3-1). The largest percentages of land grant college of agriculture students are in the north-central region, the "farm belt," and in the southern region. Each of the four regions, however, contributes to total national enrollment at colleges of agriculture. In 1992 no region contributed less than 17 percent of either graduate or undergraduate students (Figure 3-2).
Enrollment at land grant colleges of agriculture is concentrated at a few large institutions.
-
In 1992, 39 percent of reported enrollment at the undergraduate level was concentrated in ten land grant colleges of agriculture (Table 3-3); four of these are in the northeastern region. More than 40 percent of graduate student enrollment was concentrated in a slightly different list of ten land grant colleges (Table 3-4). Overall, less than 15 percent of the schools enroll 40 percent of the land grant college of agriculture students.
-
In 1993 women composed 37.5 percent of undergraduates and 35 percent of graduate students in agricultural programs at land grant colleges of agriculture. In contrast, at all U.S. institutions of higher education, more than one-half of both undergraduate and graduate students are women (U.S. Department of Education, 1993). Women are significantly better represented in the agriculture colleges' "other" programs, which include principally home economics but also chemistry, geology, geography, psychology, sociology, statistics, etc. (Table 3-5).
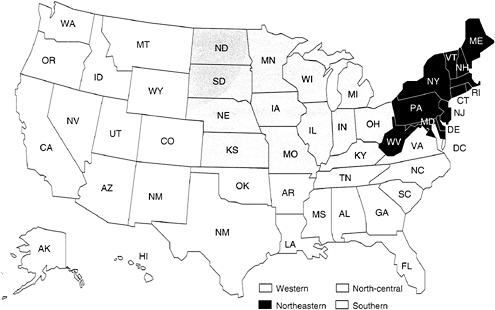
FIGURE 3-1
The four geographic regions of the United States, as determined by USDA.
Women and ethnic minorities constitute smaller percentages of enrollment at land grant colleges of agriculture than at all institutions of higher education.
-
Ethnic minorities—including African-Americans, Asian-Americans, Hispanic-Americans, and Native Americans—represent a small, though recently growing, percentage of land grant college of agriculture enrollment—about 10 percent in 1993 versus 5 percent in 1984 (Table 3-5). About 20 percent of ethnic minorities pursuing bachelor degrees attend the 1890 institutions (FAEIS, 1994). At all U.S. institutions of higher education, ethnic minorities account for slightly more than 20 percent of undergraduates and about 14 percent of graduate students (U.S. Department of Education, 1993).
-
Students who are not U.S. citizens make a significant contribution to enrollment at the colleges of agriculture, but mostly at the graduate level. In 1993 (the only year for which data is currently available) more than one-fourth of graduate students were citizens of other countries, suggesting that colleges of agriculture may contribute significantly to the development of the human capital of other nations (Table 3-5).
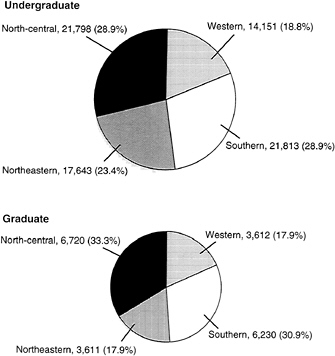
FIGURE 3-2
The regional breakdown of undergraduate enrollment at land grant colleges of agriculture in the fall of 1992 shows nearly 60 percent of undergraduate enrollment evenly distributed between the north-central and southern regions. At the graduate level, the north-central and southern regions share 64 percent of the total enrollment.
TABLE 3-3
The Ten Land Grant Colleges of Agriculture Leading in Total College of Agriculture Undergraduate Enrollment, Fall 1992
|
|
Including Other Programs and Excluding Separately Administered Schools and Colleges of Forestry |
Excluding Other Programs and Separately Administered Schools and Colleges of Forestry |
Including Separately Administered Schools and Colleges of Forestry, Excluding Other Programs |
|||
|
University |
Number |
Percenta |
Number |
Percenta |
Number |
Percenta |
|
U. California, Davis |
5,026 |
7 |
3,552 |
5 |
3,552 |
5 |
|
Texas A&M U. |
3,927 |
5 |
3,927 |
6 |
3,927 |
6 |
|
Cornell U. |
3,081 |
4 |
3,081 |
5 |
3,081 |
4 |
|
North Carolina State U. |
3,034 |
4 |
2,374 |
4 |
3,022 |
4 |
|
Rutgers—The State U. of New Jersey |
2,908 |
4 |
1,555 |
2 |
1,555 |
2 |
|
Michigan State U. |
2,521 |
3 |
2,141 |
3 |
2,141 |
3 |
|
Iowa State U. |
2,392 |
3 |
2,392 |
4 |
2,392 |
3 |
|
Pennsylvania State U. |
2,194 |
3 |
2,194 |
3 |
2,194 |
3 |
|
U. of Massachusetts |
2,192 |
3 |
1,406 |
2 |
1,406 |
2 |
|
Purdue U. |
2,042 |
3 |
2,042 |
3 |
|
|
|
Subtotal |
29,317 |
39 |
24,664 |
37 |
25,312 |
36 |
|
Totalb |
75,850 |
NA |
66,452 |
NA |
71,270 |
NA |
|
NOTE: ''Other'' programs include any nonagricultural programs offered by the college of agriculture such as home economics, statistics, sociology, chemistry, geology, geography, psychology, etc. a Percent of all undergraduate students at all reporting colleges of agriculture. b Total of undergraduates at all reporting colleges of agriculture. SOURCE: S. S. Whatley, Project Coordinator, Food and Agricultural Education Information System, 1994, personal communication. |
||||||
TABLE 3-4
The Ten Land Grant Colleges of Agriculture Leading in Total College of Agriculture Graduate Enrollment, Fall 1992
|
|
Including Other Programs and Excluding Separately Administered Schools and Colleges of Forestry |
Excluding Other Programs and Separately Administered Schools and Colleges of Forestry |
Including Separately Administered Schools amd Colleges of Forestry and Excluding Other Programs |
|||
|
University |
Number |
Percenta |
Number |
Percenta |
Number |
Percenta |
|
U. of Wisconsin |
1,256 |
6 |
1,242 |
7 |
1,242 |
6 |
|
Texas A&M U. |
1,254 |
6 |
1,254 |
7 |
1,254 |
6 |
|
Cornell U. |
1,128 |
6 |
1,128 |
6 |
1,128 |
5 |
|
U. of California, Davis |
1,098 |
5 |
994 |
5 |
994 |
5 |
|
Iowa State U. |
797 |
4 |
797 |
4 |
979 |
5 |
|
Michigan State U. |
782 |
4 |
774 |
4 |
774 |
4 |
|
North Carolina State U. |
742 |
4 |
742 |
4 |
922 |
4 |
|
U. of Illinois |
557 |
3 |
557 |
3 |
557 |
3 |
|
Rutgers—The State U. of New Jersey |
604 |
3 |
392 |
2 |
392 |
3 |
|
The Ohio State U. |
555 |
3 |
555 |
3 |
554 |
3 |
|
Subtotal |
8,845 |
44 |
8,479 |
44 |
8,659 |
42 |
|
Totalb |
20,173 |
NA |
19,203 |
NA |
20,745 |
NA |
|
NOTE: "Other" programs include any nonagricultural programs offered by the college of agriculture such as home economics, statistics, sociology, chemistry, geology, geography, psychology, etc. a Percent of all graduate students at all reporting colleges of agriculture. b Total of graduate students at all reporting colleges of agriculture. SOURCE: S. S. Whatley, Project Coordinator, Food and Agricultural Education Information System, 1994, personal communication. |
||||||
TABLE 3-5
Fall Enrollment, by Degree Program, of Female, Ethnic Minority, and Foreign Students at Land Grant Colleges of Agriculture, 1984–1993
|
|
1984 |
|
1986 |
|
1990 |
|
|
Degree Program |
Females |
Ethnic Minorities |
Females |
Ethnic Minorities |
Females |
Ethnic Minorities |
|
Bachelor's |
|
|
|
|
|
|
|
Agricultural |
22,836 (32.1) |
2,683 (3.8) |
22,144 (35.0) |
2,684 (4.2) |
24,491 (36.9) |
4,195 (6.3) |
|
Other |
6,648 (65.4) |
1,073 (10.6) |
6,210 (71.1) |
982 (71.1) |
6,892 (69.7) |
1,439 (14.6) |
|
Subtotal |
29,484 (36.2) |
3,756 (4.6) |
28,354 (39.4) |
3,666 (5.1) |
31,383 (41.1) |
5,634 (7.4) |
|
Graduate |
|
|
|
|
|
|
|
Agricultural |
5,949 (27.0) |
1,168 (5.3) |
6,347 (28.3) |
1,119 (5.0) |
6,726 (32.2) |
1,812 (8.7) |
|
Other |
45 (46.6) |
40 (4.1) |
413 (52.0) |
44 (5.5) |
470 (57.3) |
127 (15.5) |
|
Subtotal |
6,408 (27.8) |
1,208 (5.2) |
6,760 (29.1) |
1,163 (5.0) |
7,196 (33.2) |
1,939 (8.9) |
|
NOTE: Number in parentheses is the percent of females and ethnic minorities compared with total student enrollment in each degree program. Total student enrollment figures are reported in Table 3-1. "Other" includes any nonagricultural program offered by the college of agriculture such as chemistry, geography, geology, home economics, psychology, sociology, statistics, etc. SOURCE: Data are from the Food and Agricultural Education Information System (FAEIS). |
||||||
TABLE 3-6
Graduates in Agriculture, Food, and Natural Resources, from All Degree Programs, by Region and Institution Classification, 1992
|
Region |
1862s |
1890s |
Non-Land Grants |
All Institutions |
|
North-central |
6,325 |
16 |
1,106 |
7,447 |
|
Northeastern |
5,071 |
27 |
521 |
5,619 |
|
Southern |
5,565 |
432 |
1,728 |
7,725 |
|
Western |
4,339 |
0 |
1,463 |
5,802 |
|
Total |
21,300 |
475 |
4,818 |
26,593 |
|
SOURCE: Data are from the Food and Agricultural Education Information System (FAEIS). |
||||
-
Since the inception of colleges of agriculture, the science of agriculture has taken on a myriad of specializations. Although land grant universities—and principally their colleges of agriculture—grant most U.S. degrees in agriculture, food, and natural resources, non-land grant schools also grant a significant number of agriculture-related degrees, particularly in the southern and western regions (Table 3-6; Figure 3-3).
-
In 1992, of all students graduating from all degree programs in the food, agriculture, and natural resources disciplines, 73 percent received bachelor's degrees (Figure 3-3). Natural resources and agricultural business and management (especially agricultural economics) accounted for nearly 40 percent of all bachelor's degrees issued (Table 3-7). Bachelor's degrees in animal science were also popular, probably because of the higher demand for admission to veterinary medicine colleges. Non-land grant schools granted 21 percent of all the bachelor's degrees (Table 3-8).
|
|
1992 |
|
|
1993 |
|
|
|
Degree Program |
Females |
Ethnic Minorities |
|
Females |
Ethnic Minorities |
Foreign Students |
|
Bachelor's |
|
|
|
|
|
|
|
Agricultural |
26,809 (37.4) |
5,462 (7.6) |
|
29,351 (37.5) |
8,350 (10.7) |
1,095 (1.4) |
|
Other |
5,418 (57.7) |
1,184 (12.6) |
|
4,054 (62.2) |
90 (13.8) |
147 (2.3) |
|
Subtotal |
32,227 (39.7) |
6,646 (8.2) |
|
33,405 (39.4) |
9,251 (10.9) |
1,242 (1.5) |
|
Graduate |
|
|
|
|
|
|
|
Agricultural |
7,166 (34.4) |
1,792 (8.6) |
|
7,653 (35.1) |
2,069 (9.5) |
5,669 (26.0) |
|
Other |
683 (70.4) |
100 (10.3) |
|
427 (56.9) |
82 (10.9) |
154 (20.5) |
|
Subtotal |
7,849 (36.0) |
1,892 (8.7) |
|
8,080 (35.9) |
2,151 (9.5) |
5.823 (25.8) |
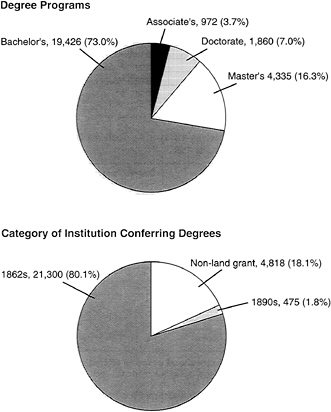
FIGURE 3-3
Of all degrees conferred in agriculture, food, and natural resources in 1992, non-land grants conferred slightly more than 18 percent and bachelor degrees accounted for nearly three-quarters.
TABLE 3-7
Number of Graduates in Various Agriculture Disciplines, by Degree Program, from All Institutions, 1992
|
|
Degree |
||||
|
Disciplinea |
Associate's |
Bachelor's |
Master's |
Doctorate |
All Degree Programs |
|
General agriculture |
59 |
681 |
128 |
1 |
869 |
|
Animal sciences |
183 |
2,653 |
443 |
230 |
3,509 |
|
Plant sciences |
445 |
2,020 |
698 |
438 |
3,601 |
|
Soil sciences |
12 |
116 |
102 |
76 |
306 |
|
Agricultural business and management |
120 |
3,324 |
484 |
122 |
4,050 |
|
Social sciences |
4 |
962 |
359 |
81 |
1,406 |
|
Natural resources |
62 |
3,825 |
1,030 |
283 |
5,200 |
|
Agricultural engineering/mechanization |
16 |
493 |
134 |
67 |
710 |
|
Food sciences |
27 |
1,463 |
453 |
195 |
2,138 |
|
Related sciences |
1 |
1,493 |
288 |
334 |
2,116 |
|
Other |
43 |
2,399 |
216 |
33 |
2,691 |
|
Total |
972 |
19,426 |
4,335 |
1,860 |
26,596 |
|
NOTE: "Other" includes any nonagricultural program offered by the college of agriculture such as chemistry, geography, geology, home economics, psychology, sociology, statistics, etc. "Natural resources" includes forest sciences. a The relationship between the number of graduates and the number of practicing professionals in each academic specialization is unclear. For example, compared to the large membership of soil science societies, a relatively small number of graduates now receive soil science degrees, according to FAEIS. Reasons for the discrepancy may include changes in degree classification, participation by other agricultural scientists in soil science organizations, and the relatively higher popularity of soil science degrees in earlier years. SOURCE: Data are from the Food and Agricultural Education Information System (FAEIS). |
|||||
TABLE 3-8
Percent of Degrees in Various Agriculture Disciplines Conferred by Non-Land Grant Universities, by Degree Program, 1992
More than 80 percent of graduates in agriculture, food, and natural resources receive their degrees at land grant universities, but non-land grant schools are important in some fields.
-
Master's degrees in natural resources accounted for one-quarter of the master's degrees issued (Table 3-7). The high number of master's degrees in natural resources may be because a master's degree is now forestry's first-level professional degree. In 1992 non-land grant schools granted about one-third of the natural resource degrees at the master's level (Table 3-8).
-
Students in doctorate programs have a different orientation; they are most numerous in plant sciences and "related" sciences such as botany and entomology. Natural resources, animal sciences, and food sciences are the next most populated disciplines at the doctorate level (Table 3-7). Non-land grant schools conferred only a small share of these doctorate degrees; in other words, producing Ph.D. agricultural scientists is the domain of the land grant colleges (Table 3-8).
-
From all degree programs, less than 5 percent of all graduates in 1992 received degrees labeled "general agriculture" or soil science (Table 3-7). More than 40 percent of the "general agriculture" degrees (which are mostly undergraduate degrees) were issued by non-land grant institutions (Table 3-8).
-
There is some regional specialization in academic fields, particularly at the doctorate level. For example, doctorate degrees in food science are a higher percentage in the northeast than in other parts of the country; while more doctorate degrees in natural resources are conferred in the west (Figure 3-4). "Related science" degrees are most significant (as a percent of all degrees) in the northeast and least significant in the south (see Appendix Table 2).
-
Across the country, colleges of agriculture offer many of the same agricultural science or other agriculture-related degree programs. For example, in 1991-1992 in the land grant system, there were 92 bachelor's degree programs in animal science and 50 at the doctorate level (Table 3-9). In plant sciences in that same academic year, there were 129 undergraduate degree programs including 35 in agronomy and 38 in horticulture (Table 3-9).
-
There was a slight decline between 1985 and 1992 in the number of degree programs in most agricultural and renewable natural resource specializations offered at land grant colleges of agriculture, particularly at undergraduate and master's degree levels (Figures 3-5 through 3-7).
-
Using Table 3-9 to more closely examine specific areas of specialization, data indicate a decline in the number of programs in traditional agricultural specializations like dairy and poultry science. Some colleges offer general animal science degrees as well as more specific degrees in dairy or poultry science. In most cases, these more specialized programs are being incorporated into the more general programs. The two-period comparison in Table 3-9 also suggests that some expansion is occurring in basic science degree programs and some natural resource specializations like water resources and wildlife management.
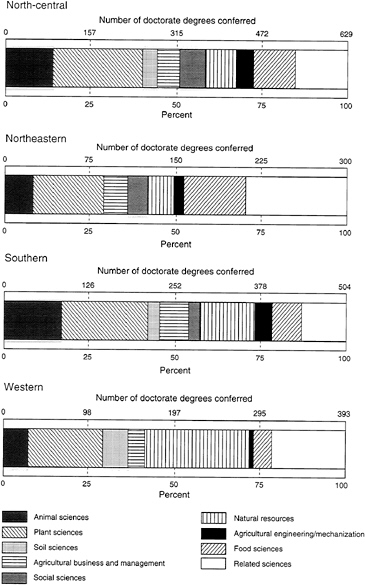
TABLE 3-9
Number of Degree Programs in Agricultural Science and Renewable Natural Resource Specializations at Land Grant Institutions, 1984–1985 and 1991–1992
|
|
Degree Program |
|||||
|
|
Bachelor's |
Master's |
Doctorate |
|||
|
Specialization |
1984–85 |
1991–92 |
1984–95 |
1991–92 |
1984–85 |
1991–92 |
|
Agricultural business and management |
|
|
|
|
|
|
|
Agricultural business/management, general |
12 |
11 |
2 |
1 |
1 |
1 |
|
Agricultural business |
16 |
16 |
2 |
1 |
0 |
0 |
|
Agricultural economics |
49 |
45 |
48 |
47 |
26 |
27 |
|
Farm and ranch management |
3 |
3 |
1 |
1 |
0 |
0 |
|
Agricultural business/management, other |
5 |
2 |
1 |
1 |
0 |
0 |
|
Agricultural products/processing, general |
0 |
1 |
1 |
2 |
1 |
2 |
|
Nonfood products |
0 |
0 |
0 |
0 |
0 |
0 |
|
Agricultural products/processing, other |
0 |
1 |
0 |
0 |
0 |
0 |
|
Floristry farm and garden supp, gen other |
0 |
0 |
0 |
0 |
0 |
0 |
|
Total |
90 |
84 |
63 |
60 |
31 |
36 |
|
Agricultural mechanics |
|
|
|
|
|
|
|
Agricultural mechanics, general |
17 |
15 |
4 |
3 |
0 |
0 |
|
Agricultural elect/power/controls |
0 |
0 |
0 |
0 |
0 |
0 |
|
Agricultural mech/const/maint skills |
0 |
0 |
0 |
0 |
0 |
0 |
|
Agricultural power machinery |
0 |
0 |
0 |
0 |
0 |
0 |
|
Agricultural structures/equipment/facilities |
0 |
0 |
0 |
0 |
0 |
0 |
|
Soil and water mechanical practices |
0 |
2 |
0 |
0 |
0 |
1 |
|
Agricultural mechanics, other |
2 |
3 |
1 |
1 |
0 |
0 |
|
Total |
19 |
20 |
5 |
4 |
0 |
1 |
|
Agricultural services and supplies |
|
|
|
|
|
|
|
Agricultural services and supplies, general |
1 |
0 |
0 |
0 |
0 |
0 |
|
Agricultural services |
0 |
1 |
0 |
0 |
0 |
0 |
|
Agricultural supplies marketing |
0 |
0 |
0 |
0 |
0 |
0 |
|
Agricultural services and supplies, other |
0 |
0 |
0 |
0 |
0 |
0 |
|
Total |
1 |
1 |
0 |
0 |
0 |
0 |
|
International agriculture |
3 |
3 |
1 |
1 |
0 |
0 |
|
Agricultural sciences |
|
|
|
|
|
|
|
Agricultural production, general |
1 |
1 |
1 |
1 |
0 |
0 |
|
Agricultural production, other |
0 |
0 |
0 |
1 |
0 |
0 |
|
Agricultural sciences, general |
34 |
33 |
12 |
9 |
1 |
1 |
|
Total |
35 |
34 |
13 |
11 |
1 |
1 |
|
Animal sciences |
|
|
|
|
|
|
|
Animal production |
1 |
0 |
1 |
1 |
0 |
0 |
|
Aquaculture |
0 |
2 |
1 |
1 |
1 |
1 |
|
Animal sciences, general |
56 |
57 |
48 |
45 |
28 |
31 |
|
Animal breeding and genetics |
1 |
0 |
1 |
2 |
1 |
2 |
|
Animal health |
1 |
2 |
2 |
2 |
1 |
1 |
|
Animal nutrition |
1 |
0 |
3 |
1 |
2 |
2 |
|
Animal physiology |
0 |
0 |
1 |
0 |
1 |
0 |
|
Dairy science |
15 |
12 |
14 |
12 |
6 |
4 |
|
Fisheries science |
4 |
0 |
3 |
0 |
3 |
0 |
|
Livestock science |
0 |
0 |
0 |
0 |
0 |
0 |
|
Poultry science |
15 |
13 |
15 |
7 |
8 |
6 |
|
Animal sciences, other |
4 |
6 |
3 |
5 |
2 |
3 |
|
Animal technology |
0 |
0 |
0 |
0 |
0 |
0 |
|
Total |
98 |
92 |
92 |
76 |
53 |
50 |
|
Food sciences |
|
|
|
|
|
|
|
Food products |
1 |
2 |
0 |
0 |
0 |
0 |
|
Food sciences, general |
27 |
33 |
26 |
31 |
19 |
25 |
|
Dairy processing |
3 |
0 |
0 |
0 |
0 |
0 |
|
Food distribution |
0 |
0 |
0 |
0 |
0 |
0 |
|
Food engineering |
0 |
0 |
1 |
0 |
1 |
0 |
|
Food packaging |
0 |
0 |
0 |
0 |
0 |
0 |
|
Food technology |
5 |
0 |
2 |
0 |
2 |
0 |
|
Food sciences, other |
2 |
0 |
2 |
0 |
2 |
0 |
|
Food processing technology |
0 |
1 |
0 |
0 |
0 |
0 |
|
Total |
38 |
36 |
31 |
31 |
24 |
25 |
|
|
Degree Program |
|||||
|
|
Bachelor's |
Master's |
Doctorate |
|||
|
Specialization |
1984–85 |
1991–92 |
1984–85 |
1991–92 |
1984–85 |
1991–92 |
|
Plant sciences |
|
|
|
|
|
|
|
Crop production |
0 |
1 |
1 |
2 |
1 |
1 |
|
Horticulture, general |
8 |
10 |
6 |
7 |
3 |
4 |
|
Arboriculture |
0 |
0 |
0 |
0 |
0 |
0 |
|
Floriculture |
0 |
5 |
0 |
3 |
0 |
1 |
|
Greenhouse operation and management |
0 |
0 |
0 |
0 |
0 |
0 |
|
Landscaping |
2 |
5 |
0 |
0 |
0 |
0 |
|
Nursery operation and management |
0 |
0 |
0 |
0 |
0 |
0 |
|
Turf management |
0 |
1 |
0 |
0 |
0 |
0 |
|
Horticulture, other |
1 |
1 |
0 |
0 |
1 |
1 |
|
Plant sciences, general |
16 |
13 |
11 |
8 |
5 |
9 |
|
Agronomy |
36 |
35 |
35 |
34 |
31 |
30 |
|
Horticulture |
29 |
28 |
28 |
27 |
17 |
19 |
|
Ornamental horticulture |
18 |
0 |
16 |
0 |
9 |
0 |
|
Plant breeding and genetics |
0 |
0 |
4 |
0 |
5 |
0 |
|
Plant pathology |
5 |
0 |
6 |
0 |
5 |
0 |
|
Plant physiology |
0 |
0 |
0 |
0 |
1 |
0 |
|
Plant protection (pest management) |
8 |
6 |
9 |
7 |
1 |
2 |
|
Range management |
12 |
12 |
10 |
9 |
7 |
6 |
|
Turf management science |
0 |
0 |
0 |
0 |
0 |
0 |
|
Plant sciences, other |
3 |
6 |
3 |
3 |
1 |
2 |
|
Plant genetics |
2 |
1 |
2 |
3 |
2 |
3 |
|
Plant pathology |
6 |
5 |
23 |
29 |
21 |
26 |
|
Plant physiology |
1 |
0 |
4 |
4 |
5 |
7 |
|
Total |
147 |
129 |
158 |
136 |
115 |
111 |
|
Soil sciences |
|
|
|
|
|
|
|
Soil sciences, general |
23 |
22 |
19 |
27 |
14 |
18 |
|
Soil chemistry |
0 |
0 |
1 |
0 |
0 |
0 |
|
Soil conservation |
0 |
0 |
0 |
0 |
0 |
0 |
|
Soil management and fertility |
0 |
0 |
2 |
0 |
2 |
0 |
|
Soil microbiology |
0 |
0 |
0 |
0 |
1 |
0 |
|
Soil physics |
0 |
0 |
0 |
0 |
1 |
0 |
|
Soil sciences, other |
2 |
0 |
2 |
0 |
2 |
0 |
|
Total |
25 |
22 |
24 |
27 |
20 |
18 |
|
Agricultural sciences, other |
|
|
|
|
|
|
|
Agribusiness and production, other |
9 |
7 |
4 |
2 |
1 |
1 |
|
Agricultural sciences, other |
6 |
8 |
6 |
4 |
2 |
1 |
|
Total |
15 |
15 |
10 |
6 |
3 |
2 |
|
Renewable natural resources |
|
|
|
|
|
|
|
Renewable natural resources, general |
25 |
21 |
17 |
15 |
6 |
6 |
|
Renewable natural resources, other |
4 |
5 |
2 |
4 |
1 |
1 |
|
Total |
29 |
26 |
19 |
19 |
7 |
7 |
|
Conservation and regulation |
|
|
|
|
|
|
|
Conservation and regulation, general |
1 |
3 |
0 |
0 |
0 |
0 |
|
Conservation |
2 |
2 |
0 |
2 |
0 |
1 |
|
Resources protection and regulation |
0 |
0 |
0 |
0 |
0 |
0 |
|
Conservation and regulation, other |
1 |
1 |
0 |
0 |
0 |
0 |
|
Total |
4 |
6 |
0 |
2 |
0 |
1 |
|
Fishing and fisheries |
|
|
|
|
|
|
|
Fishing and fisheries, general |
3 |
10 |
3 |
9 |
2 |
5 |
|
Fisheries |
7 |
0 |
5 |
0 |
1 |
0 |
|
Fishing and fisheries, other |
1 |
0 |
1 |
0 |
1 |
0 |
|
Total |
11 |
10 |
9 |
9 |
4 |
5 |
|
Forestry production and processing |
|
|
|
|
|
|
|
Forestry production and processing, general |
4 |
4 |
3 |
3 |
4 |
4 |
|
Forest production |
0 |
0 |
0 |
0 |
0 |
0 |
|
Forest products utilization |
1 |
0 |
0 |
0 |
0 |
0 |
|
Forest products processing technology |
2 |
1 |
0 |
0 |
0 |
0 |
|
Pulp and paper production |
1 |
0 |
0 |
0 |
0 |
0 |
|
Forestry production and processing, other |
2 |
2 |
0 |
0 |
0 |
0 |
|
Total |
10 |
7 |
3 |
3 |
4 |
4 |
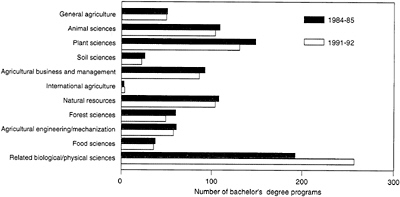
FIGURE 3-5
The number of bachelor degree programs in most areas of agricultural science and renewable resources at land grant institutions declined slightly between 1984–1985 and 1991–1992, although the number of programs in general biology (genetic, cell, and molecular biology and microbiology) increased significantly.
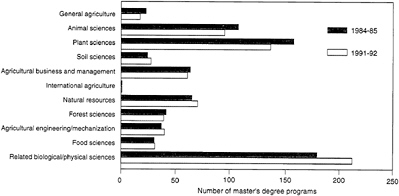
FIGURE 3-6
At the master's degree level, between 1984–1985 and 1991–1992 the number of programs in soil science, natural resources, and agricultural engineering/mechanics at land grant institutions increased only slightly while the number offering programs in general biology (genetic, cell, and molecular biology and microbiology) increased more.
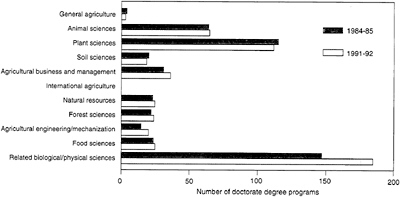
FIGURE 3-7
Between 1984–1985 and 1991–1992 there were increases in more degree program areas at the doctorate level than at the bachelor or master's levels.
A DEMOGRAPHIC PROFILE OF AGRICULTURAL SCIENTISTS
-
Today's and tomorrow's leaders of the land grant colleges of agriculture are its doctorate degree recipients. Its graduates at all degree levels have the potential to become leaders in industry, government, schools, and communities across the country—in fact, they often become the colleges' clientele. However, Ph.D. recipients are the ones most likely to join the colleges as faculty members and scientists, and advance to administrative positions at the colleges and universities.
-
Most U.S. agricultural scientists received their doctorate degrees from land grant universities. Thus a review of demographic characteristics of Ph.D. agricultural scientists who received degrees from U.S. schools provides a fairly accurate profile of those who received doctorate degrees from land grant colleges of agriculture. The demographic data used here were collected by surveying a sample of Ph.D. scientists; the survey was administered by the National Research Council's Office of Science and Engineering Personnel.2
-
Table 3-10 shows that the estimated number of agricultural scientists continues to grow but more slowly than the number of scientists in the life or natural sciences. In relative terms, agricultural science is losing human capital. Among agricultural scientists, the majority are plant and soil scientists, though the dominance of this group has declined from 58 percent in 1973 to 49 percent in 1991.
-
Agricultural scientists with doctorate degrees, like their peers in other areas of science, are still most likely to go to work for an academic institution. However, agricultural scientists are more likely to be employed in government (because of the large intramural research program at the USDA) and less likely to be employed in the private sector than their natural science peers. For all scientists, including agricultural scientists, academia and government are becoming less important as employers, while industry is becoming more important (Table 3-11). (Food scientists are the agricultural scientists most likely to have private sector jobs.) Thus the private sector increasingly competes with universities for those graduates with leadership potential.
-
Agricultural science is still clearly a more male-dominated discipline than other areas of science (Table 3-12). Within the agricultural science community, only in food sciences are women, at 22.5 percent, nearly as well represented as they are in science in general.
TABLE 3-10
Number of Employed Scientists Holding Doctorate Degrees, by Discipline, 1973, 1979, 1985, 1991
TABLE 3-11
Employment (percent) of Scientists Holding Doctorate Degrees, 1973, 1979, 1985, 1991
|
|
Year |
|||
|
Employment Field |
1973 |
1979 |
1985 |
1991 |
|
Education |
|
|
|
|
|
Agricultural sciences |
62.8 |
57.8 |
57.0 |
54.5 |
|
Life sciences |
68.2 |
66.5 |
62.2 |
59.1 |
|
Natural sciences |
57.8 |
55.6 |
53.4 |
51.7 |
|
All other sciences |
61.9 |
58.6 |
55.6 |
52.8 |
|
Business/Industrya |
|
|
|
|
|
Agricultural sciences |
15.0 |
19.8 |
24.6 |
25.0 |
|
Life sciences |
12.4 |
13.3 |
19.5 |
22.2 |
|
Natural sciences |
25.1 |
27.1 |
31.5 |
32.4 |
|
All other sciences |
20.4 |
22.3 |
27.7 |
29.3 |
|
Governmentb |
|
|
|
|
|
Agricultural sciences |
20.7 |
19.5 |
15.7 |
16.3 |
|
Life sciences |
12.4 |
11.6 |
10.1 |
10.4 |
|
Natural sciences |
12.0 |
11.2 |
9.6 |
9.9 |
|
All other sciences |
11.4 |
10.7 |
9.3 |
9.6 |
|
Nonprofit Organizations |
|
|
|
|
|
Agricultural sciences |
1.3 |
2.3 |
2.3 |
2.4 |
|
Life sciences |
6.6 |
7.6 |
8.1 |
7.7 |
|
Natural sciences |
4.8 |
5.4 |
5.3 |
5.3 |
|
All other sciences |
6.0 |
7.5 |
7.0 |
7.2 |
|
a Includes self-employed. b Federal, state, and local. SOURCE: Data are from the National Research Council, Office of Scientific and Engineering Personnel's biennial surveys of doctorate recipients. |
||||
TABLE 3-12
Prevalent Demographic Characteristics (percent) of Employed Scientists Holding Doctorate Degrees, 1991
|
Characteristic |
||||
|
Discipline |
Male |
White |
Age 55 and Over |
U.S. Citizen |
|
Agricultural sciences |
90.0 |
86.3 |
19.9 |
92.8 |
|
Agricultural economics |
91.4 |
85.6 |
5.8 |
88.6 |
|
Animal sciences |
89.8 |
90.2 |
17.9 |
93.1 |
|
Plant and soil sciences |
90.7 |
86.3 |
23.5 |
93.7 |
|
Forestry and wildlife management |
92.5 |
93.9 |
22.9 |
95.5 |
|
Food sciences |
80.5 |
65.1 |
16.9 |
87.9 |
|
Life sciences |
73.6 |
87.8 |
15.3 |
95.5 |
|
Natural sciences |
83.6 |
86.3 |
18.0 |
93.6 |
|
All sciences |
78.3 |
87.7 |
18.1 |
94.4 |
|
SOURCE: Data are from the National Research Council, Office of Scientific and Engineering Personnel's biennial surveys of doctorate recipients. |
||||
-
Although the differences may not be statistically significant, it appears that relative to other areas of science a slightly higher percentage of agricultural scientists are more than 55 years old and a slightly lower percentage are U.S. citizens (Table 3-12). These figures may indicate a declining interest among U.S. students in pursuing agricultural science careers, while the age figure suggests that new leadership opportunities are at hand. The higher percent of non-U.S. citizens in agricultural sciences may also suggest that the colleges of agriculture have a relatively larger role in international training than do nonagriculture schools.
-
Table 3-13 presents trends in the numbers of women and ethnic minorities in the agricultural sciences. Clearly, women are a significantly larger percentage in agricultural science today than 20 years ago; however, their presence is still minimal in relation to that of women in either life or natural sciences.
-
In contrast, ethnic minorities are represented in similar proportions in agricultural sciences and other areas of science. In all areas of science, participation by ethnic minorities has grown more slowly than participation of women. It is interesting that only in the agricultural sciences are ethnic minorities actually better represented than women as a group (Table 3-13). (This, however, may reflect inclusion of U.S.-educated scientists from, for example, Africa, Latin America, Asia, etc.)
-
Table 3-14 shows that the percent of agricultural scientists less than 35 years old is declining as it is in all areas of science. Thus the science community is aging generally, although agricultural scientists are somewhat older than their peers.
TABLE 3-13
Women and Ethnic Minority Scientists (percent) Holding Doctorate Degrees, 1973, 1979, 1985, 1991
|
|
Year |
|||
|
Discipline |
1973 |
1979 |
1985 |
1991 |
|
Women |
||||
|
Agricultural sciences |
1.3 |
2.6 |
5.5 |
9.3 |
|
Agricultural economics |
0.6 |
1.7 |
5.2 |
12.5 |
|
Animal sciences |
1.1 |
2.7 |
4.8 |
8.4 |
|
Plant and soil sciences |
1.1 |
1.8 |
4.9 |
7.9 |
|
Forestry and wildlife management |
0.0 |
0.2 |
2.2 |
7.1 |
|
Food sciences |
7.0 |
16.3 |
17.8 |
18.4 |
|
Life sciences |
12.7 |
15.8 |
21.3 |
26.7 |
|
Natural sciences |
6.8 |
8.9 |
12.5 |
16.4 |
|
All sciences |
8.9 |
12.3 |
17.0 |
21.6 |
|
Ethnic Minorities |
||||
|
Agricultural sciences |
6.3 |
11.0 |
12.0 |
11.8 |
|
Agricultural economics |
7.0 |
13.3 |
15.1 |
11.5 |
|
Animal sciences |
2.3 |
6.5 |
8.2 |
9.4 |
|
Plant and soil sciences |
7.7 |
12.2 |
11.5 |
10.1 |
|
Forestry and wildlife management |
1.1 |
4.1 |
5.1 |
5.9 |
|
Food sciences |
12.7 |
30.2 |
32.8 |
35.4 |
|
Life sciences |
6.3 |
8.8 |
9.8 |
11.3 |
|
Natural sciences |
5.7 |
9.0 |
10.8 |
12.4 |
|
All sciences |
5.4 |
8.1 |
9.9 |
11.2 |
|
SOURCE: Data are from the National Research Council, Office of Scientific and Engineering Personnel's biennial surveys of doctorate recipients. |
||||
TABLE 3-14
Scientists (percent) Less Than 35 Years Old Holding Doctorate Degrees, 1973, 1979, 1985, 1991
|
|
Year |
|||
|
Discipline |
1973 |
1979 |
1985 |
1991 |
|
Agricultural sciences |
21.4 |
13.7 |
13.2 |
8.8 |
|
Agricultural economics |
56.3 |
24.7 |
20.1 |
11.1 |
|
Animal sciences |
17.6 |
12.1 |
13.8 |
10.8 |
|
Plant and soil sciences |
20.5 |
11.8 |
13.2 |
8.2 |
|
Forestry and wildlife management |
20.3 |
13.9 |
7.3 |
4.4 |
|
Food sciences |
26.8 |
22.6 |
13.5 |
11.9 |
|
Life sciences |
27.1 |
22.6 |
16.5 |
10.6 |
|
Natural sciences |
28.3 |
20.4 |
15.2 |
11.5 |
|
All other sciences |
27.3 |
20.6 |
14.4 |
10.1 |
|
SOURCE: Data are from the National Research Council, Office of Scientific and Engineering Personnel's biennial surveys of doctorate recipients. |
||||
ISSUES FOR DISCUSSION
-
What factors explain the trends in enrollment at colleges of agriculture? Will the large agribusiness sector, and strong public interest in food, natural resource, and environmental issues, generate a continued demand for programs of colleges of agriculture even though few students will enter or return to farming? Are college curricula adjusting to meet the interests of today's students and the needs of today's agribusiness industry?
-
Do the instruction programs of the colleges provide the basic knowledge and practical skills pertinent to those who do return to farms or join businesses that serve farms? (Are they too ''discipline-oriented''?)
-
Are programs of the colleges adjusting or consolidating in accordance with trends in student demand? Could system-wide efficiencies be realized through increased specialization by individual colleges in the offering of specific degrees?
-
What are the future relative roles of land grant colleges of agriculture and non-land grants in educating students in agriculture, food, and natural resource fields?
-
Ph.D. students have different academic program emphases than undergraduates. Is the pool of potential new faculty appropriate to the future instructional needs of the colleges?
-
What qualities and characteristics are desired of the current and future leadership of the colleges of agriculture?
-
Given the growing diversity of the system's clientele, how important to the system's future is a diversity of backgrounds and views among its leadership? How can the colleges enhance opportunities for and attractiveness of their programs to women, minorities, and young scientists?
SUGGESTED READINGS
Coulter, K. Jane, Allan D. Goecker, and Marge Stanton. Employment Opportunities for College Graduates in the Food and Agricultural Sciences: Agriculture, Natural Resources, and Veterinary Medicine. Washington, D.C.: Higher Education Programs, Cooperative State Research Service, U.S. Department of Agriculture , 1990.
Marchant, Mary, and Handy Williamson, Jr., eds. Achieving Diversity: The Status and Progress of Women and African Americans in the Agricultural Economics Profession. New York: Garland Publishing, Inc., 1994.
National Research Council. Agriculture and the Undergraduate. Washington, D.C.: National Academy Press, 1992.
National Research Council. Doctorate Recipients from United States Universities: Summary Report 1992. Washington, D.C.: National Academy Press, 1993.
National Research Council. Educating the Next Generation of Agricultural Scientists. Washington, D.C.: National Academy Press, 1988.
National Research Council. Plant Biology Research and Training for the 21st Century. Washington, D.C.: National Academy Press, 1992.
National Research Council. Understanding Agriculture: New Directions for Education. Washington, D.C.: National Academy Press, 1988.
National Research Council. Women Scientists and Engineers Employed in Industry: Why So Few? Washington, D.C.: National Academy Press, 1994.
U.S. Department of Education, National Center for Education Statistics. The Condition of Education 1993. Washington, D.C.: U.S. Department of Education, 1993.


