
18
Eating Situations, Food Appropriateness, and Consumption
Howard G. Schutz1
Not Eating Enough, 1995
Pp. 341–359. Washington, D.C.
National Academy Press
INTRODUCTION
In considering the factors that contribute to the underconsumption of foods, it is instructive to look also at the reasons that people do consume food. Table 18-1 shows the four basic factors that contribute to people consuming or not consuming foods. One basic dimension of consumption is hunger or satiety. Obviously people eat more or less depending on their perception of how hungry they are. This hunger is not necessarily related to physiological conditions associated with hunger or satiation at the stomach or cellular level, but rather to the individual's own perception of hunger. One could question whether in Western society one typically becomes truly hungry at the cellular level; nevertheless, the sensations of hunger and satiety are experienced, which motivates people to either eat or not eat.
TABLE 18-1 Factors Influencing Consumption
|
Why Do People… Consume? |
Not Consume? |
|
Hungry |
Satiated |
|
Availability |
Unavailability |
|
Like |
Dislike |
|
Appropriate situation |
Inappropriate situation |
The second characteristic of consumption, availability, applies to food in general and also to the availability of specific items. Thus items that are unavailable because of seasonal variations or are out of stock in a store would contribute to nonconsumption of those items. In the military, food is only available that can be carried on one's back or supplied by a food service function.
The third characteristic of consumption, the hedonic feature of liking or disliking, has been given much attention in the food acceptance literature and has been used as the major predictor for whether or not foods will be consumed in both civilian and military populations (accounting for only about 50 percent of the variation in consumption).
The fourth and final factor of consumption is appropriateness or inappropriateness of the eating situation. In a broad sense this term covers all the aspects of the context in which food is eaten; thus ambient physical conditions, meal occasions, attitudinal states, and social environments can be included under this variable.
The dichotomous nature of consumption as shown in Table 18-1 is for illustrative purposes only. All of the factors are really on a continuum. The first three factors and all of the underlying conditions associated with them have received the greatest emphasis as predictors of consumption. Appropriateness is a relatively new factor in considerations of consumption, although researchers in the field have always qualified their results by indicating that to some extent the results were contingent on or confounded by the particular situation in which the measurement of both predictive and consumption variables were measured.
This chapter will analyze information from both consumer behavior research and from research on the cognitive and contextual aspects of eating, and determine to what extent this information can help create a better understanding of the factors that may contribute to underconsumption. In addition, some recommended ways to use this knowledge to improve consumption will be suggested.
Table 18-2 summarizes the major situational influences on consumption. Note that under "antecedent state," sensory expectancy relates to an individual expecting a particular sensory experience from a food such as one that is spicy, mild, bitter, and so on. The extent to which the sensory expectancy is disconfirmed or confirmed could influence an individual's consumption of a particular food. Cardello's chapter (see Chapter 10 in this volume) covers this area in more detail. Also note under the heading "use occasion," that "purpose of product'' is a general category, which includes such considerations as whether or not the product is, for example, a dessert or an appetizer; whether or not it is identified as being served for a particular meal occasion, such as for breakfast, lunch, or dinner; whether or not it fits a particular ethnic pattern; and so on.
CONSUMER BEHAVIOR SITUATIONAL RESEARCH
The following discussion about consumer behavior situational research is by no means exhaustive; rather it is illustrative of the kinds of research done and data collected by consumer researchers in the food context area. Hugstad et al. (1975) had consumers report their preference for a variety of beverages with regard to various use contexts, as well as the attributes associated with each beverage. They also analyzed the results and grouped the beverages into context-specific ideal clusters. Table 18-3 summarizes their results. The beverages were grouped into four categories: water-based, hot adult, juices, and milk-based drinks. The use contexts included situational characteristics of physical state, meal, social situation, and time of year. The results shown in Table 18-3 indicate the quite logical nature of the attributes and types of drinks for different use contexts. One might infer that beverages served in an inappropriate use context, where their attributes did not fit, could be ones that
TABLE 18-2 Types of Situational Influence on Consumption
|
Physical Surroundings • Geographical location • Sounds • Aroma • Lighting • Weather Social Surroundings • Other persons present • Interpersonal interactions • Roles |
Temporal Perspective • Time of day • Time since last event Antecedent State • Moods • Physical state • Sensory expectancy Use Occasion • Purpose of product |
TABLE 18-3 Use Occasion and Preference for Beverages
|
Use Contexts |
Context-specific Ideal Beverage Clusters |
Attributes Closest to Context Ideal |
|
During the summer |
Water-based drink |
Not relaxing, sour, thirst quenching |
|
During the winter |
Hot adult drinks |
Served very hot, good for my health, energy giving |
|
For breakfast |
Juices |
Primarily for children, good for my health, energy giving |
|
For lunch |
Hot adult drink |
Served very hot, best with food, not thirst quenching |
|
When friends come to dinner |
Hot adult drinks |
Primarily for adults, sour, light |
|
When you are thirsty |
Water-based drinks |
Not relaxing, sour, thirst quenching |
|
When you wish to relax |
Water-based drinks |
Relaxing, sweet, not thirst quenching |
|
When you need a pick-me-up |
Milk-based drinks |
Served very hot, good for my health, energy giving |
|
SOURCE: Hugstad et al. (1975), used with permission. |
||
would be underconsumed. For example, a hot adult drink would not be served during the summer if one expected to provide the attributes of sour, not relaxing, and thirst quenching.
Another example of the influence of situational conditions on food choice behavior is from the work by Miller and Ginter (1979) on fast food establishments. Table 18-4 presents percent of market share for eight different fast food establishments related to four categories of use occasions. Some restaurants such as McDonald's are deemed appropriate by customers for all four situations. Some have a low market share for all occasions, like Hungry Herman's, whereas others vary in their market share depending on the particular use occasion, such as Borden Burger and Wendy's. These data support the contention that there are large and important differences in the way in which consumers make choices (in this case choice of establishment), depending on the situation.
Belk (1975) has analyzed the effect of consumers, situations, and products on purchase behavior. In addition to the main effects, he examined the interaction among these three variables. The data in Table 18-5 show that situations play a smaller role than products in accounting for the purchase behavior of the four product categories. Nevertheless, in this study the statistical
TABLE 18-4 Competitive Dynamics, as Shown by Percent Market Share, Among Fast Food Restaurants by Type of Use Occasion
|
|
Percent Market Share of Customers Who Consume… |
|||
|
Establishment |
Snack While Shopping |
Lunch |
Evening Meal When Rushed |
Evening Meal with Family, Not Rushed |
|
White Castle |
14 |
8 |
0 |
5 |
|
Wendy's |
13 |
13 |
13 |
21 |
|
McDonald's |
35 |
27 |
33 |
38 |
|
Hungry Herman's |
1 |
3 |
2 |
3 |
|
Burger King |
14 |
14 |
15 |
12 |
|
Burger Chef |
4 |
9 |
4 |
5 |
|
Borden Burger |
13 |
18 |
18 |
10 |
|
Arby's |
4 |
4 |
4 |
3 |
|
SOURCE: Adapted from Miller and Ginter (1979). |
||||
TABLE 18-5 Effects of Situations, Products, Persons, and Interactions on Consumer Behavior
|
|
Response Category (%) |
|||
|
Source |
Beverage Products |
Meat Products |
Snack Products |
Fast Foods |
|
Consumers (C) |
0.5 |
4.6 |
6.7 |
8.1 |
|
Situations (S) |
2.7 |
5.2 |
0.4 |
2.2 |
|
Products (P) |
14.6 |
15.0 |
6.7 |
13.4 |
|
S x P interaction |
39.8 |
26.2 |
18.7 |
15.3 |
|
S x C interaction |
2.7 |
2.9 |
6.1 |
2.2 |
|
P x C interaction |
11.8 |
9.7 |
22.4 |
20.1 |
|
Residual |
27.8 |
36.4 |
39.0 |
38.7 |
|
Total |
100.0 |
100.0 |
100.0 |
100.0 |
|
SOURCE: Belk (1975), used with permission. |
||||
situation x product interaction accounts for a larger percentage of the responses than any of the individual product categories. Clearly, trying to understand purchase behavior on the basis of the product alone without regard to the situation provides a very weak understanding of consumer behavior.
FOOD COGNITIVE-CONTEXT RESEARCH
A number of studies conducted by food researchers in the cognitive area point to the importance of understanding food consumption by using appropriateness measures. Schutz (1988) described the general concept of appropriateness as an aspect of food attitudes that makes a significant contribution, independent from food preferences, to the understanding of food behavior. In one study 200 females, 50 each in four cities across the country, evaluated 56 foods with regard to their appropriateness for 48 uses-attributes (Schutz et al., 1975). They used a 7-point appropriateness scale anchored by the terms "never appropriate" and "always appropriate." The food items are shown in Table 18-6 and the uses in Table 18-7. The foods cover a wide range of food classes and all types of situational influences. One of the purposes of this study was to demonstrate the cognitive structure of foods based on the perception of "use appropriateness" rather than by typical food classes developed by food technologists, nutritionists, or anthropologists (e.g., dairy, meat and fish, fruits and vegetables, cereals and grains). To accomplish this objective, the foods were analyzed as variables in a principle component analysis (PCA), with the mean ratings for all uses as the cases.
Table 18-8 summarizes the results of the PCA where the four factors extracted are named and the five highest rated uses are given in order of their factor weights. From this analysis one concludes that appropriateness does allow for a meaningful categorization of foods, which incidentally does not correspond to any of the standard food classifications.
Table 18-9 rank orders the five most appropriate foods on the five PCA dimensions. These were found by analyzing the uses as variables, with food products as cases, and with the addition of "really like" as a representation of the hedonic component for these foods. The names for the factors were derived from the highest-rated attribute in each of the use factors. This table shows that knowing the basic liking order for foods does not necessarily provide information on the most appropriate use situation for foods. Thus, it seems reasonable that items served for an inappropriate use situation would be less likely to be consumed than those served in an appropriate situation. For example, although steak might be very well liked, it is not likely that it would be purchased and consumed when one was looking for an inexpensive food.
Another similar study was conducted in United Kingdom by this author and colleagues from the Institute of Food Research at Reading, England (Shepherd et al., 1992). In this case there were 50 foods and 50 uses-situations.
TABLE 18-6 Food Items Rated by Women in a Four-City Study
|
Food Items |
|
|
Pie |
Yogurt |
|
Potato Salad |
Roast beef |
|
Milk |
Spaghetti |
|
Tomatoes |
Fried eggs |
|
Chicken |
Green salad |
|
Coffee |
Orange juice |
|
Jell-O |
Ice cream |
|
American Cheese |
Baked beans |
|
Shrimp |
Rice |
|
Tea |
Carrots |
|
Chili |
Bagels |
|
Vegetable soup |
Broccoli |
|
Liver |
Cottage cheese |
|
Fish |
Peanut butter |
|
Soft drinks |
French fries |
|
Meat loaf |
Ham |
|
TV dinners |
Peas |
|
Watermelon |
Strawberries |
|
Steak |
Potato chips |
|
Wine |
Tuna |
|
Dry cereal |
Pizza |
|
Cake |
Hot dogs |
|
Dip |
Pickles |
|
Chop suey |
Onions |
|
Apples |
Parsley |
|
Chitterlings |
Candy bars |
|
Bread |
Bacon |
|
Hamburger |
Tacos |
|
SOURCE: Schutz et al. (1975), used with permission. |
|
TABLE 18-7 Uses/Situations for Rating Foods in a Four-City Study
|
Food Uses |
|
|
Have to lose weight |
When eating out in a restaurant |
|
Want something easy to chew |
Want something light |
|
To eat with a spoon |
With coffee |
|
For teenagers |
When riding in a car |
|
For dessert |
To eat with fingers |
|
Want something inexpensive |
For men |
|
Want something nutritious |
On cold days |
|
When don't have much time to eat |
When visiting someone |
|
For breakfast |
In a salad |
|
For special holidays |
When really hungry |
|
In the summer |
A spicy food |
|
In a sandwich |
For children |
|
For guests |
Served cold |
|
Want a variety in meals |
To eat with a fork |
|
For a sack lunch |
Easy to digest |
|
At parties |
With cocktails |
|
For a between-meal snack |
When want something really like |
|
With friends |
Just itself |
|
For lunch |
Want something easy to prepare |
|
When want to feel creative |
On a picnic |
|
When not very hungry |
Something you broil |
|
When I am unhappy |
Something you try not to run out of |
|
As a main dish |
When not feeling well |
|
For dinner |
When watching TV |
|
SOURCE: Schutz et al. (1975), used with permission. |
|
The respondents, 25 males and 25 females chosen at random from the Reading area, rated the appropriateness of each of the foods for each of the uses-situations on the same 7-point appropriateness scale, and in addition they gave information on the frequency of consumption of each of the items in times per day, week, or month. Respondents also rated the importance of six considerations
TABLE 18-8 Rank Order of Factor Loadings for 5 Highest Weighted Uses from Factor Analysis of 48 Uses
|
I Utilitarian |
II Casual |
|
For teenagers |
When unhappy |
|
For children |
Riding in a car |
|
Easy to prepare |
For dessert |
|
In summer |
With cocktails |
|
For men |
Eat with a spoon |
|
III Satiating |
IV Social |
|
As a main dish |
At parties |
|
Eat with a fork |
With friends |
|
For dinner |
For guests |
|
Really hungry |
For special holidays |
|
|
Don't run out of |
|
SOURCE: Schutz (1988), used with permission. |
|
when choosing foods—taste, price, health, weight control, nutrition, and other people's views. Table 18-10 lists the 50 uses-situations. The mean frequency per month of each of the 50 foods is given in Table 18-11. Although frequency evaluations of dietary intake are open to some criticism, there is evidence for the sufficient validity of such measurements to make them worthwhile as a measure of general patterns of consumption rather than for nutritional information. In addition the data collected have a reasonable level
TABLE 18-9 Rank Order of 5 Highest Appropriateness Means for Factor Representative Uses and Preference for 56 Foods
|
I Really like |
II For teenagers |
III Unhappy |
|
Steak |
Ice cream |
Coffee |
|
Roast beef |
Milk |
Tea |
|
Salad |
Hamburger |
Wine |
|
Strawberries |
Pizza |
Ice cream |
|
Spaghetti |
Jell-O |
Strawberries |
|
IV As a main dish |
V At parties |
VI Inexpensive |
|
Roast beef |
Dip |
Jell-O |
|
Steak |
Potato chips |
Hamburger |
|
Chicken |
Coffee |
Spaghetti |
|
Spaghetti |
Wine |
Vegetable soup |
|
Meat loaf |
Cake |
Meat loaf |
|
SOURCE: Schutz (1989), used with permission. |
||
TABLE 18-10 Uses/Situation For Rating Foods in United Kingdom Study
|
When I want something inexpensive |
Low in salt |
|
When I want something I really like |
For a between meal snack |
|
Low in calories |
When I am very hungry |
|
A food I spend time thinking about |
When I want something different |
|
In a sandwich |
A food with which I am very involved |
|
For frying |
For a packed lunch |
|
For breakfast |
When I want value for money |
|
When I don't want a lot of cleaning up |
When eating in a restaurant |
|
For grilling |
When I am not feeling well |
|
For when I eat alone |
Served cold |
|
A food I feel strongly about |
For lunch |
|
As a main dish |
High in fiber |
|
Low in fat |
At parties |
|
Just by itself |
A food not to run out of |
|
A food with a consistent quality |
A food always available in the shops |
|
For guests |
When I am unhappy |
|
A food difficult to resist |
For children |
|
To eat with a fork |
When I want something nutritious |
|
For men |
For dessert |
|
For dinner |
To cook in a microwave oven |
|
For women |
When I want something spicy |
|
A food that freezes well |
Something I can prepare in many ways |
|
When I want something easy to prepare |
When I want to feel creative |
|
To eat with my fingers |
In the summer |
|
When watching television |
On cold days |
of face validity. Similar to the earlier study (Schutz et al., 1975) conducted in the United States, a PCA was done on both foods and attributes. The food PCA will not be discussed here except to say that it was a more complex result than in the U.S. study, which could be due to either the difference in the United Kingdom versus United States populations or to the 15-year difference in the time the studies were conducted. The attribute PCA for the United Kingdom also resulted in more factors, in this case, 10. As in the U.S. study,the single attribute that was most heavily weighted on each of the factors was used to represent that use factor. These 10 were, in order of their contribution to the variation of the data:
-
When I want something I really like
-
When I don't want a lot of cleaning up
-
A food not to run out of
-
Low in calories
-
At parties
-
When I want something spicy
-
In a sandwich
-
High in fiber
-
For dessert
-
A food that freezes well
To determine the relative importance of demographics, appropriateness (representatives of the 10 use factors given above), and other attitude data related to frequency of consumption, a series of stepwise multiple regression
TABLE 18-11 Mean Frequency of Consumption per Month in United Kingdom Study
|
Food |
Average per Month |
Food |
Average per Month |
|
Tea |
103.32 |
Chips |
5.34 |
|
Milk |
72.15 |
Wine |
5.26 |
|
Coffee |
61.67 |
Bacon |
4.50 |
|
Skimmed milk |
46.27 |
Ham |
4.34 |
|
Bread |
44.65 |
Ice cream |
4.27 |
|
Butter |
29.84 |
Pasta |
4.01 |
|
Wholemeal bread |
28.05 |
Fried eggs |
3.24 |
|
Biscuits |
22.99 |
Broccoli |
2.99 |
|
Breakfast cereal |
18.95 |
Frozen meals |
2.92 |
|
Orange juice |
18.14 |
Sausage |
2.85 |
|
Cheddar cheese |
15.09 |
Bacon and eggs |
2.75 |
|
Apples |
13.19 |
Fruit cake |
2.13 |
|
Soft fizzy drink |
12.24 |
Fish and chips |
2.01 |
|
Crisps |
10.88 |
Vegetable soup |
1.98 |
|
Tomatoes |
9.99 |
Curry |
1.76 |
|
Yogurt |
9.41 |
Steak |
1.31 |
|
Chocolate bars |
9.28 |
Roast beef |
1.25 |
|
Peas |
9.05 |
Cottage cheese |
1.21 |
|
Carrots |
7.25 |
Pizza |
1.19 |
|
Green salad |
6.79 |
Liver |
1.07 |
|
Chicken |
6.06 |
Hamburger |
1.03 |
|
Baked beans |
5.88 |
Prawns |
0.92 |
|
Beer |
5.70 |
Strawberries |
0.84 |
|
Fish |
5.44 |
Pork pie |
0.64 |
|
Rice |
5.43 |
Chop Suey |
0.39 |
correlation coefficients were computed. This was done over all foods and for each individual food. Table 18-12, presents the results for five representative foods and for all foods combined. For all 50 of the foods it was possible to find a statistically significant relationship between a set of independent variables and the dependent variable of frequency of consumption. However, there was a wide range in the amount of variance that could be predicted. Examining Table 18-12 reveals that although the "really like" variable can be found in a variety of equations, it is not always there, and it is not alone in its ability to predict consumption. The data support the contention that in order to understand consumption or underconsumption, it is important to know more
TABLE 18-12 Selected Multiple Regressions Predicting Frequency of Consumption from Demographics, Appropriateness, and Food Considerations
|
Food |
R2* |
Variable and Partial Correlation |
|
|
Pasta |
.33 |
Really like |
.53 |
|
|
|
Nutrition importance |
.40 |
|
|
|
Weight |
-.38 |
|
|
|
For dessert |
-.34 |
|
|
|
Gender |
-.33 |
|
|
|
Available |
-.22 |
|
Fruit cake |
.44 |
Other people importance |
.63 |
|
|
|
For children |
-.49 |
|
Skimmed milk |
.48 |
Really like |
.64 |
|
|
|
Weight |
.41 |
|
|
|
Taste importance |
-.24 |
|
Bacon |
.62 |
Really like |
.61 |
|
|
|
Health importance |
-.52 |
|
|
|
For children |
-.65 |
|
|
|
Other people importance |
.52 |
|
|
|
Gender |
-.46 |
|
|
|
Weight |
-.35 |
|
|
|
Weight control importance |
-.33 |
|
|
|
Nutrition importance |
-.23 |
|
Bread |
.44 |
For low calorie |
.56 |
|
|
|
Socioeconomic class |
.34 |
|
|
|
Available |
-.49 |
|
|
|
Taste importance |
.40 |
|
|
|
When alone |
.31 |
|
|
|
For sandwich |
.28 |
|
|
|
Weight |
-.23 |
|
All foods |
.73 |
Available |
.83 |
|
|
|
For low calorie |
.51 |
|
|
|
Freezes |
-.30 |
|
|
|
Average involvement |
.25 |
|
* R2 = Multiple correlation coefficient. |
|||
than just whether or not a food is liked. Note also that for some foods, a large amount of variation in frequency of consumption can be accounted for if one includes other than affective information.
As one way of gauging the relative importance of the independent variables contributing to the equations, the numbers in each of the five categories of independent variables were counted and are shown in Table 18-13. The first category ''appropriateness" accounts for the largest percentage of variables included in the analyses; one component "really like" of appropriateness alone contributed 12 percent. The demographics consisted of such variables as age, gender, and so on. "Considerations" were the six food considerations mentioned earlier. Average involvement was a variable computed by averaging three attributes that were designed to measure degree of involvement with foods, and average appropriateness was simply the average for a food over all situations.
The involvement scale is an interesting one. In this author's opinion, involvement represents a missing link in the explanation of why attitudes do not predict behavior to a greater degree than has been found in most research studies. It appears from consumer behavior research that some attitudes toward food or other goods are indicated by respondents when they are asked the questions, not because they consider them relevant, but simply because they feel it is appropriate to respond. The consumer behavior literature has recognized this factor (Wilkie, 1990), and for the past 10 years researchers have been actively measuring involvement as an intermediate variable in helping to explain the nature of purchase and of consumption of goods and services.
TABLE 18-13 Summary of Variables in Multiple Regression Prediction of Frequency of Consumption
|
|
N |
% |
|
Appropriateness* |
114 |
43 |
|
Demographics |
67 |
26 |
|
Considerations |
63 |
24 |
|
Average involvement |
12 |
5 |
|
Average appropriateness |
6 |
2 |
|
Total |
262 |
100 |
|
* For "really like" component, n=31; % = 12. |
||
Laboratory Appropriateness Studies
Kramer et al. (1992) conducted a study on the effects of time of day and appropriateness on food intake and hedonic ratings with 19 male employees of the U.S. Army Natick Research, Development and Engineering Center. Thirty-six representative breakfast and lunch foods were rated for acceptability by the 19 respondents when the foods were served for breakfast or lunch. The 19 subjects were given foods that they had been rated high and low in appropriateness for each of the meal occasions. They rated their hunger and each food item on a hedonic scale before and after each meal. Although food items were rated higher for appropriate meals, consumption was actually greater for lunch items that were served for breakfast, with hedonic ratings during meals equal to ratings before meals. However, hunger rated lower after inappropriate meals. Although this study seems to indicate that inappropriate foods for particular meals do not result in lowered consumption, perhaps the 2-wk time period involved in this study was not long enough to overcome what might be considered a novelty effect. The fact that hunger was rated lower after inappropriate meals may be a clue to the eventual result that foods that are particularly inappropriate for meal occasions would be consumed at a lower level.
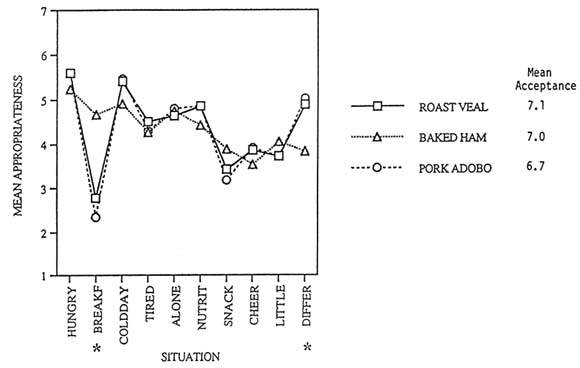
Recently Armand Cardello and this author began a series of appropriateness studies in a laboratory panel situation. The purpose of the studies is to examine the potential contribution of appropriateness type data obtained on taste test samples as an adjunct to the standard hedonic acceptance data. Ten situations were selected to represent basic situation components, and a ballot form was prepared for each food to be rated. During standard panel acceptance studies, respondents rated the foods they received on the 10 situation scales using the 7-point appropriateness scale (in addition to the 9-point hedonic rating scale). The ratings on appropriateness occurred during the waiting period between taste test samples.
Two tests illustrate the type of results that have been obtained. Figure 18-1 shows the mean appropriateness ratings for three meat products on the 10 scales and also the mean acceptance ratings for the three products. The three products did not differ significantly on mean acceptance. However, there is a significant difference for two of the appropriateness scales: "for breakfast," where the baked ham is more appropriate than the roast veal or pork adobo products, and for "when I want something different," where the baked ham is significantly less appropriate than the other two products. As might be expected for the other attributes since these are all main dish items, there is a high degree of similarity in the response profiles for the three products.
Figure 18-2 shows the mean appropriateness ratings for stuffed cabbage roll, baked ham, and a spaghetti product. Again, there are no significant differences in the mean acceptance ratings, however there are significant differences for four of the situation appropriateness variables: "for breakfast,"
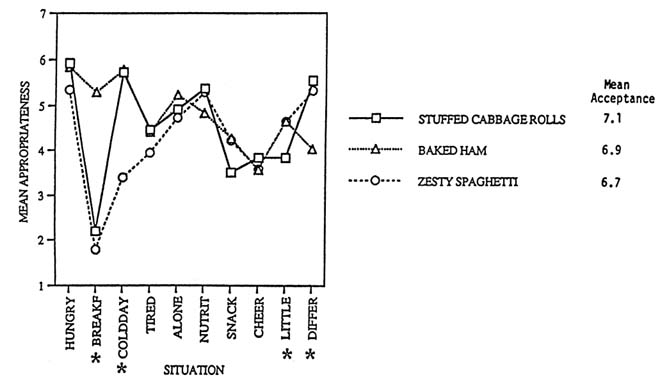
"a cold day," "when there is little time to eat," and "when I want something different." Whereas the baked ham is considered quite appropriate for breakfast, the spaghetti and stuffed cabbage rolls are definitely inappropriate for this meal occasion. "On a cold day," spaghetti is less appropriate than the other two products, and ''when you have little time to eat," the cabbage roll is less appropriate. For a product that is considered "different," baked ham is less appropriate than the other two products. For these three products, the two meat-based products have more similar profiles, whereas the spaghetti product represents a slightly different profile, which is not an unexpected result.
Together these two examples illustrate the ability to extend the appropriateness procedure to an actual food-tasting situation and the value of the data collected by such a procedure. The fact that these products do not differ in acceptance might have lead one to believe that they would be equally acceptable for a variety of serving situations. This is obviously not the case, and data such as these could prove useful as an early screening procedure in the development of products for the military.
DISCUSSION
The information presented on appropriateness and consumption makes it clear that food item and situation interaction are important and can influence consumption and therefore underconsumption. Certainly level of appropriateness may operate differently in some circumstances in the commercial civilian world than it does in the military world. Availability operates quite differently in the civilian versus the military world. In the civilian world availability may be a function of time of year, location of stores, and cost of products. In the military, in contrast, limitations in availability can be a function of time available to prepare food and methods of distribution that fit the particular military situation. Availability and situation may interact in the military more strongly than in the civilian sector. For example, when only less-appropriate foods are available, they still may be eaten in the military, but will not be in the civilian sector. The reasons one might influence the selection or availability of particular items for the military or civilians might differ, but it should be possible to do a better job of matching particular foods to particular situations in the military and vice versa. Although the data and ideas described in this chapter were based on civilian respondents, there is no reason to believe the same type of information would not be found in the military population.
It is easy to measure the food acceptance ratings of products under development and assume that they are reasonable predictors of actual consumption. However, in reality, this is not the case. At least one important aspect of predicting consumption should include the appropriateness of the item for the particular profile of situations that are most likely to occur for that product.
CONCLUSIONS AND RECOMMENDATIONS
Preference is not the same as appropriateness, although the two are related. If a product is not appropriate for any situation, it is probably one that is not liked at all. On the other hand, a product that is appropriate for many situations is probably one that is generally liked.
Underconsumption cannot be predicted by food acceptance data alone, and appropriateness is an important predictor of frequency of consumption. It therefore may be helpful in understanding underconsumption. Specific "military appropriateness situations" and interactions of the person, the product, and the situation should be studied.
Appropriateness measurement should be part of the screening process in ration development in both laboratory and field tests. Specifically, the influence of item selection and situation on consumption in the military should be studied further.
REFERENCES
Belk, R.W. 1975. Situational variables and consumer behavior. J. Consum. Res. 2:157–164.
Hugstad, T.P., C.S. Mayer, and T.W. Whipple 1975. Consideration of context differences in product evaluation and market segmentation. J. Acad. Marketing Sci. 3:42.
Kramer, F.M., K. Rock, and D. Engell 1992. Effects of time of day and appropriateness on food intake and hedonic ratings at morning and midday. Appetite 18:1–13.
Miller, K., and J. Ginter 1979. An investigation of situational variation in brand choice behavior and attitude. J. Marketing Res. 16:111–123.
Schutz, H.G. 1988. Beyond preference: Appropriateness as a measure of contextual acceptance of food. Pp. 115–134 in Food Acceptability, D.M.H. Thomson, ed. London: Elsevier Applied Science.
Schultz, H.G., M.H. Rucker, and G.F. Russell 1975. Food and food-use classification systems. Food Technol. 29(3):50–56, 60–64.
Sheperd, R., H. Schutz, and P. Sparks 1992. Prediction of frequency of food consumption from use, attitude, and demographic variables. Rose Marie Pangborn Memorial Symposium. August 2–6, Jarvenpaa, Finland.
Wilkie, W.W. 1990. Consumer Behavior, 2nd ed. New York: John Wiley and Sons.
DISCUSSION
RICHARD JANSEN: There have been a lot of comments made about what food should be eaten at a meal, and particularly at regular meals, in some of the other studies that Howard Schutz has been taking about.
This is not my area of research, but I have the impression that what has happened culturally in this country is a movement away from meals toward "grazing." Not only that, but the family mealtime has had to become less important. And it seems to me that this is somewhat at variance with what I have been hearing here.
HOWARD SCHULTZ: Let me make a comment about that. You are right and you are wrong. You are right, I think, in that in the commercial world we do a lot more grazing and there are a lot less formal meals. But I think that in that in the situation in the military, there is a stress situation. I think people tend to go back to more secure ways of doing things.
I think it is probably less likely they would behave in that way under those circumstances. That is why I say we have to look at the specific military situations, not just the situation generalized from the civilian one.


