
Summary of Introductory Comments
Paul Baltes
There are several ways to think about the development of science and technology (S&T). For instance, we can think about the development of individuals across their life span; that is, in terms of achieving their full potential to contribute to the S&T process and in terms of their active participation in the S&T workforce. We can talk about the development of institutional structures and the interactions between people and the S&T system. We might focus on generational dynamics such as the transformation of social roles and the age at which society expects someone to step into the role of a scientist or engineer. Finally, there is the concept of the life cycle of research programs. In all of these scenarios of S&T development, there is an implicit interest in monitoring both change and constancy. What differs between these scenarios is the unit of analysis and the nature of the time continuum.
Each of these vistas on the development of S&T, and especially their interrelationships, requires longitudinal, repeated-measurement methodology in one form or another (Magnusson, 1993; Nesselroade & Baltes, 1979); that is, research that repeatedly observes the same unit (individuals, groups, institutions) over time. However, largely for reasons of economy and investigator time, the dominant methodological tendency has been to conduct cross-sectional research to monitor development—taking, for example, one snapshot of individuals of different ages, of a labor force, or of an educational cohort. Such cross-sectional studies—studies conducted at one point—make it virtually impossible to disentangle the many factors that shape the time course of an individual, a program, or an institution. Moreover, the outcome of cross-sectional, one-time comparisons confound individual (age) change with historical change. For example, when comparing 40- and 60-year-olds in 1990, these two groups differ not only in age, but also in the historical time during which they grew older (Schaie, 1965). Thus, strictly speaking, cross-sectional studies fail to provide much insight into the underlying life course mechanisms of development, whether they are personal, institutional, or societal.
I emphasize this point also because, historically, scientific insights into understanding the limitations of cross-sectional studies in the analysis of change owes much to Belgium. We are gathered here at a place that possesses characteristics of a true genius loci, where cohort and age-based methodology are concerned. In the nineteenth century, the Belgian Adolphe Quetelet (1842) made an important advance in the application of statistical analysis to social data: he formulated the concept of the ''average man." Particularly relevant to today's conference is his methodological argument for longitudinal research and the need to repeat "age studies" over time and cohorts to avoid the "disturbances" created by historical period effects. As a result of Quetelet's work, we mark the nineteenth century as the beginning of research on the developing individual in a changing society and the study of age-cohort relationships.
We have learned a lot about the concept of human development in the years following Quetelet's seminal work. The study of human development has evolved
and the concept of life span analysis and associated life course methodology (such as cohort studies) have gained favor (Baltes, 1987; Featherman, 1983). Two points deserve highlighting from this century-long quest for adequate methodology and adequate data:
-
There are no methodological shortcuts in understanding the life course of individuals and educational institutions. If the focus is on change, cross-sectional studies are but a first step.
-
There is an important role for longitudinal research in disentangling the complex interactions of individuals and the environment in which they develop. Moreover, longitudinal studies of single birth cohorts need to be enriched by cohort-sequential studies.
In summary, for life span and life course researchers, cross-sectional, one-time data are insufficient. Rather, life span development and life course researchers argue that cohort-sequential and longitudinal data are critical for developing the knowledge bases required to understand human development in a changing society. Such methodologies can also be used to formulate effective policies for attracting individuals to S&T and for facilitating their transition into productive careers. The presentations that follow are illustrations of the need for longitudinal research and the policy implications they suggest.
REFERENCES
Baltes, P. B. 1987. Theoretical Propositions of Life Span Developmental Psychology: On the Dynamics Between Growth and Decline. Developmental Psychology. 23:611-626.
Featherman, D. L. 1983. The Life Span Perspective in Social Science Research. Life Span Development and Behavior, P. B. Baltes and O. G. Brim, Jr., (eds) 5:1-59. New York: Academic Press.
Magnusson, D. 1993. Human Ontogeny: A Longitudinal Perspective. Longitudinal Research on Individual Development. 1-25. D. Magnusson and P. Casaer (eds). New York: Cambridge University Press.
Nesselroade, J.R. and P.B. Baltes (eds). 1979. Longitudinal Research in the Study of Behavior and Development. New York: Academic Press.
Quetelet, A. 1842. A Treatise on Man and the Development of His Faculties. Edinburgh: Chambers.
Schaie, K. W. 1965. A General Model for the Study of Developmental Problems. Psychological Bulletin. 64:92-107.
A Demographic Approach to Studying the Process of Becoming a Scientist/Engineer
Yu Xie
In this paper, I redefine career process as the collective experience of a birth cohort and propose a new demographic approach to studying the developmental process of becoming a scientist/engineer by following a synthetic birth cohort through its formative years of career development. The approach is dynamic rather than static, in the sense that it traces career changes over the life course of a cohort. At any given age, cohort members are identified as belonging to one of several states relevant to a scientific/engineering career. With data from longitudinal surveys, probabilities of cohort members' movements into and out of the different states are calculated as functions of age and population characteristics.
From these transitional probabilities, the process of becoming a scientist/engineer is modeled assuming a time-inhomogeneous Markov process commonly seen in standard multistate life tables. The time-inhomogeneity property of the Markov model makes an analysis adopting this approach non-parametric, descriptive, and capable of reproducing observed statistics with good data. Cross-sectional statistics on scientific careers can be generated from such a demographic model, for the size of any population is ultimately determined by inflow rates into and outflow rates out of the population.
The proposed approach has two important advantages over cross-sectional studies, which can only yield static snapshots of the population size with no information on the dynamic process of inflow and outflow. First, it makes it feasible to infer current and future descriptive statistics and other useful information on science/engineering (S/E) careers for any population or subpopulation with observed or hypothesized transition probabilities. Second, it allows the researcher to locate sources of attrition, especially for women and disadvantaged minorities, along the pipeline to becoming a scientist/engineer.
One major constraint for implementing the proposed approach in practical settings is the lack of longitudinal data, which are required for such dynamic analyses. When data from a true longitudinal design are unavailable, I propose that a synthetic cohort be constructed from different sources. For a demonstration of the new approach, I piece together data from two large data sets representing U.S. youth as they grow up between ages 13 and 32. The 1987-1991 Longitudinal Study of American Youth (LSAY) is used to obtain middle and high school students' (grades 7 through 12) interests in science education and changes of their interests over time. The 1972-1986 National Longitudinal Study of the Class of 1972 (NLS-72) is used to obtain information on years beyond high school, i.e., youth's probabilities of majoring in science, receiving science degrees at bachelor's and master's levels, and working in scientific occupations. Men and women are analyzed separately.
BASIC CONCEPTS AND METHODS
Cohort
In a classic article, Ryder (1965) defines a cohort as "the aggregate of individuals (within some population
definition) who experienced the same event within the same time interval" (p.845). For example, all individuals born at the same time (say within a given calendar year) make up a birth cohort. Similarly, events such as marriage and school entry also define marriage and school cohorts. In this paper, I assume the equivalence between birth cohorts and school cohorts up to secondary education. This is a reasonable assumption because most children start school at about the same age and progress through elementary and secondary education on a similar schedule. For students attending postsecondary schools, I pay closer attention to different schooling paths so that a person currently not in school may enter school at a later date.
Ideally, we would like to observe all career changes of a real cohort for its entire work-relevant history, from childhood to retirement. This would allow us to accurately model the life course career process of the cohort. Such longitudinal designs, however, are unrealistic in practice not only because they are too expensive, but also because they take too long and thus cannot yield even tentative answers to important questions currently faced by today's social scientists.
One common solution to this dilemma, often adopted by demographers in studies of fertility and mortality, is to construct age-specific vital rates from a cross section and assume them to be experienced by a hypothetical cohort. For instance, the total fertility rate is the expected total number of children a woman would have if she followed the entire age-specific fertility schedule of a given period, and life expectancy is the expected total number of years a newborn child would live if he or she were subject to the age-specific mortality schedule of a given period.
An excellent application of this approach to the study of scientific personnel is found in Berryman (1983), who compiled detailed cross-sectional statistics at salient points in the educational pipeline (such as degrees at all levels) by race and gender. One major drawback of this solution, however, is its inability to uncover dynamic processes underlying cross-sectional data. For example, Berryman was unable to examine the changes in enrollment status and field of study and their variations across gender and race, even though she clearly realized the importance of such transitions.
Limited longitudinal studies, a middle ground between purely cross-sectional designs and ideal longitudinal designs, have gained more popularity and acceptance in recent years. By limited longitudinal studies, I mean that researchers follow a group of subjects only for a limited duration. Examples are the NLS-72, LSAY, High School and Beyond (HS&B), National Educational Longitudinal Survey (NELS), and the Survey of 1982-1989 Natural and Social Scientists and Engineers (SSE).
Limited longitudinal studies could be cohort-based, such as NLS-72, LSAY, HS&B, and NELS, or population-based, such as SSE. While the sampling frames of NLS-72, LSAY, HS&B, and NELS were school cohorts, the sampling frame of SSE was the population of scientists identified by the 1980 U.S. census. Because there are currently many large, nationally representative, cohort-based limited longitudinal studies available, I propose to piece together the experiences of different cohorts to form a synthetic cohort. Here I define a synthetic cohort as a hypothetical cohort whose life history is constructed from different real cohorts in a supplementary manner. Even though the synthetic cohort is not real, segments of the cohort's experiences are real. One major advantage to this approach is that we can observe cohort members' transitions into and out of different states. This enables researchers to study "social dynamics" (Tuma and Hannan, 1984), which is not possible with cross-sectional data. See Figure 1 for an illustration of a synthetic cohort (LSAY1 and LSAY2 respectively refer to the first and second cohorts in LSAY).
Career Process Redefined
Traditionally, career process has been defined as an individual's career history.1 This is true in (1) trait and factor theory, social learning theory, and developmental theory in psychology (e.g., Brown and Brooks, 1990), (2) status attainment models in sociology (e.g., Sewell, Haller, and Portes, 1969), and (3) rational choice theory and human capital theory in economics (e.g., Freeman, 1971). One difficulty with this conventional perspective is that an individual's career choices not only change frequently over the life course, but also change in such irregular sequences that they cannot be easily characterized by a unidirectional development model.
In this paper, I redefine career process as the collective experience of a birth cohort. While individuals of the cohort may change their career choice frequently and irregularly, the cohort as a whole may well exhibit regular patterns of career process that are
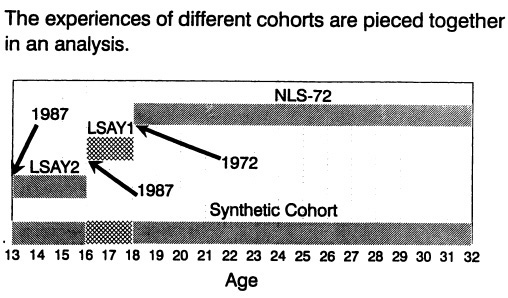
FIGURE 1 A synthetic cohort approach.
subject to scientific scrutiny.2 For a given cohort, the career process coincides with maturation and aging, as in the case of an individual. Different from the individual-based definition, however, the cohort-based definition of career process allows the researcher to characterize the process using aggregate statistics with a certain degree of accuracy. Take the process of becoming a scientist/engineer as an example. Over time, some members of a birth cohort may stay in, move into, or move out of the S/E pool. Transition probabilities for these movements and non-movements are interesting characteristics of the cohort. In this paper, I explain how to study a cohort-based career process using these probabilities.
"Bathtub" Model of a Population
Any population can be described by the "bathtub" model: some people move in from outside while some people move out from inside. Simple as it appears, the "bathtub" model is actually a dynamic model. If the outflow rate exceeds the inflow rate for a sustained duration, the "bathtub" would eventually dry out; if the inflow rate exceeds the outflow rate for a sustained duration, the "bathtub'' would eventually overflow.
Now consider the S/E pool as a population somehow-defined. For example, from early grades through high school, the population can be defined as students who are interested in science subjects and plan to attend college. In undergraduate and graduate years, the population can be defined as students majoring in science or obtaining science degrees. In the labor force, the population may be defined as workers in scientific occupations. As a birth cohort progresses through different stages, some cohort members move into the S/E pool while others move out of the pool. The task of a demographic analysis is to study the flows into and out of the pool and their implications for the process of becoming a scientist/engineer.
STATES AND TRANSITIONS
A state (denoted as s) is a distinct, well-defined, temporarily stable condition. A set of mutually exclusive and exhaustive states constitute a state space (denoted as S, s ∈ S, where S = 1, ... M). Let t denote time, which is assumed to be discrete in this paper (i.e., t = 1, ... 7).
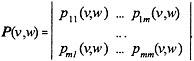
Transition probability, p (v, w), is the probability that an individual will be in state j at t=w given he or she is in state i at t=v (v < w):
p(v,w) = Prob(s=j, t=w|s=i, t=v).
Let P(v, w) be a square matrix that contains all elements of p(v, w):
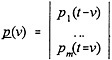
Likewise, the marginal (unconditional) distribution of states, pi(v), can be defined as
pi(v) = Prob(s=i,t=v).
Let ![]() be a column vector that contains all elements of pi(v):
be a column vector that contains all elements of pi(v):
From these definitions, it is easy to see the following relationship
(1)
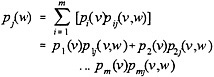
where P(v, w)' is the transpose of P(v, w). That is, the probability that a person is in the jth state at time w is:
(2)
MARKOV PROCESS
Markov processes are commonly assumed in multistate life tables (Namboodiri and Suchindran, 1987, Chapter 9). In this paper, I borrow this position and construct models based on the Markovian assumption.3 That is, it is assumed that the state distribution at time v+1, pi(v+1), only depends on the state distribution at time v, pi(v), not on state distributions prior to v. Note that the Markovian assumption does not rule out past history prior to time v as totally irrelevant to the state distribution at time v+1. It only states that past history prior to v is relevant to pi(v+ 1) only insofar as it affects pi(v). In the language of structural equation models, prior history has no direct effects, but only indirect effects through pi(v). The Markovian assumption means that we can obtain the marginal (unconditional) distribution of states at time v+1 from P(v, v+1) and ![]() :
:
(3)
Likewise,
(4)
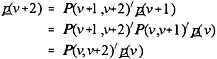
In general, the following chain rule is true:
(5) P(v,w) = P(v,v+1) P(v+1,v+2) ... P(w-1,w).
In other words, the transition probability matrix from time v to time w is the product of all transition probability matrices connecting time v and time w. One implication of the property is that skipping intermediate steps in calculating transition matrices is not significantly detrimental if they are not of primary concern, so long as we obtain information about transitions before and after the intermediate steps.
It should be pointed out that the Markov chain model described by equations (1) through (5) follows the tradition of multistate life tables (Namboodiri and Suchindran, 1987) in that all transition matrices are time-dependent and subject to non-parametric estimation. This contrasts to the alternative treatment assuming time-homogeneity or a parametric form for transition matrices, a class of Markov models frequently discussed in the literature on stochastic processes (e.g., Bartholomew, 1973). In a sense, the Markov model of equations (1) and (5) does no more than decompose the observed marginal distribution of a later period in terms of transitions and initial conditions of earlier periods, if data for a true cohort are used. This methodology has been applied to studies of labor force participation in the form of working life tables (Hoem, 1977) and schooling in the form of school life tables (Land and Hough, 1989). This paper extends it to the study of the career process of becoming a scientist/engineer with the construction of a synthetic cohort.
DATA
I combine data from two sources for the construction of a synthetic cohort between ages 13 and 32. The first source is the 1987-1991 LSAY, and the
second is the 1972-1986 NLS-72. In LSAY two high school cohorts were followed up every semester, one from grade 7 in 1987 to grade 10 in 1990 and the other from grade 10 in 1987 to grade 12 in 1989. The NLS-72 cohort was grade 12 in 1972 and was followed up in 1973, 1974, 1976, 1979, and 1986.4 I treat the three cohorts as if they were part of a single cohort. The surveys provide enough information to cover the hypothetical cohort continuously from ages 13 to 32.5
The pitfall of this research strategy is, of course, that the experiences of the synthetic cohort do not represent those of any real cohort. In this paper, the data sets used might be problematic, as the earlier years of the synthetic cohort were observed much later (starting in 1987) than the later years of the synthetic cohort (starting in 1972). Without better data, my analysis of the life course process of becoming a scientist/engineer assumes that career process is relatively stable, i.e., age-dependent rather than cohortor period-dependent. This assumption is consistent with an observation made more than 40 years ago by Ginzberg and his associates (Ginzberg et al., 1951) that the career process is a developmental process, thus, an age-dependent process.
Each fall, the LSAY survey asked high school students whether they would "enroll in a four-year college or university" upon graduation. I consider those students who answered "yes" as intending to obtain postsecondary education. The same questionnaire also asked whether students agree or disagree with the statement "I enjoy science" as follows: "strongly agree," ''agree," "not sure," "disagree," and "strongly disagree." I classify students who responded "strongly agree" and planned to enroll in a four-year college or university as belonging to the state of "intended science/engineering postsecondary education." This measure is constructed for all high school years of both cohorts in LSAY.
In each follow-up, NLS-72 respondents were asked to report their actual or intended fields of study if they were attending postsecondary school. The answers were coded into six-digit numerical codes. From the 1972 base year to the 1979 fourth follow-up, NLS-72 used a coding system described by A Taxonomy of Instructional Programs in Higher Education, commonly referred to as HEGIS (Huff and Chandler, 1970). For the fifth follow-up, NLS-72 changed to a new system described by A Classification of Instructional Programs (Malitz, 1981). From the two systems of instructional programs, I extracted a number of detailed codes as S/E fields of study.6 In 1976 and 1979, NLS-72 ascertained whether respondents had obtained bachelor's and master's degrees. For those with positive responses, NLS-72 ascertained detailed fields of their degrees. In the 1986 fifth follow-up, NLS-72 changed the question and collected information regarding respondents' highest degrees (from baccalaureates to doctorates); data on fields of degrees, however, were not collected. To solve this problem, auxiliary information is used with additional assumptions. Respondents who undertook postsecondary education between 1979 and 1986 were asked to report their latest fields of study. Thus, for a respondent who obtained additional postsecondary education and whose highest degree in 1986 was more advanced than or equal to his or her highest degree in 1979, his or her latest field of study is imputed as the field of his or her highest degree.
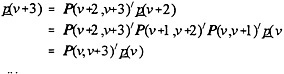
I hereby create the following seven educational states:
(0) secondary education or college dropout
(1) intended or actual non-S/E postsecondary education
(2) intended or actual S/E postsecondary education
(3) non-S/E bachelor's degree
(4) S/E bachelor's degree
(5) non-S/E master's degree
(6) S/E master's degree
Figure 2 presents schematic flows among the seven educational states; the solid lines represent typical flows and the dotted lines represent untypical flows.7
From the above operational definitions of the states, I calculate, separately for males and females, 13 transition probability matrices for the hypothetical cohort, given in Tables A1 and A2. The reported rates and counts were appropriately weighted to reflect the sampling designs and non-responses so that resulting transition rates are the best estimates of their corresponding conditional probabilities in the population.8 These transition rates are mainly used in analysis to be reported later. It appears that the use of different measures and different data sets may bias the empirical results. One way to check for potential biases is to compare marginal distributions at ages 16 and 18 that connect two different cohorts (see Figure 1) since these marginal distributions are observed twice. The comparison gives acceptable results (could be derived from Tables A1 and A2). It should also be noted that in the empirical analysis to be reported later, for all ages except the initial condition (age 13), only transi-
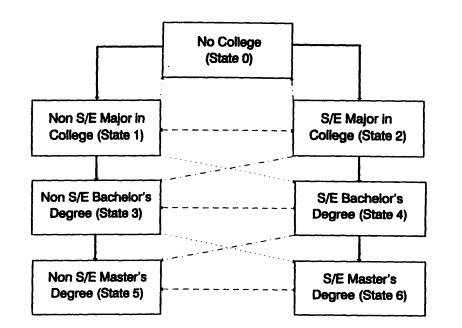
FIGURE 2 Schematic flows among seven educational states.
tion (not marginal) probabilities are used. Marginal distributions of later ages result from the cumulative product of prior transition matrices and the initial condition [as shown in equations (1) and (5)]. Thus, it would be a mistake to attribute the marginal distribution at any given age to the measurement of states at the same age.
RESULTS
Distribution of Educational States
Assuming an arbitrary cohort size of 1,000 and the initial state distribution at age 13 to equal that calculated from the LSAY survey, I simulate the distribution of educational states at each age for each sex using equations (1) and (5). Mortality is ignored here. The results of the exercise are presented in Table 1. For example, there are 5.4 and 18.3 females in a 1,000-member cohort whose highest degrees at age 32 are respectively master's and bachelor's degrees in science. The comparable figures are 12.0 and 40.5 for males. These statistics are close to cross-sectional statistics reported elsewhere (National Science Board, 1986).
Age Pyramid
In my earlier work (Xie, 1989), I hypothesized that the S/E pool forms an age pyramid, especially in early ages: for a given cohort, the pool depletes with age. This is true even though some youth move into the pool while some youth move out of the pool at the same time, because the exit rate exceeds the entry rate.9
Such an age pyramid indeed exists. After states (2), (4), and (6) are combined as the S/E pool, the pyramid is shown in Figure 3. The number of cohort members with S/E education steadily decreases from age 13 to age 23, and the decrease is faster for females than for males. After age 23, the pool increases slightly due to a small proportion of cohort members who start or resume postsecondary education after some disruption. This can be seen by the decrease in the number of cohort members in state (0) after age 23.
Sex Differences
One of the objectives of this study is to know where in the S/E education pipeline females fall behind males. It has been frequently speculated in the literature that females are severely disadvantaged relative to males in
TABLE 1 Distribution of Educational States by Age and Sex for a Synthetic Cohort
SOURCE: Sums of columns 2, 4, and 6 in Table 1.
FIGURE 3 Age pyramid of cohort members with S/E education in a 1000-member cohort.
early ages. In the executive summary of her report to the Rockefeller Foundation, for example, Berryman (1983) remarked that "strategies to increase the size of the initial scientific/mathematical pool of minorities and women should be targeted before and during high school" (p.7).
Sex ratio, a simple measure of the composition by sex, is defined as the number of females to the number of males. Figure 4 depicts the sex ratio measure in the S/E pool by S/E educational state and age. It is evident that the greatest drops in sex ratio occur between ages 17 and 18, around high school graduation. It should be pointed out that this new finding cannot be simply attributed to the different measures used for the LSAY1 and NLS-72 cohorts, for the same measures are used for both males and females within each cohort.10 In addition, the most drastic drop for females occurs between ages 17 and 18 (117.5 to 52.7 per 1,000, Table 1), within the same LSAY1 cohort. One explanation is that young women of ages 17-18 are more knowledgeable about, or more influenced by, than ever before, occupational sex segregation in the labor force, while having to make realistic decisions about career, marriage, and family. Thus, around high school graduation, many more women than in earlier years are discouraged from pursuing S/E careers.
Equation (5) means that the process of becoming a scientist/engineer is a cumulative process. What happens at each stage contributes to the final outcome. Thus, a large change at one single stage may only have a small ripple effect on the final outcome. In Table 2, I sequentially substitute males' transition rates for females' at different ages to reveal the effects of the substitution on narrowing the gender gap in educational outcome at age 32. Surprisingly, the effects are all small prior to college years.
Next, let us ask the following counter-factual question: How much reduction in sex differences at age 32 would occur if there were no sex differences in initial distribution of educational states at an earlier age? To answer this question, I forced gender equality by assigning males' marginal distribution of educational states to females at ages prior to 32 and observe changes in the gender gap at age 32. The results of this exercise are reported in Table 3. Each line in Table 3 represents the remaining gender gap in educational states at age 32 after the marginal distribution is equalized at an earlier age. For example, sex differences in high school contribute little (between 0.1 and 2.2 percent) to the sex differences in outcomes at age 32. However, these results, combined with those from Table 2, do not mean that sex differences before age 19 were small. As we have seen in Figure 4, the differences are large, especially at age 18. The results simply mean that the large sex differences observed in high school years are absorbed by sex differences in the educational process of college and graduate years. That is, if conditions in high school were radically changed so that females and males were equally interested in pursuing S/E careers, women would still be underrepresented as long as conditions remain the same in later years.
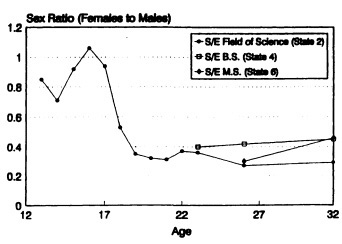
SOURCE: Columns 2, 4, and 6 in Table 1.
FIGURE 4 Sex ratio of cohort members with S/E education by age and educational states.
TABLE 2 Number of Females in Science/Engineering Educational States at Age 32 if Male's Transition Rates Were True for Females at Different Ages
Exit and Entry Rates
Given our simple "bathtub" model, women's underrepresentation in S/E educational states could result from two sources: women's exit rate from S/E states is higher than men's or women's entry rate into S/E states is lower than men's. Two series of exit and entry rates are displayed in Figures 5 and 6.11 In calculating the rates, I combined the three S/E states into a single state and lumped the four non-S/E states into another state. An interesting result is that the exit rate for females trails that for males closely except at age 17. A larger and more consistent gender gap, however, is observed for the entry rate after age 17. From these two figures, I infer that a large portion of the gender gap in attaining S/E education is not merely due to women's higher likelihood to exit the S/E pool. Men are just as likely as women to drop out of the S/E pool, but their likelihood to enter or re-enter the pool once out of it is significantly higher, particularly in later years. Unfortunately, past research has not paid attention to this problem. For example, my results contradict Berryman's (1983, p.7) assertion that "after high school, migration is almost entirely out of, not into, the pool" (emphasis original). For males, I have found that the rate of migration into the pool is around 4 percent, compared to less than 2 percent for women.
As small as they may seem, cumulatively these figures are very significant given that only 2 percent of females and 5 percent of males obtain bachelor's and master's degrees in science by age 32 (see Table 1).
S/E Occupations
Education affects occupation, but only in nondeterministic ways. Obtaining S/E education means that one's likelihood of working in a S/E occupation significantly increases, but it cannot be equated with S/E occupation. In fact, Table 4 shows that only 9 percent of females and 35 percent of males with S/E bachelor's degrees have S/E occupations at age 32. At the master's level, the percentages are better, 27 percent for females and 54 percent for males.
In Table 5, I present simulated occupational distributions at age 32 under four different conditions.12
TABLE 3 Number of Females in S/E Educational States at Age 32 if Male's Distribution Were True for Females at Different Ages
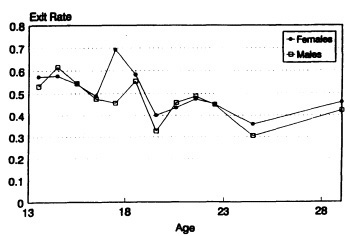
SOURCE: LSAY and NLS-72.
FIGURE 5 Exit rate from S/E educational pool by age and sex.
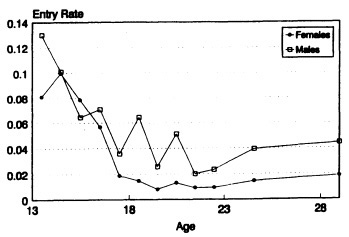
SOURCE: LSAY and NLS-72.
FIGURE 6 Entry rate into S/E educational pool by age and sex.
In Panel A, females' educational distribution at age 32 (last line, Panel A of Table 4) is used. In Panel B, males' educational distribution at age 32 (last line, Panel B of Table 4) is used. Within each panel of Table 5, two lines represent two sets of transition rates from educational states to occupational states, one for females and one for males. Thus, the first line of Panel A and the second line of Panel B are simulated distributions respectively for females and males using gender-specific information. That is, for a 1,000-member female cohort following the age-specific transition rates observed for our data, only 14.5 of them work as scientists/engineers at age 32. The comparable number is 59.5 for a 1,000-member male cohort. Most of the gender gap is due to women's lower likelihood to work as scientists/engineers given the same educational background. If females had the same distribution of educational states as males, female scientists/engineers would increase to 17.5 per 1,000 (first line of Panel B). However, if females had the same Table 4 transition rates from educational states to occupational states at rates of transition from education to occupation as males, female scientists/engineers would increase to 49.8 per 1,000. Therefore, women's lower achievement in attaining S/E education can only explain a small fraction (about 10 percent) of the gender gap in attaining S/E occupations.
CONCLUSION
In brief, I offer the following conclusions:
-
This paper proposes a new demographic approach to studying the process of becoming a scientist/engineer.
-
The proposed approach consists of constructing a synthetic cohort from different longitudinal surveys and modeling the career process as a Markov process as the cohort ages (or matures).
-
An age pyramid in the S/E educational pool is found to exist. Generally speaking, for any given cohort, the proportion of people remaining in the pool decreases with age.
-
Women's representation in the S/E educational pool drops suddenly near high school graduation (between ages 17 and 18).
-
College and graduate years account for most of the sex differences in the proportion attaining science degrees by early adulthood.
-
Men and women differ more in the entry or reentry rate into the S/E educational pool than the exit rate out of the S/E educational pool.
-
Women's underrepresentation in S/E occupations is mainly due to women's lower likelihood of being employed in S/E occupations net of differential access to S/E education rather than women's lower likelihood of having a S/E education.
TABLE 4 Transition Rates From Educational States to Occupational States at Age 32 by Sex
TABLE 5 Simulated Occupational Distribution at Age 32 Under Different Assumptions
|
Occupational States |
||||
|
Educational State |
Not Working |
Non S/E |
S/E |
(n) |
|
Panel A: Females' Educational Distribution is Used (Last Line, Panel A of Table 1) |
||||
|
Females' Transition Rates are Used (Panel A of Table 4) |
301.8 |
683.6 |
14.5 |
(1000) |
|
Males' Transition Rates are Used (Panel B of Table 4) |
112.7 |
837.5 |
49.8 |
(1000) |
|
Panel B: Males' Educational Distribution is Used (Last Line, Panel B of Table 1) |
||||
|
Females' Transition Rates are Used (Panel A of Table 4) |
302.1 |
680.4 |
17.5 |
(1000) |
|
Males' Transition Rates are Used (Panel B of Table 4) |
112.5 |
828.0 |
59.5 |
(1000) |
|
NOTE: Rates of transition from education to occupation by sex are reported in Table 4. |
||||
NOTES
|
1. |
As Elder (1985) recognizes, the concept of career has been generalized to the concept of trajectory in the literature on life course. |
|
2. |
This is akin to Quetelet's (1842) notion of the "average man," or the "social man." One major difference, however, is that I aim merely at characterizing a population or a subpopulation, whereas Quetelet's objective was to capture the "essence" of a society. |
|
3. |
One major difference between what I propose here and conventional multistate life tables is that age is used here as a truly discrete variable (actually school age) whereas it is usually used as a continuous variable in multistate life tables. Using age as a discrete variable is legitimate in the present case given that transitions in school take discrete jumps annually (grade or class). |
|
4. |
The 1986 follow-up was a nonrandom subsample with full coverage of college graduates. Other sample members who were retained with certainty included Hispanics, teachers and potential teachers, and persons who were divorced, widowed or separated from their spouses, or never-married parents. This problem is handled by weighing observations by the inverse of the probability of being included. |
|
5. |
Biological age is actually an approximation, translated from school age as shown in Table 1. |
|
6. |
Social science fields are excluded from this study. The detailed codes and titles are available upon request. |
|
7. |
There are other possible flows (such as jumping from not being in college to having a master's degree) that are observed in Tables A1 and A2 due to lack of data between two observation periods. |
|
8. |
Since the sample sizes are large for all transition matrices, sampling errors are ignored in the analysis. |
|
9. |
See also Berryman, 1983 (p. 4). |
|
10. |
Unless, of course, it can be shown that at least one of the measures is gender-biased. |
|
11. |
Midpoints of transition intervals are used for the horizontal axis (age) in Figures 5 and 6. |
|
12. |
S/E occupations were recorded from detailed three digit 1970 census occupational codes. |
I thank Paul Baltes, Chris Bettinger, William Frey, Kenneth Land, Scott Long, Rob Mare, Jon Miller, Andrei Rogers, and Peter Tiemeyer for their comments and/or advice.
TABLE A1 Matrices of Transition Among Educational States, Females
TABLE A2 Matrices of Transition Among Educational States, Males
REFERENCES
Bartholomew, D. J. 1973. Stochastic Models for Social Processes, 2nd edition. London: Wiley.
Berryman, S. E. 1983. Who Will Do Science? A special Report, the Rockefeller Foundation.
Brown, D., L. Brooks and Associates (eds). 1990. Career Choice and Development, 2nd edition. San Francisco: Jossey-Bass Publishers.
Elder, G. H., Jr. 1985. Perspectives on the Life Course. Pages 23-49 in Life Course Dynamics: Trajectories and Transitions, 1968-1980, edited by Glen H. Elder, Jr. Ithaca, NY: Cornell University Press.
Freeman, R. B. 1971. The Market for College Trained Manpower: A Study in the Economics of Career Choice. Cambridge, MA: Harvard University Press.
Ginzberg, E., S. W. Ginsburg, S. Axelrad, and J.L. Herma. 1951. Occupational Choice: An Approach to a General Theory. New York: Columbia University Press.
Huff, R. A. and M. O. Chandler. 1970. A Taxonomy of Instructional Programs in Higher Education. Washington, D.C.: U.S. Printing Office.
Hoem, J. M. 1977. A Markov Chain Model of Working Life Tables. Scandinavian Actuarial Journal, 1-20.
Land, K. C. and G. C. Hough, Jr. 1989. New Methods for Tables of School Life, With Applications to U.S. Data from Recent School Years. Journal of the American Statistical Association, 84:63-75.
Malitz, G. S. 1981. A Classification of Instructional Programs. Washington, D.C.: U.S. Printing Office.
Namboodiri, K. and C. M. Suchindran. 1987. Life Table Techniques and their Applications. Orlando, FL: Academic Press.
National Science Board. 1986. Undergraduate Science, Mathematics and Engineering Education. Report of the NSB Task Committee on Undergraduate Science and Engineering Education.
Quetelet, L. A. J. 1842. A Treatise on Man and the Development of his Faculties, a facsimile reproduction of the English translation of 1942. Gainesville, FL: Scholar's Facsimiles and Reprints, 1969.
Ryder, N. B. 1965. The Cohort as a Concept in the Study of Social Change. American Sociological Review, 30:843-861.
Sewell, W. H., A. O. Haller, and A. Portes. 1969. The Educational and Early Occupational Attainment Process. American Sociological Review, 34:82-92.
Tuma, N. B. and M. T. Hannan. 1984. Social Dynamics: Models and Methods. San Francisco: Academic Press.
Xie, Y. 1989. The Process of Becoming a Scientist. Unpublished Dissertation, University of Wisconsin.
Human Resources in Science and Technology and the Less Developed Countries Of Europe (EC-12)
Emilio Muñoz1
The study of human capital is a crucial issue in the attempt to develop regional strategies that increase the potential capabilities of the less favored regions in regard to their own social and economic progression. However, the knowledge of the problem has been hampered by its relevance, its intrinsic complexity, and its multifaceted nature.
One reason for this is that the subject does not depend on a single area of policymaking but rather deals with several: education, employment, and economic policy, as well as the influence of scientific and technological policy on economic and social development.
A second reason for the difficulty in treating this issue lies in the diversity, as well as in the complexity, of the indicators needed to afford an exact diagnosis of the problem for further action. In some cases the indicators are too broad to tune up appropriate reflections. In other cases they appear too specialized and/or excessively reliant on old-fashioned taxonomies to gain the right perception.
All of these shortcomings have a particular significance when one attempts to understand the realities hidden under the realm of science and technology in relation to the less developed regions of Europe. We cannot forget that these regions possess characteristics of industrialized countries and, as such, are part of global projects [i.e., for operational purposes like EC-12 or for analytical targets like the Organization for Economic Cooperation and Development (OECD)].
In this study we will cover some of the key topics related to educational and employment policies, albeit in a general way, and later delve into the science and technology issues concerning human resources and their implications on socioeconomic development.
EDUCATIONAL POLICY
The European countries share, to a great extent, an educational tradition modeled by the deep processes of great historical-cultural events, such as romanticism, Christianization, and the incorporation of realism.
The present educational guide is the result of a combination of four main approaches:
-
The inheritor of medieval tradition that promotes the transmission of the classical idea of culture
-
The approach that sees the encyclopedic view and defends the diffusion of all available knowledge
-
The polytechnic approach that emphasizes the transfer of skills useful for the economy and productivity
-
The pragmatic approach that supports the idea of the preparation of the individual to cope with the problems of ordinary life
This mixed view has taken education to a point
where, in spite of the differences between countries and government, European schools are studying almost the same content in every country.
Broadly speaking, the European curriculum has been built within a framework of knowledge based on the disciplines, where progress is continuously being incorporated, without taking into account the global approach of looking inside the psycho-pedagogy focal point.
Along these lines, the idea of an everlasting educational crisis is present. This is due to the nature of the educational process itself, in which it is necessary to find adequate interplay between the information transmitter (the teacher) and the receiver (the pupil), together with the essential universality of the contents being taught.
It is worth noting, paradoxically, that in a moving field like education, the application of conservative policies appear to give better results than that of innovative policies. This implies that the evolution trend in educational affairs follows a vicious circle.
In spite of the strong momentum given to education in the late 1940s in western Europe, it is generally believed, at the present time, that European education does not fulfill the requirements raised by economic, cultural, technical, and societal needs. This controversial issue has opened up a debate between teaching staff and public administrators about the resources deemed necessary to reach the appropriate targets.
In the developed countries, education is not a first priority as it has to contend with other highly relevant issues like unemployment, the incorporation of young people into the labor force, social protection, and environmental preservation. Consequently, the public expenditure rate on education has been decreasing in most countries (see Figure 1). However, be reminded that the data, as previously mentioned, is too general and, by the lack of disaggregation level, does not allow conclusions with a good degree of acuteness for analyzing regional disequilibria.
In any case, the data shown reveal that public expenditure is smaller in countries with less development and a greater heterogeneity, and present a clear-cut geographical distribution between a highly developed north and a less developed south. Therefore, the expenditure per capita, as illustrated in Table 1, confirms this trend: the positions at the bottom of the table are held by countries with less developed regions. Against this background the change in educational pat
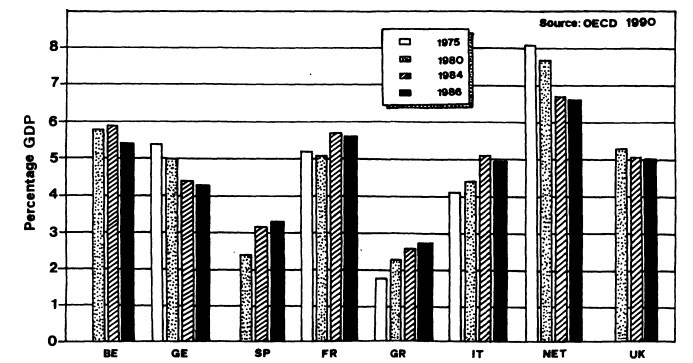
SOURCE: Investigación y Ciencia, December 1992.
FIGURE 1 Evolution of public expenditure on education in some community cultures.
TABLE 1 Public Expenditure on Education per Capita In U.S. Dollars (Purchasing Power Parity) in the EC Countries
|
Denmark |
934 |
|
Netherlands |
838 |
|
France |
746 |
|
Belgium |
745 |
|
United Kingdom |
703 |
|
Italy |
690 |
|
Germany |
581 |
|
Portugal |
470 |
|
Ireland |
461 |
|
Luxembourg |
421 |
|
Spain |
302 |
|
Greece |
231 |
|
SOURCE: Investigación y Ciencia, December 1992, and elaboration of our own. |
|
terns seems a necessity, although the direction of change is not clear.
The EC Commission is aware of the need and has undertaken some steps to follow in higher education and professional training, but, at the same time, it has been looking to adapt the diverse educational systems into a common ground in order to facilitate the free circulation of skilled personnel.
The economic implications of educational policies are also being recognized. Big, multinational enterprises and owner-operated organizations have expressed their views on the need for a greater number of scientists, engineers, and technicians.
This demand resists the diminishing interest of young Europeans to study in the scientific and technical domains. Therefore, there exists a social debate about the main trend to be followed in the educational process as a whole and in relation to the apparent conflict between classical culture and that oriented toward empirical and practical goals. The debate has extended to secondary schools. In the developed western European countries, this training is strongly related to well-reputed professional skills and, therefore, asks for a separation of a more general primary school. A major part of the blooming of the manufacturing industry in the German and Dutch regions lies in their asset of a highly skilled human capital. The situation is yet different in southern European countries, in spite of their efforts during the last few years to correct it.
Comments and Conclusions on Educational Issues Related to Human Capital
It seems that there are still important differences in the educational profiles of developed and less developed countries. The main differences stem from the resources earmarked, the qualifications of the teaching staff, the suitability of the facilities, the characteristics of the secondary school and its relationship with professional training, and the connection of education with the labor market. The schooling rates of young Europeans at two ages in the EC countries are shown in Figure 2.
It is worth mentioning that the differences remain current at the present time and are being distinguished by a situation of general crisis of public support to educational policies. The forecast is, therefore, negative, in the sense that the differences are likely to remain the same or get worse. The adjustment of this trend cannot stand by single declarations of intent alone, but requires a real strategic policy with the availability of resources and appropriate goals.
On the other hand, to afford adequate response to the great variety of pressing demands, the educational system needs an important effort of flexibility and versatility. This implies, as in many other areas of the public arena, a better bond between expanding the social and economic agents and the pervading regional and local responsibilities (decentralization).
It is, therefore, essential to foster the participation of these agents (owners, trade unions, and regional and urban authorities) in designing, launching, and steering the educational policies, mainly in professional training and higher education. One cannot forget the high rate of unemployment for the young labor force in the less developed regions of Europe. Spain, for instance, had 50 percent of its population unemployed in the mid-1980s. Although this rate decreased during the last half of the decade, the values are still very high.
Using a biological analogy, it seems to us very pertinent to favor this selection of the population by putting it in touch with the adequate environment (i.e., the community must engage students once they have finished their education). In other words, it is necessary for the socioeconomic forces to play a role in helping administrators define educational policies. Alternatively, it is not possible to tackle the problem of heterogeneity by having a recourse to a blind, common, general force, or mechanism, for selection.
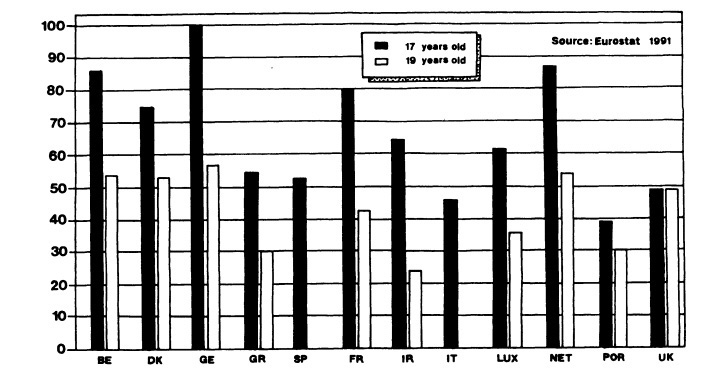
SOURCE: Investigación y Ciencia, December 1992.
FIGURE 2 Schooling rates (in percent) of Europeans at two ages.
EMPLOYMENT
Similar considerations can be applied to the employment situation. The evolution of the labor force in developed countries is characterized by the following trends:
-
A substantial increase in the percentage of highly skilled and white collar personnel. (In some countries these professionals account for 60 percent of the active population.)
-
A decrease, or stagnation, in the percentage of workers addressed to the primary or tertiary sectors (farming and services).
-
A remarkable reduction in the percentage of manual workers (not related to agriculture), showing figures below 30 percent.
Therefore, developed societies appear to be, to a great extent, middle-class societies in which there is a continuous decrease in the number of manual workers in industry and services.
However, it is not clear whether the evolution from the less developed condition to the developed one is going to follow a gradual pattern or experience more abrupt changes derived from the availability of new technologies. The latter is already being seen in developing countries like those in Asia.
So, the data indicate that in the evolution process there is no substantial increase in the percentage of industrial workers. It is noteworthy to highlight the rise in the number of qualified professionals, administrative personnel, traders, and dealers.
This pattern denotes an evolutionary trend from developing countries to that of western developed countries before reaching a labor force profile of industrialized countries.
Again, this raises the conflict of world globalization with the singularities of every region. In this conflict, the market influences the international situation through the forceful behavior of multinational firms.
The wrestling of this mode of action with regional specifications and disequilibria is a key issue of reflection that pervades this paper.
REGIONAL ANALYSIS AND SOCIOECONOMIC PARAMETERS
In this section, we will overview some macro-structural variables that may influence innovation in EC Objective 1 Regions.
Demographic Trends and Labor Force
As a whole, the European Community's demographic evolution of the 1990s will remain stable at a figure of some 325 million people. For the period 2000-2015, an estimated decline of 1-4 percent is expected. With respect to the 1990 figure, in absolute figures, a decrease of 12 million people is foreseen.
However, differences among regions are, and will likely be for a long time, outstanding. During the present decade, the recessive demographic trend will consolidate firmly in most northern countries—Germany, Luxembourg, Belgium, and Denmark. It is presumed that prospective new member states of the EC will belong to this category. For three southern countries—Greece, Italy, and Portugal—a major change in population figures is not expected until the year 2000. On the other hand, France, the Netherlands, Spain, and the United Kingdom will likely undergo a moderate population increase, reaching demographic stability in the year 2000, whereas later evolution will invert this trend back to the 1990 figures in the year 2015. Ireland is expected to have a positive demographic growth at least until 2015.
Demographic trends will have a marked influence on labor markets. The EC labor force, as a whole, will slightly increase by 0.1 percent during the 1990s. This figure conceals the quick increase in many of the less favored regions—Ireland, Spain, Portugal, and Southern Italy—with a much more moderate growth, even a decrease, in the labor force in other member states. This does not, however, take into account the impact of immigration from countries outside the community. In absolute figures the increase in the community's labor force, based on its own demographic evolution, will only rise to 1.5 million people. This results from a 2 million increase in southern regions and a 0.5 million decrease in other areas of the community.
Capital intensive and highly profitable technological innovation, usually labor saving, has a broad market in northern countries, while southern countries will likely find difficulties in attracting investment for the creation of labor intensive businesses and/or economic activities, with massive jobs creating spillover factors (i.e., the car industry during the 1980s played this role in some less favored regions and seems to have exhausted its potential to go on with their positive activity).
ECONOMIC INDICATORS
Human Resources
From 1984 to 1990, employment in the community grew at an annual rate of 1.25 percent, resulting in a net increase of almost 9.5 million jobs. Each member state registered an increase in employment between 1985 and 1990, with great variability among them. For instance, the less favored regions in southern Spain and Portugal, to a lesser extent, enjoyed important increases in their employment figures.
By sectors, the 1980s saw the continuation of former trends of employment drift from industry to tertiary activities (services). From 1983 to 1988, the employment percentage in the tertiary sector in the community rose from 55 to 59 percent, while industrial employment decreased from 35 to 33 percent.
Although the community passed through a phase of positive employment growth, it is not at all clear if this growth was evenly distributed at the regional (NUTS II) level to be of any help in reducing the differences in unemployment and activity rates between more and less favored regions of the EC. Data show that the EC unemployment rate has decreased since 1986 but still ranked at about 8.3 percent in 1990. Among the factors that hinder job creation, especially in southern countries, are positive demographic growth, increased access of women to the labor market, and cyclic variation in activity, indicators combined with secular trends in the reduction of nonspecialized jobs. Concerning NUTS II level, differences are again substantial. On the one hand, there are 12 central regions with unemployment rates of less than 3 percent, while on the other hand 19 regions registered unemployment rates higher than 15 percent. (All figures refer to 1990.) Italy provides a special case. In 1990, it had the greatest inner regional disparities among all member states; some northern and central regions, such as Emilia-Romagna and Lombardy, showed unemployment rates less than 5 percent while most of the Mezzogiorno region suffered rates higher than 20 percent.
Disparities in Productivity and Income
Differences among the EC regions, with respect to income per capita, is very acute. In 1988 the income per capita of the 10 most advanced regions was 3 times higher than that of the 10 less favored regions. These differences have remained stable since 1986 even though less favored countries achieved rates of economic growth higher than the community average and raised expectations of economic convergence. For instance, in 1986-1987, Spain, Ireland, and Portugal began a gradual movement of convergence toward the average EC gross domestic product (GDP) per capita, whereas Greek GDP per capita worsened. At the regional level, the average figure for the 25 less favored regions increased slightly with respect to the average EC GDP per capita. Nevertheless, there has been no progress among 10 less favored regions (mainly in Greece and Portugal) since the mid-1980s.
Besides these disparities, there are others with regard to productivity. In 1984 a slight trend of reduction of these disparities began among member states due to the improvement of the relative productivity in Portugal and Ireland. However, this trend stopped after 1987.
Educational Opportunities and Training Facilities
Generally speaking, income per capita and unemployment differences reflect inter-regional disparities in productivity and competitiveness. Less productive and competitive regions face problems of generating higher and more evenly distributed income and of job creation. A lack of local infrastructures, mainly suitable in regions with more central and advanced ones, and a lack of a skilled workforce are crucial factors that hinder advances in economic competitiveness.
The problem of a lack of a skilled labor force is common to all regions within the EC. However, the causes differ according to their degree of development. In the more favored regions, fair economic conditions during the last decade have resulted in an imbalance between the competencies (and costs) demanded by firms and what the educational systems were able to supply. An additional problem is the re-skilling needed by an aged labor force in declining industrial areas. In less favored regions the lack of skilled personnel is due to the absence of modern and appropriate education and training facilities; the lack of cooperation of potential employers; rigid and outdated curricula; the lack of specialized and updated teaching staff; a very low degree of participation of active economic agents (union, firms, regional economic boards, etc.) in their planning and monitoring; and the absence of prospective and evaluative programs that are concerned about the adjustment between human resources supply and demand, work quality, and the encouragement of low level innovation activities. Lack of entrepreneurial skills and the absence of up-skilling training opportunities for the employed and unemployed are also problems widely present in these regions.
SCIENTIFIC AND TECHNOLOGICAL DEVELOPMENT
From the current views of economic policy analysis, it seems evident that more and more innovation and investment in science and technology are key components for improving the competitive positions of societies.
The idea that technology is an endogenous product for economic wealth, as well as the suspicion that a science-technology system acts as a feedback mechanism fostering social and economic progress far beyond its initial value, is gaining strong support.
Measurement of Science and Technology
Science, technology, and technological innovations are all abstract concepts that cannot be measured in a direct way. Although it might be interesting from a global point of view to treat science and technology activity as a defined subunit of economic performance, it is indeed difficult to correlate the factors influencing science and technology as inputs with economic outputs.
The most conventional indicators used currently, as both an input measurement of efforts devoted to research and development (R&D) and a part of the science and technology system, are those measuring economic and human resources. They are usually expressed as a percentage of GDP allotted to these activities and as a number of full-time equivalent researchers per unit of active population.
In-depth analysis reveals limitations in the applicability of these indicators with regard to specificities and subtleties of microenvironments in order to afford policies from a disaggregated point of view.
On the one hand, these indicators are too broad to allow the detection of the quality of the political measures undertaken on their basis. On the other hand, in spite of the international efforts made by OECD and Eurostat for homogenization and comprehensive accountability of R&D statistics, there is an evident absence of homogeneity in the information supplied by countries, leading to gaps in the collected data. All these difficulties are absolutely relevant for the purpose of this study, and so pervade it.
Therefore, one of the conclusions of this study will ask for better homogenization of indicators in terms of regional distribution and for an improvement in the type of indicators measuring human resources, both in absolute terms and in connection with education and employment. This information may allow the identification of the real potential in science and technology in less developed countries and regions, thus providing better insight for a comparison of these potentials with those of developed countries.
By doing so, we are following similar demands of science policymakers who are increasingly asking for new science and technology indicators (J. De Mother, Science and Public Policy, Vol. 19, p. 401-406, 1992). The debate on R&D indicators is a live question as shown by recent workshops of organizations such as OECD and Eurostat, or by the recent publication of a special issue of Science and Public Policy (Vol. 19, Numbers 5 and 6, October and December 1992).
In other words, we deem essential the disposition of data measuring disequilibria, as well as the relative strengths and weaknesses needed to promote political measures for science and technology other than those traditionally applied from the developed countries. A similar conclusion has been drawn by others. (See Padzerka as cited by J. A. D. Holbrook in Science and Public Policy, Vol. 19, Number 5, p. 266, 1992.)
Economic Resources Devoted to R&D
The data available on R&D expenditure for the EC-12 less developed countries shows an uneven situation. For instance, Ireland is devoting between 0.8-0.9 percent of its GDP to R&D as a continuous trend. Italy is allocating more than 1 percent to these activities, whereas Spain, Portugal, and Greece have traditionally lagged behind. However, these three countries are making efforts to correct this trend at different rates. (See Figure 3.)

FIGURE 3 Evolution of R&D expenditure in the EC less favored countries.
TABLE 2 Regional Distribution of Expenditure in R&D Activities in Relation to Regional Gross Product, by Actors in Spain, 1988
|
Regional Communities |
GDP |
Intramural Expenditure in R&D by Sectors (millions of Pesetas) |
||||||||||
|
Total Thousands |
Total Actors |
Enterprises |
Public Admin |
University |
NPI |
|||||||
|
of millions |
Percentage |
Million |
Ratio/GDP |
Million |
Ratio/GDP |
Million |
Ratio/GDP |
Million |
Ratio/GDP |
Million |
Ratio/GDP |
|
|
Andalusia |
5,018 |
13.4 |
21,672 |
0.43 |
8,147 |
0.16 |
6,561 |
0.13 |
6,964 |
0.14 |
|
|
|
Aragon |
1,250 |
3.3 |
6,938 |
0.56 |
2,684 |
0.21 |
2,027 |
0.16 |
2,222 |
0.18 |
5 |
0.00 |
|
Asturias |
980 |
2.6 |
4,380 |
0.45 |
1,964 |
0.20 |
961 |
0.10 |
1,455 |
0.15 |
|
|
|
Balearics |
879 |
2.4 |
824 |
0.09 |
201 |
0.02 |
148 |
0.02 |
373 |
0.04 |
102 |
0.01 |
|
Canaries |
1,463 |
3.9 |
2,591 |
0.18 |
46 |
0.00 |
1,073 |
0.07 |
1,451 |
0.10 |
21 |
0.00 |
|
Cantabria |
484 |
1.3 |
2,471 |
0.51 |
933 |
0.19 |
543 |
0.11 |
957 |
0.20 |
38 |
0.01 |
|
Castile and Leon |
2,266 |
6.1 |
11,548 |
0.51 |
7,316 |
0.32 |
726 |
0.03 |
3,488 |
0.15 |
18 |
0.00 |
|
Castile and La Mancha |
1,449 |
3.9 |
2,142 |
0.15 |
1,516 |
0.10 |
390 |
0.03 |
236 |
0.02 |
|
|
|
Catalonia |
7,033 |
18.8 |
55,565 |
0.79 |
40,501 |
0.58 |
5,831 |
0.08 |
8,632 |
0.12 |
601 |
0.01 |
|
Comm. of Valencia |
3,712 |
9.9 |
12,469 |
0.34 |
6,008 |
0.17 |
1,856 |
0.05 |
4,331 |
0.12 |
274 |
0.01 |
|
Extremadura |
685 |
1.8 |
2,152 |
0.31 |
457 |
0.07 |
1,023 |
0.15 |
672 |
0.10 |
|
|
|
Galicia |
2,131 |
5.7 |
6,065 |
0.28 |
1,953 |
0.09 |
2,085 |
0.10 |
2,027 |
0.10 |
|
|
|
Madrid |
5,614 |
15.0 |
120,661 |
2.15 |
67,471 |
1.20 |
40,968 |
0.73 |
11,511 |
0.21 |
711 |
0.01 |
|
Murcia |
952 |
2.5 |
3,675 |
0.39 |
1,191 |
0.13 |
1,455 |
0.15 |
1,026 |
0.11 |
3 |
0.00 |
|
Navarre |
618 |
1.7 |
2,310 |
0.37 |
2,112 |
0.34 |
198 |
0.03 |
|
|
|
|
|
Basque Country |
2,545 |
6.8 |
24,452 |
0.96 |
20,663 |
0.81 |
723 |
0.03 |
3,069 |
0.12 |
27 |
0.00 |
|
La Rioja |
322 |
0.9 |
354 |
0.11 |
237 |
0.07 |
117 |
0.04 |
|
|
|
|
|
Ceuta and Melilla |
95 |
0.3 |
|
|
|
|
|
|
|
|
|
|
|
No Regional * |
|
|
7,419 |
|
|
|
|
|
6,952 |
|
467 |
|
|
SPAIN |
37,401 |
100.0 |
287,688 |
0.77 |
163,370 |
0.44 |
66,685 |
0.18 |
55,366 |
0.15 |
2,267 |
0.01 |
|
* Includes some universities: UNED (Open University), Private University of Navarre and Fellowships; and NPI: Grants to individuals. SOURCE: R&D Statistics, 1988. Regional Accountability of Spain, 1985 Base, 1985-1988 Series. |
||||||||||||
This path of heterogeneity is even more acute when the data on R&D expenditure are presented from a regional perspective (as it is now possible to do for Spain and Italy). Table 2 shows the data corresponding to the regional distribution of 1988 R&D expenditure in Spain. One region, Madrid, possesses a level convergent with that of the EC average (2 percent of GDP), while none of the other regions reach 1 percent.
The inequitable model is also sustained by Italy but with a distinct shape. Nearly 92 percent of the total national expenditure in 1987 was concentrated in northern and central Italy (representing about 64 percent of the Italian population). The remaining 8 percent was spent by southern Italy, with 36 percent of the demographic force. (See Table 3.) On the other side, the regional distribution in this meridional part of Italy presents a more uneven distribution. (See Table 4.)
Data available for Portugal points to the same direction, since about 70 percent of R&D expenditure takes place in the region near Lisbon.
Human Resources in Science and Technology
Human resources are the most important component of any national research system. As a logical consequence, personnel data represent the second main input indicator of R&D activities. However, its incorporation to this pertinent position in the R&D panorama occurred later than that of economic resources and was the result of the credit gained by the model proposed by H. Brooks on science planning and priority setting. This model viewed research not only as a technical overhead but also as a social overhead investment in which research and education, in broad terms, are inseparable activities and must be intertwined.
Since this incorporation, the measurement of human skills in connection to R&D has not been an easy task. Seminal to this issue was the Frascati manual as a highly valuable sample of OECD care, interest, and effort for standardization of R&D data. However, it seems obvious that in spite of the recognized merit of Frascati, it offers, today, limitations because of the increasing complexity of the relationship between science, technology, economy, and society. The manual cannot be taken as a made-to-measure suit for any model other than science-technology systems.
The situation has already been recognized by the main international organizations (UNESCO, OECD,
TABLE 3 Total Expenditure in R&D Public Sector and Undertakings by Main Regions in Italy, 1987
|
Region |
Expenditure (millions of lire) |
Percentage |
|
Southern Italy |
6,238,983 |
66.84 |
|
Central Italy |
2,383,665 |
25.54 |
|
Northern Italy |
711,285 |
7.62 |
|
TOTAL |
9,333,933 |
100.00 |
|
SOURCE: Original ISTAT, 1990, taken from Science and Technology in a Marginal Area: The Case of the Italian Mezzogiorno, R. Zobbi, December 1991. |
||
TABLE 4 Regional Distribution of Total Expenditure in R&D, Public Sector and Undertakings in Italy, 1987
|
Regions |
Absolute Expenditure |
Percentage |
|
Northern Italy |
6,238,983 |
66.84 |
|
Piemonta |
2,002,535 |
21.45 |
|
Valla d'Aosta |
6,821 |
0.07 |
|
Lombardia |
2,635,464 |
28.24 |
|
Trentino A.A. |
35,087 |
0.38 |
|
Veneto |
346,435 |
3.71 |
|
Friuli V.G. |
139,142 |
1.49 |
|
Liguria |
463,581 |
4.97 |
|
Emilia Rom. |
609,918 |
6.53 |
|
- IT. Nort/occ. |
5,108,401 |
54.73 |
|
- Nort/or. |
1,130,582 |
12.11 |
|
Central Italy |
2,383,665 |
25.54 |
|
Toscana |
431,354 |
4.62 |
|
Umbria |
24,312 |
0.26 |
|
Marche |
38,721 |
0.41 |
|
Lazio |
1,889,278 |
20.24 |
|
Southern Italy |
711,285 |
7.62 |
|
Abruzzi |
63,252 |
0.68 |
|
Molise |
512 |
0.01 |
|
Campania |
347,229 |
3.72 |
|
Puglia |
89,789 |
0.96 |
|
Basilicata |
37,926 |
0.41 |
|
Calabria |
17,602 |
0.19 |
|
Sicilia |
1,151,625 |
1.23 |
|
Sardegna |
39,813 |
0.43 |
|
TOTAL |
9,333,933 |
100.00 |
|
SOURCE: Original ISTAT, 1990, taken from Science and Technology in a Marginal Area: The Case of the Italian Mezzogiorno, R. Zobbi, December 1991. |
||
and the ECC) involved in the measurement and understanding of trends in R&D. This has led to the lively debate that is currently taking place. Some of the issues that have sprung up are as follows:
-
It is deemed necessary to discuss science and technology in a broader concept than that of R&D in current literature.
-
It is admissible to talk about human resources in science and technology instead of R&D personnel.
-
It is recognized that the debate should delve into the activities related to science and technology, enlarging the focus from those related to science and technology production to others indispensable for a science and technology policy based on dissemination.
-
Against the Anglo-American view, the humanities are kept within the frame of activities and disciplines involved in science and technology.
-
The difficulties in making adequate comparison between professional skills, both by qualification and occupation, must not exclude accountants and technicians, whose jobs are fundamental to rational and well-structured development of science and technology goals and projects.
-
In any case, the approach looking for a better link between R&D and education may take into account 5, 6, and 7 ISCED levels, as well as consider the distinction of doctoral studies as an independent level.
-
The idea of counting personnel as total numbers, as heads, without relying exclusively on counts of full-time equivalents is gaining intensity.
-
In a similar context it is considered appropriate to combine the measure of the number of people available (stock) with the concept of mobility, or flows, of personnel.
-
The human resources involved in science and technology have to be considered both as inputs and outputs to the system.
-
There is an evident conflict between the classifications concerned with skilled personnel by both qualification (education) and occupation. The next generation will see the continuing debate about this matter, focusing on the count of students (graduate, doctorate, and postdoc).
All these topics appear highly relevant to the present study, and their concerns and problems influence it.
Data on Human Resources in Less Favored Regions of EC-12
The data currently available confirm the trends outlined before: (1) an absence of homogeneity in the information, and (2) the emergence of apparent disparities between countries and regions (see Tables 5-7). As can be seen, the information up till now contains data, although not complete, on stocks but not on flows. In neither is there too much detail in a breakdown by academic skills or degrees.
In order to correct the situation, we have prepared a survey/questionnaire addressed to heads of academic units, heads of R&D units, and personnel of companies that belong to EC Objective 1 Regions. This survey is now under way. As an illustration of its purpose, we include the introduction of the questionnaire:
The aim of this questionnaire is to obtain firsthand, updated information about human resources devoted to scientific or technological research in institutional facilities located in the less favored regions of the EC. It is expected that the data retrieved by these means can be helpful in designing EC science and technology policies more appropriate to the needs of these regions. Data on personnel mobility are particularly appreciated due to the importance attached to this information as indicator of a research unit situation and as a probable area of political and financial action. For the sake of this study we define mobility as any variation in the number and/or composition of the human resources of a research unit. Most careful attention and accuracy in the fulfillment of this questionnaire is earnestly requested. Thank you for your kind cooperation.
TABLE 5 Summary of the Collected Information about Personnel from R&D Activities in the Less Favored Countries of EC-12
|
 |
|
SOURCE: Copol 1990, Tendances de la recherche scientifique et du developpement technolgique dans la CEE; Trends Research and Technological Development in the ECC (Rapport/Report EUR 13795, FR/EN); Greece, Copol 88, Report EUR 11983 EN; Portugal, Copol 91, Rapport EUR 14343 FR; Italy, Copol 90, Report EUR 13313 EN Ireland, Copol 88, Rapport EUR 11980 FR; Spain, Copol, Report prepared by Mr. J. Elorrieta Jove, EN. |
TABLE 7 Summary of the Situation of Personnel Devoted to R&D in the Countries with the Less Favored Regions of Europe (EC-12)
|
COUNTRY |
RESEARCHERS |
TECHNICIANS |
OTHERS |
TOTAL |
|||||
|
|
Number % |
Number % |
Number % |
|
|||||
|
ITALY |
Total |
67,844. |
100.0 |
32,892. |
100.0 |
21,616. |
100.0 |
122,353. |
|
|
Public Sector |
35,279.1 |
52.0 |
12,006.2 |
36.5 |
8,798.2 |
40.7 |
56,083.2 |
(64,6372) |
|
|
Enterprises |
32,565.1 |
48.0 |
20,886.2 |
63.5 |
12,818.2 |
59.3 |
66,269.2 |
(57,7152) |
|
|
PORTUGAL |
Total |
5,003.6 |
100.0 |
3,571.5 |
100.0 |
2,308.3 |
100.0 |
10,883.4 |
|
|
Public Sector |
4,237.7 |
84.7 |
2,385. |
66.8 |
1,673.9 |
72.5 |
8,296.6 |
||
|
Enterprises (+ NPO) |
765.9 |
15.3 |
1,186.5 |
33.2 |
634.4 |
27.5 |
2,586.8 |
||
|
GREECE (1983-87) |
Total |
4,000. |
100.0 |
1,572. |
100.0 |
1,908. |
100.0 |
7,480. |
|
|
Public Sector |
3,162. |
79.1 |
1,278. |
81.3 |
1,535. |
80.5 |
5,975. |
||
|
Enterprises |
838. |
20.9 |
294.2 |
18.7 |
373.2 |
19.5 |
1,505. |
||
|
IRELAND (1984) |
Total |
3,626. |
|
1,336. |
|
1,231. |
|
6,193. |
|
|
SPAIN (1988) |
Total |
59,592 |
100.0 |
|
|||||
|
Public Sector |
48,623 |
81.6 |
|||||||
|
Enterprises |
10,069 |
18.4 |
|||||||
|
Footnotes: 1 Estimated from breakdown by type of research. 2 It appears as such in breakdown by sector of activity. SOURCE: Copol 1990, Tendances de la recherche scientifique et du developpement technolgique dans la CEE; Trends in Scientific Research and Technological Development in the ECC (Rapport/Report EUR 13795, FR/EN); Greece, Copol 88, Report EUR 11983 EN; Portugal, Copol 91, Rapport EUR 14343 FR; Italy, Copol 90, Report EUR 13313 EN; Ireland, Copol 88, Rapport EUR 11980 FR; Spain, Copol, Report prepared by Mr. J. Elorrieta Jove, EN. |
|||||||||
This questionnaire is divided into five short sections. The first one is thought to reveal the composition and characteristics of all the personnel making up the human resources of scientists, technologists, technicians, and other researchers (fellows, grant holders, etc.) working in the research unit under survey. Gender, age, position, activity, and level of training features of the researchers are requested.
The second section of this questionnaire is aimed to provide an image of the mobility resulting in the present composition of the human resources of the research unit in this survey. Geographical and educational features are requested in order to single out those people proceeding from non-Objective 1 Regions, and then data on gender, age, position, activity, cognitive area, and level of training are asked for these people.
The third section of this questionnaire points to the mobility of scientists (commonly people who graduated from Science Schools doing R&D; what the Frascati manual calls ''researchers"), technologists (commonly people who graduated from engineering schools and who deal with technical activities of R&D or tasks of adaptation, diffusion, troubleshooting, quality control, routine tests, etc.), technicians and equivalent staff, and other researchers (fellows, grant holders, etc.) during 1992. Temporal, geographical, organizational, and motivational features of the researchers undergoing mobility are requested.
The fourth section of this questionnaire asks for a few characteristics of the research unit under survey. Specific questions are asked on area of
activity, sources of support, and the allocation of financial and human resources.
Finally, for technical reasons—and always respecting the confidentiality of respondents—we need some identification data. (VERY IMPORTANT NOTICE: Less favored regions are named Objective 1 Regions in the terminology of the EC. This survey is addressed to research units in this kind of region. Although there are a few others within the EC, the Objective 1 Regions considered in this survey are the following: Greece, Ireland, and Portugal as whole countries; Abruzzi, Basilicata, Calabria, Campania, Molise, Puglia, Sardegna, and Sicilia within Italy; and Andalucia, Asturias, Islas Canarias, CastillaLeón, Castilla-La Marcha, Comunidad Valenciana, Extremadura, Galicia, and Murcia within Spain. It is crucial to take into account these classifications in order to answer correctly the following questions on geographical mobility of the researchers!)
SOME CONCLUSIONS AND RECOMMENDATIONS FROM THIS ANALYSIS
-
The study of human capital in science and technology needs more work from the statistical approach. All initiatives that are being undertaken by different organizations are welcome, although they are likely to require a serious discussion from a multidisciplinary point of view. Mobility is for instance fundamental to understanding the problems of less favored regions.
-
The educational programs related to development of skills for science and technology must be discussed with the social agents. A partnership between owners, trade unions, and public administrators appears to be essential to establish the great lines of training needs.
-
In order to foster the development of less favored regions through science and technology, an appropriate selection of priorities is fundamental. For this selection it is necessary to take into account the inner characteristics (its strengths and weaknesses) of every region. Adoption or mimicking of too general priorities is most likely hopeless.
-
It is fundamental to favor the creation of an adequate infrastructure to permit the incorporation of skilled personnel. An appropriate general environment may encourage this trend.
-
It is perhaps time for a plea for more creativity and flexibility of policies concerning human resources for science and technology. Since heterogeneity appears as the main characteristic, specific measures and programs should be applied.
SOME PRELIMINARY CONCLUSIONS AND COMMENTS FROM THE INQUIRY CARRIED OUT BY OUR GROUP
The response from the 3,000 units surveyed by mail has been reasonably good (about 30 percent), taking into account the mailing characteristics of the survey, the complexity of the questionnaire, and the limitations of mail services in these EC 1 Objective Regions.
The complete information from the survey will be communicated to the EC Directorate General XII from which we are contractors.
Nevertheless, a few conclusions and comments can be drawn at this stage:
-
The information gathered confirms the difficulties in obtaining relevant data concerning human resources in science and technology. This general conclusion has to be stressed in view of the considerable extent of disaggregation concerning survey units reached by us. One has to wonder about the significance of data obtained from survey units with a greater degree of aggregation.
-
One reason for this difficulty concerns the breakdown by qualification. This owes first to the evident heterogeneity existing among countries with regard to degrees and length requirements for their attainment. Second, it seems difficult to reconcile the extent and variety of educational degrees and diplomas with the ISCED levels (for instance, levels 5, 6, and 7, and the absence of a doctoral level). An effort for homogenization, at least in terms of equivalence analysis, seems indispensable and must be rewarding.
-
Another side of the problem derives from the lack of information on human resource issues among R&D managers of whether they belong to academic institutions or undertakings. A specific action on the formation of these questions may be worthwhile.
-
A third problem comes from the attempt to match the restricted R&D activities and their statistical data following the Frascati manual with those more broadly comprised under the heading science and technology.
-
We have noticed that among academic or scientific institutions from Greece, Italy, Ireland, and Portugal there is a marked heterogeneity in the doctoral distribution from none to a reasonable level. However, there also seems to exist a potential for doctoral training inside the regions or even for attracting foreign doctors to them. This is a puzzling situation since I consider doctoral training as part of a learning by doing teaching process, a first and necessary step to improve the scientific environment in the less favored regions. Moreover, the procurement of a doctoral degree in the same region from each individual seems to me—paradoxical it may seem—a better onset for scientific careers until there is sufficient development of the discipline in that region. A better likeness to reality can follow from this path.
-
The situation is not the same in Spain, probably as a result of the administrative requirement of a doctor's degree to pursue an academic career.
NOTES
The Longitudinal Analysis of the Selection of Careers in Science and Technology
Jon Miller
In this commentary, I want to discuss the rationale for longitudinal measurement in the study of career choice, review the strengths and weaknesses of the papers by Dr. Xie and Dr. Muñoz, and suggest some approaches to further research that improve our understanding of the career selection process. Having worked for several years in the conceptualization and implementation of a major longitudinal study in the United States, I am pleased that a panel focused on longitudinal studies was included in this international conference. The increasing number of longitudinal studies and the focus of serious academic and policy discussions on these studies marks a growing recognition of the value of this kind of work, and I am pleased to be a part of this process.
THE IMPORTANCE OF LONGITUDINAL MEASUREMENT
It may be useful to begin with a brief discussion of the importance of longitudinal studies in thinking about the selection of careers throughout the life cycle and in testing our hypotheses and assessing the impact of our efforts to impact this process. I believe that the growing number of good longitudinal studies has had a beneficial impact on the ways that we think about the selection and achievement of careers and may even have enriched our theories about these processes.
When investigators had available only cross-sectional time series measurements, the picture of the career selection process was viewed as more linear, incremental, and rational. And many of the models were consistent with the time series data, showing, for example, a steady decline in student plans for a career in science and technology during the high school and college years. This observation may be applied to social science more generally, but it was undoubtedly true in regard to models of career choice.
With the access to longitudinal data sets that included career choice information, it has become apparent that the process is much less stable and far more dynamic than many of the more linear and static models would have predicted. The fundamental point is that studies of career choice are studies of human behavior. We are interested in changes in the plans, expectations, skills, and behaviors of individuals, and the data from good longitudinal studies provide the level and kind of measurement that supports the development and testing of models of human choice and change.
XIE: A DEMOGRAPHIC MODEL
The Xie paper offers a demographic model of movement into and out of the science and technology career stream, using a modified Markov chain approach. The introduction of a demographic model makes the paper useful at the conceptual and heuristic levels. A series of misspecifications of central variables, the disjuncture of measurement concepts across longitudinal segments, and a 20-year gap in the two databases combine to erode the substantive value of the conclusions. Let me discuss each of these points in greater detail.
Xie's discussion of the movement of individuals into and out of the science and technology career stream is useful. It emphasizes the dynamic nature of the process and points to one important use of longitudinal studies. Conceptually, the ability to look at the transition probabilities across time and at different levels (and types) of schooling would be a useful
macro-level tool to understand and monitor the pipeline of scientific and technical personnel. This kind of macro analysis should complement micro-level analyses of family, school, peer, media, and market influences on career choice, not replace it. As we know from economic analysis, macro-level theories built on inaccurate assumptions about micro-level behaviors seldom work.
Unfortunately, the elegance of the conceptual model is not paralleled in the empirical specification of the model. There are several serious problems.
First, Xie is vague about the definition of scientific and technical occupations. Since the analysis is limited to those students planning to enroll at the university level, it would appear that all sub-baccalaureate technical occupations are excluded. It is not clear, however, whether the health professions are included or excluded from the analysis, and that determination will have a significant impact on the subsequent analysis of gender differences in the selection of scientific and technical careers. Xie provides a footnote saying that the social sciences are excluded and offers to provide occupational codes upon request, but this is information that is essential to the reader in seeking to assess the proposed model.
Second, for the 7th through 12th grade segment of the longitudinal chain, Xie defines all students who "strongly agree" with the statement that they enjoy science as "belonging to the state of intended science/engineering postsecondary education." While it is reasonable to expect that most students who are thinking about a scientific or technical career would say that they enjoy science, it is very likely that a significant proportion of the students who strongly agreed with this statement have clear career intentions in fields other than science and technology. Some students report that they enjoy or like virtually all of the subjects that they study, while others tend to be more reserved and give all, or most, subjects a more moderate rating, including those related to possible career preferences.
The definition used for the student population, however, should bear some relationship to the definition used for the college population and to the definition of the final occupational set. For example, if medicine, nursing, and other health professions are included in the definition of a science/engineering occupation, then it would be reasonable to use a somewhat broader definition. If, on the other hand, the final definition is the National Science Foundation's classification of graduate-educated scientists and baccalaureate-educated engineers, then a broad definition at the middle and high school levels would lead to the false conclusion that large numbers of students who always intended to be physicians had left the pipeline, when, in fact, they had never been in it. Given the large number of more specific and career related questions included in the Longitudinal Study of American Youth (LSAY) database, Xie could have operationalized this variable in a more precise and relevant manner.
Third, a similar problem occurs with the definition used by Xie for the college years. Xie identifies a set of college majors as representing a career interest in science and engineering. While this is clearly a more precise definition than was used in the pre-university years, it is equally vague as to boundaries and content. If the health professions are included, then majors may be a reasonable approximation. If the health professions are excluded, then we would again interpret all of the premedical majors in biology or chemistry as being in the science and engineering pipeline and subsequently dropping out of that pipeline, which would be an erroneous conclusion. Given Xie's later effort to make generalizations about gender differences, the issue of the inclusion or exclusion of the health professions is a central problem since, in the United States at least, a slight majority of high school students planning to enter medicine are female.
Fourth, in an effort to develop a synthetic cohort over a longer time span, Xie combined the precollege data from the LSAY and the college and postcollege data from the National Longitudinal Study of 1972. This linking might work in areas that have been relatively stable over the last two decades, but it does not work for the purposes of Xie's analysis. In the area of gender differences in course enrollment and career preferences, there have been major changes over the 19-year period between the two studies. For example, had Xie looked at student use of computers in this synthetic cohort, the results would have shown a major drop-off between the ages of 17 and 19. We know from numerous other studies that this would be a wrong conclusion, but the rate of computer usage was significantly lower in the early 1970s and the merger of these two data sets on substantive areas that are undergoing rapid change is inappropriate. During these two decades, the proportion of high school and college women who have been taking advanced courses in science and mathematics has increased significantly, as has the number of young women planning careers in
science, mathematics, medicine, and engineering.
Finally, these problems of definition, specification, and time breaks combine to raise serious doubts about the substance of Xie's conclusions. Xie claims that the major loss of young women from the science and engineering pipeline occurs between the ages of 17 and 19, but the observation that a very similar drop occurs for males leads one to suspect that the real factor may be the change in definition from the enjoyment of science to enrollment in a specified set of college disciplines. It is very likely that some part of the observed drop (by any definition) is the result of comparing a high school cohort from the late 1980s with a college cohort from the early 1970s, disregarding two decades of growing feminist awareness and increasing rates of female participation in advanced science and mathematics courses.
MUÑOZ: HUMAN RESOURCES IN LESS DEVELOPED REGIONS OF EUROPE
The Muñoz paper addresses both the conceptual problem of the linkage between human resources and job availability and the problem of insufficient data to fully understand the processes. It is useful to think of these two issues separately.
Muñoz documents that the less developed regions of Europe have fewer persons trained in science and technology (by almost any definition) and that the science and engineering pipeline is smaller in these regions than in the more developed regions of Europe. He observed lower rates of public spending for education and lower numbers of students seeking higher level education and training in science and technology related occupations. There are similar regional disparities in the United States and in most industrial nations.
Muñoz also observes similar patterns in regard to public investment in research and development(R&D) and in the level of employment in occupations and institutions related to scientific research and technical development. Again, this pattern would be found in the United States and most industrialized countries. In recognition of this pattern in the United States, the National Science Foundation has created a special grant program to provide support for scientific work in selected states where universities and other research centers have not been able to compete successfully against similar institutions in other states.
The issue is the linkage between these two sets of observations and the implications for public policy. Historically, some economists and development specialists would argue that once there are jobs and opportunities available in a region, the labor market will adjust and more young people will begin to prepare for these jobs, seeking the kinds of training needed. This is a demand driven model. While it clearly works for some kinds of economic development, it is not clear that it will work equally well for scientific and technical development. Given the long period of training needed for many higher level scientific and engineering positions, it is more likely that skilled personnel from other regions will be drawn to new job opportunities in less developed regions, unless there is a general shortage of skilled personnel in all regions. Over a longer period of time, new generations of young people growing up in an area with available positions in science and engineering will begin to think about those opportunities, but the short-term change may be relatively small, especially at the professional level.
An alternative view has been that an increased supply of available skilled personnel in a region will make that region more attractive to potential employers, who may then elect to locate a new research or development facility in that region. In a market with a rapidly increasing R&D sector and a general shortage of skilled personnel, this model may work effectively, but those conditions are rarely met.
Muñoz, as many before him, struggles with the linkage between the supply of human resources and the level of economic activity in R&D. He recognizes that there is a linkage, but he does not suggest a causal order. I suspect the linkage is circular, with increasing job availability and increasing numbers of young people seeking careers in science and technology mutually reinforcing each other. It is clearly a dynamic model.
In his search for some structure to this problem, Muñoz finds a dearth of data that is both directly relevant and sufficiently precise. He notes the differences in definition of scientific and technical jobs and the difficulties of making valid comparisons among non-identical data sets. The work of the European Community in seeking more standardized data has produced some marked improvements to date, but, undoubtedly, more needs to be done. In addition, there are important kinds of data (like the longitudinal studies used by Xie) that are not being collected in the European Community at the present time.
THE IMPACT OF THE END OF THE COLD WAR
The end of the Cold War will have an important impact on all of our models of the demand for and supply of scientific and technical personnel, and it is important to recognize this potential impact. In both the United States and the European Community, but especially in the U.S., a significant portion of scientific and technical personnel have been engaged in defense-related R&D. Given the relative stability of this sector of the R&D enterprise over the last four decades, we have been able to develop pipeline models of human resource preparation with some degree of certainty about the relative size of the demand for new graduates.
With the end of the Cold War, all of the western governments are moving substantial amounts of resources from military-focused spending to civilian-focused spending. In the United States, the Clinton administration has announced a major effort to convert many of these defense industries into nonmilitary production of consumer goods and environmental protection processes and goods. It is far too early to guess at the likely success of this conversion, but it is equally clear that we do not know what level of civilian R&D will be supported by our economies as presently structured.
Consider two possibilities. Assume that the movement of defense-related scientific and technical personnel into the civilian sector will take a decade to achieve, or that it will be a decade before we can determine the longer-term level of resources that western governments will continue to devote to military purposes. In the meantime, the personnel and facilities that are converted from defense to civilian purposes meet, or largely meet, the growth in R&D personnel needs of the civilian sector. The opportunities for new graduates would diminish and the pipeline flow would drop in rough proportion to the availability of positions. In this model, the demand for scientists and engineers would drop and the incentives to relocate to presently less developed regions would be greatly reduced.
The most optimistic model is that the flow of talent from military to civilian objectives will stimulate a new surge of innovation, creating new products, new industries, and new jobs. Surely we would all hope for this model, but realistically, it is more difficult to imagine. If, as a recent television show suggested, this new technology should lead to the development of electric automobiles that would cause less harm to the environment, there might be an increase in the design, manufacture, and repair of electric automobiles, but would there not be some decline in the level of economic activity associated with gasoline-powered automobiles? And what if electric automobiles turned out to require less time to manufacture or less frequent repairs? Overall, I would expect that there may be a net gain in economic activity in the civilian sector, but I would expect that it will take at least a few years to fully offset the decline in military-related economic activity. We stand at a very interesting point in time, and we should not assume that our previous models of supply and demand for scientific and technical personnel will continue to work in future decades without some major re-thinking.
WHAT DO WE NEED TO KNOW ABOUT THE PROCESS?
I understand the purpose of this international conference to be a reporting and sharing of current research in regard to scientific and technical careers and the identification of future directions for this research. Let me conclude, therefore, with some brief observations about some substantive issues that require a new or substantially increased level of research attention.
First, I want to stress the importance of longitudinal measurement in the study of the career choice and attainment process. It is a dynamic process, and we need to build theories and models that reflect the vitality of the process. After more than two decades of working with both cross-sectional and longitudinal data sets, I am firmly convinced that we must have more and better longitudinal data sets if we wish to make substantial improvements in our understanding of these processes.
In the United States we have initiated a number of important national longitudinal studies, but there are still important misunderstandings about the nature of and need for these studies. Some policy leaders and agency personnel seem to think that one national longitudinal study every eight years is sufficient to answer every possible question about the educational process. Virtually none of these people has ever attempted to analyze a longitudinal data set or has ever worked to combat respondent fatigue over the years and sustain cooperation. The LSAY, which I conceptualized and of which I am the director,
represents a new and important example of a kind of longitudinal study that needs to be replicated in other subject realms and in other countries.
In contrast with the National Longitudinal Study of 1972, the High School and Beyond Study, and the National Elementary Longitudinal Study of 1988, the LSAY focused on the development of student interest and achievement in a limited subject range—science and mathematics—and attempted to measure a wide range of factors that affected those outcomes. We tested each student in science and mathematics each year, collected student assessments of courses and reports of school activities each semester, interviewed one parent of each student once each year by telephone to learn more about the home environment and to obtain parental estimates of student time use and activities, collected reports from each science and mathematics teacher that served an LSAY student about the content of the course, and obtained school level reports from the principal of each school periodically. In the first 6 years, we collected over 6,000 items of information on each of about 7,000 students. It has been an intensive look, but it is the way that systemic measurement must be done if we are to develop a broader and more systemic understanding of how young people learn about science, mathematics, and technology.
In the future, we need to initiate new cohorts in the study of science and mathematics, and the government should support similar studies focused on how students acquire humanistic and social understanding, reading and language abilities, and political and social values. And it is essential that parallel longitudinal studies be developed in several countries at the same time, using common metrics. Unfortunately, even the best single national longitudinal study cannot measure some system level variables because most nations have a relatively common educational system. It is only when there are parallel longitudinal studies like the LSAY that we will be able to build models of student behavior that take into account both the family and school characteristics of each student and the systemic variables within which these other factors operate.
Longitudinal studies are expensive. It is the nature of the study, and it is unlikely to change. Pencils are less expensive than computers, and we still need some of them, but few people would seriously propose to substitute more pencils for computers for most purposes. Yet funding agencies in virtually every country still prefer to support a lot of smaller studies than a few larger ones. Perhaps the responsibility falls to those of us in the field to demonstrate the value of longitudinal data and to educate our students, who may become the next generation of agency administrators, about the need for longitudinal measurement.
Second, it is important to monitor the flow of young people into and out of the scientific and technical career stream. The work of Xie points to a direction that we need to pursue. While there will also be some flow into and out of this stream (and we should encourage students to change their minds if they are not happy with an earlier choice), we need to be able to identify the points in the stream where there are significant numbers of students exiting and to study the reasons why. Recently, Sheila Tobias has focused considerable attention on the impact of introductory college level science courses on the attitudes of students about science as a field of study and as a possible career. The kind of macro-level model proposed by Xie, with appropriate definitions and data, could be most useful in assessing points or difficulties that need further examination. A comparison of demographic, or flow, models in different countries or different regions—along the lines suggested by Muñoz—may be helpful in understanding more about the dynamics of economic development.
Finally, given the increasing length of life for many individuals, we need to think about new models that incorporate mid-life changes in career choice. While there has been some very useful discussion of mid-life changes in the educational and sociological literatures, there have been few databases suitable for use in testing major hypotheses or in constructing models of these behaviors. Again, and for all of the same reasons, we will need longitudinal measures of adults to be able to understand voluntary and forced modifications in career paths.
It is a large agenda and it will take resources, but it would be less expensive than devoting millions of dollars to job programs or economic development programs without an understanding of how those processes work. Neither governments nor economies will stand still while we study these issues, but we must seek to use our existing knowledge and our understanding of what we need to know to become more a part of the policy thinking processes.


