
Chapter 9
Using Student Assessments for Educational Accountability 1
DANIEL KORETZ
RAND Institute on Education and Training
A common thread runs through many recent proposals for the reform of American education: the notion of using students' performance on achievement tests—or assessments, as it is now more fashionable to say—as a basis for holding educators, schools, and school systems accountable. Indeed, in many reforms, test-based accountability is viewed as the principal tool for improving educational practice.
The proposal of the Panel on the Economics of Education Reform (PEER) (Hanushek et al., 1994) is one example of a reform approach that would rely heavily on holding educators accountable for improving students' performance, although it differs in some ways from many current assessment-based accountability systems. The PEER proposal focuses on three elements: the efficient use of resources, performance incentives for educators based on assessments of student performance, and continuous adaptation. The proposal suggests the need for new types of student assessments, although it does not clearly specify their form and cautions against too radical a departure from current assessment practice. For example, the proposal recognizes the importance of standardization, noting that "flexible measurement quickly degenerates into a collection of semi-independent observations that cannot be compared" (Hanushek et al., 1994); and it argues that it would be a mistake to discard existing standardized tests "without an operationally useful alternative." Unlike many others, however, the PEER
proposal asserts that effective management requires that a system take into account the many sources of educational performance, some of which are not the responsibility of the school, and maintains that schools should therefore be held accountable only for value-added.
To evaluate proposals of this sort and to decide how best to translate them into practice, it is essential to examine both the logic of achievement testing and the evidence pertaining to assessment-based accountability. At first, the logic seems simple and compelling: student achievement is the primary goal of education, and holding educators accountable for the amount of learning they induce can only focus and intensify their efforts. In practice, however, assessment-based accountability poses serious difficulties.
Despite the long history of assessment-based accountability, hard evidence about its effects is surprisingly sparse, and the little evidence that is available is not encouraging. There is evidence that effects are diverse, vary from one type of testing program to another, and may be both positive and negative. The large positive effects assumed by advocates, however, are often not substantiated by hard evidence, and closer scrutiny has shown that test-based accountability can generate spurious gains—thus creating illusory accountability and distorting program effectiveness—and degrade instruction. One source of these problems is limitations of tests themselves, and a primary emphasis in the current reform movement is on the development of innovative, less limited assessments. A second source is the structure of the data in which test scores are typically embedded; assessment databases are rarely of a form that would permit accurate measurement of value-added or of program effectiveness. A third source is behavioral responses to accountability: holding educators accountable for students' test scores can create undesirable practices that inflate scores and may undermine learning.
This chapter sketches the recent history of assessment-based accountability and then describes some of the most important problems it entails. The final sections address the potential of innovations in testing and suggest some implications for policy. I do not wish to discourage the use of tests in accountability systems but rather want to encourage reformers to use tests in ways that take their problems into account and that are therefore more likely to improve student learning.
The Transformed Role of Testing
Between World War II and the 1960s, achievement testing in the United States was "low stakes," without serious consequences for most students or teachers. Some tests did have serious consequences—for example, college admissions tests and tests used to place students in special education—but they were the exception rather than the rule (Goslin, 1963, 1967; Goslin et al., 1965).
The functions of testing began to change in the 1960s. The Elementary and
Secondary Education Act enacted in 1965 mandated achievement testing as a primary mechanism for monitoring and evaluating the new federal compensatory education program, Title I. Because Title I services are provided in the great majority of elementary schools, this requirement had a major influence on testing throughout the K-12 education system (Airasian, 1987; Roeber, 1988). Another important step in the transformation of testing was the establishment of the National Assessment of Educational Progress (NAEP) in the late 1960s as an ongoing program of testing to monitor achievement of our nation's youth.
Another stage in the evolution of testing was the minimum competency testing (MCT) movement in the 1970s (Jaeger, 1982). MCT programs were intended to not only measure performance but also spur its improvement through the mechanism of high stakes for students. Indeed, some of its proponents called MCT "measurement-driven instruction" (e.g., Popham et al., 1985). MCT programs relied on criterion-referenced rather than norm-referenced tests. That is, they used tests that were designed to determine whether students had reached a predetermined standard of achievement rather than to place students' performance on a distribution of performance, such as a national distribution for students in a given grade. As the term "minimum competency" suggests, the standards were low, designed only to identify students who failed to reach a standard judged to be minimally acceptable. In many states MCTs were used as an "exit exam" for high school graduation. A smaller number of states used MCTs to set ''promotional gates," governing promotion between certain grades (Jaeger, 1982).
In the 1980s test-based accountability received another boost with the "reform movement" that followed the publication of A Nation at Risk (National Commission on Excellence in Education, 1983). The reforms of the 1980s varied from state to state, but one of the most common elements was greater reliance on testing as a policy tool. Pipho (1985) noted that "nearly every large education reform effort of the past few years has either mandated a new form of testing or expanded [the] uses of existing testing." Ambach (1987) asserted that the nation had entered a period of not only measurement-driven instruction but also "measurement-driven educational policy." Much of the new testing had high stakes, but the nature of the consequences began to change, shifting from stakes for students toward evaluations of educators or systems (Koretz, 1992).
The testing of the 1980s reform movement fell into disfavor surprisingly soon. Confidence in the reforms was so high at the outset that few programs were evaluated realistically. By the end of the decade, however, confidence in the reforms was supplanted by widespread suspicion that they had often degraded instruction and inflated test scores by inappropriate teaching to the test. Some of the evidence relevant to those negative conclusions is described below.
Despite increasing skepticism about the effects of the programs of the 1980s, few reformers questioned the basic premise that test-based accountability could be the primary impetus for better education. Rather, a growing number of reformers called for a "second wave" of programs that would continue heavy
reliance on test-based accountability while changing the types of tests used. They reasoned that if tests could be designed so that they would be "worth teaching to," so that coaching for the tests would constitute good instruction, the negative effects of the test-based accountability of the 1980s could be avoided. In addition, many reformers called for linking test-based accountability to other reforms, such as improved teacher training and changes in school governance. The role of assessment, however, often remained primary. For example, the National Council on Education Standards and Testing (1992) asserted that "standards and assessments linked to the standards can become the cornerstone of the fundamental, systemic reform necessary to improve schools" (p. 5).
Advocates of this "second wave" call for replacing the conventional, multiple-choice, standardized tests of the 1980s with diverse "performance assessments." Performance assessment is a broad and poorly defined concept that includes, for example, both paper-and-pencil tests such as direct writing tests and hands-on manipulative assessments such as hands-on science experiments. It also includes both standardized, on-demand assessments and largely unstandardized assessments embedded in ongoing instruction, such as portfolio programs.2
The "second wave" remains a dominant force in the American school reform movement today. A number of large-scale development efforts are under way, such as the New Standards Project, and several states, such as Vermont, Kentucky, and Maryland, have been working on assessment-based reforms for several years. Evidence of the effects of these new reforms is becoming available only slowly. So far it does not appear, however, that substituting performance assessment for multiple-choice testing will be sufficient to eliminate many of the fundamental problems of test-based accountability.
What Tests Are
For present purposes, the single most important fact about achievement tests is that most are small samples from large domains of achievement. Performance
on the test itself, therefore, often is or at least ought to be of little interest. Rather, what is important is students' mastery of the domain that the test is intended to represent. Thus, the results of most achievement tests are meaningful only if one can legitimately generalize from performance on the sample included on the test to mastery of the domain it is intended to represent.3
One reason that tests are generally small samples is that many domains of interest are simply too large to test fully. For example, although most people have working vocabularies of thousands of words, it is neither practical nor necessary to include thousands of words in a vocabulary test. A test comprising perhaps forty words can do a reasonably good job of differentiating people with strong vocabularies from those with weaker vocabularies, provided that the words included on the test are chosen carefully and the test is not used in ways that undermine its meaningfulness. In most cases, however, no one really cares about students' mastery of the few words included in a vocabulary test; rather, they are concerned about students' mastery of the broader domain that those words represent.
The degree of sampling needed to build a test therefore depends on the breadth of the inferences that it is used to support. In policy contexts the domains of achievement about which people want to draw test-based inferences are typically broad, often broader than the domains of some tests used for other purposes. For example, a relatively narrow state or district mathematics test might cover a year's work in a subject such as algebra. The traditional New York State Regents tests and the College Board Advanced Placement tests are examples. At the other extreme, many current assessments, such as NAEP and many statewide assessments, are intended to support inferences about far broader domains, such as the cumulative mastery of mathematics by eighth-grade students. Truly narrow domains that might be tested more fully, such as "using the distributive law to simplify simple algebraic expressions," are the focus of pop quizzes, not of the assessments debated by the press and policymakers. Indeed, a domain such as "using the distributive law to simplify simple algebraic expressions" is too narrow even to warrant guaranteed representation in many large-scale assessments of mathematics.
The extent to which tests are incomplete samples of domains also hinges on other factors beyond the size and complexity of many domains of interest. For example, tests may exclude important attributes that are impractical to measure, and they may either exclude or underrepresent attributes that can be measured only at a very large cost in money or testing time. For purposes of the following discussion, however, these additional factors are important but not essential. The critical fact is simply that tests are typically small samples of domains.
It is also essential to recognize that the domains that current assessments are designed to test are themselves only a subset of the desired outcomes of schooling. Often, the argument that measured achievement is only one of the goals of schooling is interpreted as avoidance of hard-nosed accountability, and it may often be. Nonetheless, an accountability system that fails to address outcomes beyond those typically tested is likely to be insufficient. Much of what many individuals need to learn will arise after they leave public schools—in later education, in the workplace, and in civic life. The extent to which they are successful in this later learning may depend in substantial part on the body of knowledge and skills that students have at graduation, much of which can be tested. But it is also likely to depend on attitudes and habits that are not typically measured by achievement tests—an attitude that mathematical problems are interesting and tractable, for example, or an interest in and willingness to weigh carefully conflicting evidence and competing positions underlying political arguments. Thus, an accountability system that produces high scores on tests at the price of poor performance on unmeasured outcomes may be a poor bargain (Haney and Raczek, 1994).
Typical Test Databases
To understand the uses and limits of test data it is also imperative to consider the types of databases in which assessment data are typically embedded. Three attributes of these databases are particularly important.
First, large-scale assessment data are usually cross-sectional. Some districts and states can track the progress of students who remain in the jurisdiction longitudinally (see, e.g., Clotfelter and Ladd, 1995), but few assessment programs are designed to do so. More typical are systems like NAEP and the assessment programs in Kentucky and Maryland, in which students in various grades are tested in a variety of subjects but scores are not linked across grades. In many instances these cross-sections are limited to a few grades. NAEP usually tests only in grades 4, 8, and 12 (in some instances, grade 11 rather than 12); Kentucky limits most parts of its accountability-oriented testing to grades 4, 8, and 11; Maryland's performance assessment program is administered in grades 3, 5, and 8. Cross-sectional data are, of course, very poorly suited to the measurement of value-added and afford less opportunity to take into account statistically the noneducational determinants of achievement such as family background.
Some systems, such as the Kentucky accountability program, use repeated cross-sections only to measure changes in schools' scores, thus removing some of the confounding between the effects of schooling and the effects of students' backgrounds. A thorough examination of this approach is beyond the scope of this chapter, but it is important to note that it has serious limitations. One is simple imprecision: test scores provide only an error-prone estimate of a school's performance for a given year because of the limited information provided by the
test itself and, often more important, year-to-year differences in the characteristics of cohorts of students.4 Moreover, estimates of changes in school performance are more unreliable than estimates of performance in any one year. In addition to the imprecision caused by random fluctuations in the characteristics of students, some schools may undergo substantial changes in student characteristics-for example, an influx of immigrants or a change in student populations because of boundary changes—that are not taken into account by the performance measurement system.
In theory, accountability programs could use longitudinal rather than cross-sectional data, but this approach also raises practical difficulties. For example, it would require more frequent testing, most likely at least once per grade, with additional financial and time costs. Its applicability to some subject areas is also arguable. It would not be difficult to apply to subject areas in which the curriculum is cumulative, such as reading, writing, and perhaps elementary school mathematics, but it would be considerably more difficult to apply to subjects, such as high school science, in which the curriculum is not cumulative over grades.
Second, most assessment databases include only limited information on the background factors that exert powerful influences on test scores. For example, parental education, income, and ethnicity are all known to be very powerful predictors of performance on tests. Indeed, background factors are more strongly related to variations in scores than are common variations in educational practice. School districts and states, however, cannot require most parents to provide information on any of these variables. Many systems do have data on student race and ethnicity, but the data may not be reliable, especially for ambiguous ethnic classifications such as "Hispanic." Some systems have school-level data for receipt of or eligibility for subsidized school lunches, a questionable proxy for poverty. Data on parental education is rarely available.
Third, most assessment systems lack the ability to address student mobility across jurisdictions. A student who first moves into Kentucky in grade 7 will appear in grade 8 data but not grade 4 data; conversely, a student who leaves Kentucky in grade 7 will disappear from the state's data. This mobility can badly cloud the meaning of cross-sectional data at the state, district, or school level. For example, consider two hypothetical schools with similar and unusually effective mathematics programs but very different mobility rates. The school with the lower mobility rate is likely to have higher scores despite having an equally effective program. Mobility also creates serious problems for value-added models based on longitudinal data. Longitudinal records cannot be kept for many students who leave a school, and even when they can be kept, they become irrelevant as indicators of teachers' performance. Thus, longitudinal value-added
systems are likely to be biased by the exclusion of data pertaining to mobile students, who will often be quite unlike students who remain in a single school for a considerable time.
Limitations of Test Data
Partly because of the factors noted above, the information provided by tests has important limits.
Results can vary across tests. Because tests are samples of domains, their construction requires decisions about the relative emphasis on different types of content, the mix of item or task formats, the distribution of task difficulty, and other aspects of sampling. In addition, the construction of assessments requires a number of technical decisions that are largely independent of sampling, such as the choice of rubrics used to score open-response tasks and the selection of a method for scaling the results.
Given this array of decisions, it should not be surprising that alternative tests of the same domain often present different views of student performance. In the case of well-constructed traditional tests of well-defined domains, student-level cross-sectional correlations between scores on alternative tests are often very high. But even under those conditions, important results can vary markedly and in unexpected ways. For example, during the 1960s and 1970s, when achievement test scores were declining nationwide, mathematics scores of ninth-grade Iowa students on the Iowa Tests of Educational Development dropped roughly a quarter of a standard deviation, although those same students had produced a decline of nearly half a standard deviation in mathematics on the Iowa Tests of Basic Skills when they were eighth graders (Koretz, 1986, pp. 53–54). Similarly, Linn et al. (1990) showed that between the mid-1970s and mid-1980s, trends in third-grade mathematics scores varied substantially across the norming samples for commercial standardized tests, with rates of change at the median ranging from -1.0 to +2.2 national percentile ranks per year. Elizabeth Lewis Harris and I tabulated the 1986 National Assessment of Progress in Mathematics and found that the size of the black-white difference was sensitive to the relative emphasis given to content areas such as numbers and operations, algebra, and geometry.5
As assessment programs increasingly replace the multiple-choice format with essays and hands-on tasks, additional threats to robustness across tests arise. For example, NAEP tried scoring on-demand writing assessments using different rubrics (primary trait and holistic scoring) and found that correlations across rubrics ranged from .34 to .70, with a median of only .46 (Mullis et al., 1994, p. 308). In a more extreme case, the NAEP's first two trials of writing portfolios showed low agreement between portfolio scores and on-demand writing scores in the 1990 and 1992 assessments (Gentile, 1992; Gentile et al., 1995). In fact, one
can determine from the cross-tabulations provided by NAEP that the agreement rate was in every case only trivially higher than chance. 6
The extent to which discrepancies among alternative tests or rubrics matters depends on how the results are used. If, for example, a test is used as one of several indicators of improvement or only to support inferences about the approximate magnitude of change, modest discrepancies among tests might be of little consequence. On the other hand, if schools are to be rewarded or sanctioned based solely on a fixed numerical criterion for changes in test scores, the underlying limitations matter far more, for they mean that decisions about test construction, often unrelated to decisions about the aspects of performance for which schools are supposed to be held accountable, will influence who is rewarded or punished.
Adjusted (partial) estimates of performance are often unstable. In many systems, school-level scores—for example, mean or median scores for students in a given grade—are the basis for accountability. Because school averages are strongly influenced by students' backgrounds, some programs adjust scores to take into account the limited background information available, such as the percentage of students from minority groups or the percentage receiving free or reduced-priced school lunches. The purpose of these adjustments is to provide a "fair" index of school effectiveness.
Controversy continues about the adequacy of indices of school effectiveness, but the evidence accumulated over the past two decades suggests wariness. First, such indices have been found in some studies to be inconsistent across grades and subject areas (e.g., Mandeville and Anderson, 1987), raising the prospect that the often limited scores available will inadequately measure school outputs and may lead to erroneous conclusions. Second, there is some evidence that the rankings of schools can be sensitive to the particular statistical model used to control for background information (e.g., Frechtling, 1982), although there is also evidence that they may be reasonably stable across variations within a given class of model (Clotfelter and Ladd, 1995). This model dependence of results may not be surprising, given the severity of the problems of omitted variables and inadequate measurement that confront such efforts. Third, school effectiveness indices are often unstable over time, a critical limitation in accountability systems that depend on measures of change. For example, Rowan and his colleagues (Rowan and Denk, 1983; Rowan et al., 1983) ranked 405 California schools on the basis of sixth-grade test scores after controlling for demographic variables and third-grade test scores. They classified the schools in the top quartile of adjusted scores as effective and then tracked their rankings over two additional years. The
results varied from analysis to analysis, but in one fairly typical instance, of the 25 percent of schools initially classified as effective, only 10 percent remained "effective" in year 2 and only 5 percent in year 3. As many as 17 percent of schools went from the top quartile to the bottom quartile, or vice versa, between the first and third years examined. It seems hardly plausible that such dramatic shifts in "effectiveness" were real.
A primary reason for this instability is cohort-to-cohort differences in the characteristics of students attending a school. This is particularly problematic in the case of elementary schools, which typically have far fewer students per grade than do secondary schools and therefore have averages that are more influenced by a few particularly good or bad students.
In a set of schools that vary markedly in terms of background characteristics of students, the stability of those characteristics will often induce some stability of rankings in terms of raw scores. For example, schools that serve the children of highly educated parents in one year are likely to have similar student populations the next and therefore may consistently outscore schools that serve children of poorly educated parents. However, when stable differences in background characteristics are minor, or when their influence is removed or lessened statistically, the effects of cohort differences become a larger proportion of the total variability among schools, and the rankings of schools accordingly become much less stable.
Test scores are highly susceptible to corruption. In the context of accountability systems, this is probably the most serious and vexing limitation of test scores. Because tests are samples from large domains, instruction can be directed specifically toward the content emphasized on the test or the format of the test's tasks, at the expense of other important content that is either untested or given less weight on the test. In addition, instruction can be directed toward test-taking skills rather than content. That can make scores a biased estimate of mastery of the domain about which inferences are to be drawn. In other words, scores become inflated or corrupted.
Corruptible measures arise in other areas as well. For example, consider the federal budget deficit under the Gramm-Rudman-Hollings limits of the 1980s. There are many possible ways to measure the deficit, but Gramm-Rudman-Hollings focused on a particular subset. As a result, a great deal of effort went into making changes in the particular deficit measure of concern, even when the real effect on the deficit was inconsequential or nil. A good example was the movement of military paydays by a few days to put them in the fiscal year that did not count at a particular moment in the political debate.
Test scores may be unusual among social indicators, however, in the severity of their susceptibility to corruption. The following section provides evidence of the inflation of scores, as well as evidence of the contribution that test-based accountability can make to inflated scores.
Effects of Accountability-Oriented Testing
Although overconfidence in the test-based reforms of the 1980s resulted in a scarcity of research on their impact, there is enough evidence to paint a discouraging picture. The 1980s saw a significant inflation of scores, and there is evidence that undesirable instruction played a role in bringing it about.
Inflation of Scores
One hint that test scores were inflated in the 1980s comes from the NAEP. At least until recently, when limited comparisons among states were made possible by infrequent larger samples, no one had an incentive to "teach to" NAEP. The samples tested in most jurisdictions were too small to permit reliable estimates for them, and, in any case, NAEP did not report any results for states or localities. The smallest geographic areas for reporting were, until recently, four modified U.S. Census regions. Moreover, in recent years the structure of the test would have made it relatively difficult to teach to. First, large numbers of items are replaced on every assessment, and only items that will not be reused are released for public scrutiny. Second, the test is large and matrix sampled. That is, it comprises more items than an individual student can take in the allotted time, and students are assigned only random subsets of them.
One indication of possible corruption of scores would thus be a substantial divergence between trends on NAEP and trends on other assessments that provide more incentive and often more opportunity for coaching. Linn and Dunbar (1990) noted that over a number of two-year assessment cycles, the NAEP showed substantially less improvement than did many state and local testing programs. Although this pattern might have a number of explanations, a likely one is that the NAEP, unlike many state and local tests, was immune to the corrupting influence of teaching to the test.
A second suggestion of inflated test scores from aggregate data is the so-called Lake Wobegon phenomenon: the fact that most states with statewide data and an implausible proportion of districts in other states reported themselves to be "above the national average." This pattern was first reported by a family practitioner in West Virginia who was skeptical of his own state's scores and called around the country to get information from other states and districts (Cannell, 1987). Although Cannell's report was wrong in some of the specifics, his basic conclusion that an implausible proportion of jurisdictions were above the national average was confirmed (Linn et al., 1990). Linn et al. (1990) concluded that out-of-date norms may have accounted for part of the inflation of test scores. That is, achievement had improved nationwide, and old norms were therefore too easy and made states and districts using them appear higher-performing, relative to the nation as a whole, than they really were. However, there was also evidence of teaching to the test as well (Shepard, 1990). Moreover, the
effect of old norms is not itself independent of teaching to the test. Because user districts are heavily represented in norming samples, teaching to the test could underlie some of the increasing difficulty of norms found during the 1980s (Linn et al., 1990).
A more direct evaluation of the inflation of test scores in high-stakes testing programs was provided by Koretz et al., (1991). They administered a variety of independent achievement tests to students in districts in which educators felt pressured to raise scores. Inflation of scores on the high-stakes tests would be reflected in a lack of "generalizability of performance"—that is, a lack of correspondence between performance on high-stakes tests and performance on other tests that had similar content but for which teachers had not had an opportunity or the motivation to coach. The study included three subjects—mathematics, reading, and vocabulary—in two different elementary grades in each of two districts. Randomly equivalent groups of students were administered two tests for purposes of substantive comparisons. Because the high-stakes test in each case was multiple choice, one comparison was to a competing commercial multiple-choice test. A second comparison was based on a test built to mirror the content of the high-stakes tests but that included a mix of formats. When possible, an additional randomly equivalent group was administered a "parallel form" of the high-stakes test itself—that is, a second form constructed and scaled to yield the same results as would be obtained with the primary form. This last test was used to check for biases caused by a lack of student motivation to do well on the study's tests or by differences in teachers' administration of the tests. The study tracked the scores of schools and districts for as long as five years, but the results reported here are based on cross-sectional data. In other words, the performance of individual students was not tracked over time.
The study revealed serious inflation of test scores in most, but not all, instances. Scores tended to be more inflated in mathematics than in reading. A particularly clear example is third-grade mathematics testing in the district that afforded us the strongest research design. In that district, teachers felt strong pressure to raise scores on a multiple-choice test administered district-wide. Median scores were published annually for each school in the district. For a period ending four years before the study, the district administered one test, called test C in the study. For the next four years it instead administered a competing test, test B, which to the untrained eye would look quite similar. Like most commercial norm-referenced tests, the results of both tests were reported using the same metrics, such as national percentile ranks and grade equivalents, which simplifies comparisons between them.
In the fourth year in which test B was administered, Koretz et al. administered test C—the identical test that the district had last used four years earlier—to one random sample of classrooms and the alternate tests to a second sample. A third random sample was administered the parallel form of test B, the district's current high-stakes test. Parallel-form scores in grade 3 were very similar to
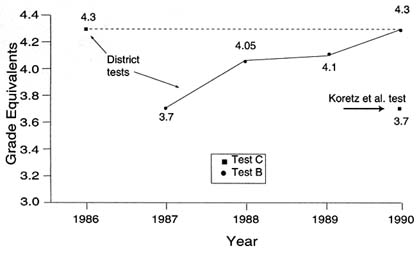
FIGURE 9.1 Performance on coached and uncoached tests, third-grade mathematics (adapted from Koretz et al., 1991).
published test B results, indicating that scores on the other tests administered in the study were unlikely to have been depressed by motivational or other artifacts.
When the district first switched from test C to test B, the median score in the district (the median of school medians) fell about half an academic year, from a grade equivalent (GE) of 4.3 to 3.7 (see Figure 9.1).7 This corresponds to a decline from a national percentile rank (NPR) of 64 to an NPR of 52. Many factors could have contributed to this specific difference—for example, more recent and harder norms for the newer test, differences in scaling, and differences in the quality of national norming samples. But a sizable drop in scores is commonplace when one test is substituted for another because teachers are not yet familiar with the content and emphasis of the new test. In other words, some amount of decline is to be expected because of the effects of teaching to the older, familiar test.
A more clear-cut test of the generalizability of performance is provided by the comparison between Koretz, et al.'s administration of test C four years after it had last been used by the district and the results of the district's own final administration of that test. This comparison, which is not confounded with differences between tests or norms, also showed a substantial weakness of
generalizability. The median score of the sample schools on test C was roughly 5 months (or 17 percentile points) lower in year 5 than in year 1, the last year in which the district administered that test itself. In year 5 the median school had an adjusted median GE of 3.8 and a median national percentile rank of 48, compared to the median of 4.2 (NPR = 65) in the last year that test C was the district's own test.8 Indeed, performance on test C when we administered it to students who had not been coached for it was very similar to the performance in the districts' own program the first year it administered test B—that is, before anyone had an opportunity to coach for it.
Degradation of Instruction
The notion that holding educators accountable for scores on multiple-choice tests can degrade instruction was controversial less than a decade ago but is now almost axiomatic in the policy community. There are a number of ways in which degradation can occur.
Narrowing of instruction within subject areas. One form of degraded instruction is simply the flip side of inflated scores: undue narrowing of instruction to focus on the content emphasized on the test. Of course, focusing on the content of the test is not always bad; after all, one aim of test-based accountability is to accomplish precisely that end. Whether that focus is desirable or undesirable hinges on how it is brought about. To focus on the content of the test, teachers must take time from something else. The problem arises when teachers focus on the content of the test by taking time away from other parts of the domain that are excluded from or little emphasized by the test but that are nonetheless important. A number of surveys have found that many teachers knowingly take time away from other important parts of the curriculum (e.g., Darling-Hammond and Wise, 1985; Salmon-Cox, 1982, 1984; Shepard, 1988; Shepard and Dougherty, 1991). In this case, gains on the test may be seen not as improved mastery of the domain, but as a transfer of mastery from one part of the domain to another.
De-emphasis of untested subject areas. In contrast to most secondary school teachers, each of whose classes is restricted to a single subject area, most elementary school teachers teach a variety of subjects to the same students for most or all of the day. These teachers have an additional option for responding to test-based accountability, that is, to reallocate time across subject areas or other activities to maximize score gains. This is particularly problematic in the case of the many testing programs that assess only a small number of subject areas. For example, in one district some elementary teachers reported responding to test-based ac
countability by reducing the time allocated to science, which was not a tested subject area (Salmon-Cox, 1982, 1984). In this case, gains on the test can be seen as transfers of achievement from untested to tested subject areas.
Excessive drill. Once teachers know what specific skills are included on a test, they can devote large amounts of time to drilling students on them. The consequence can be boredom and the elimination of more demanding and potentially more valuable types of work.
Test preparation. Apart from focusing the content of instruction to better match the content of the test, teachers can engage in a wide variety of activities explicitly intended to prepare students for the test. Some of these activities are likely to be a waste of potentially valuable instructional time. For example, a number of companies (including but not limited to publishers of achievement tests) sell materials designed to help students prepare for specific achievement tests, and some teachers devote considerable time to using them. The impact of these materials on test scores is a matter of some dispute, just as the effectiveness of coaching for the Scholastic Assessment Test (SAT), formerly the Scholastic Aptitude Test, has been the focus of controversy. However, few would argue that students' underlying achievement, as opposed to their scores on tests, is helped more by using test practice materials than by instruction in tested subject areas.
As the material used to prepare students becomes increasingly similar to the actual test, test preparation approaches and eventually crosses the blurry, often subjective, line and becomes cheating, whether intentional or not. This can take many forms—for example, practicing problems that appear on the test or giving students hints based on the specific ways items are presented on the test. For example, in the early 1980s one California district was faced with a court order to increase scores at a specified rate in schools with large minority enrollments. The district responded by implementing a ''mastery learning" curriculum that broke instructional goals into a sequence of small objectives and then allowed students to master each objective before proceeding to the next. Unfortunately, in one subject area—vocabulary—the district based its new curriculum substantially on the test that was used for accountability, incorporating the tested vocabulary words and their synonyms into the curriculum. A review found that well over half of the accountability test in vocabulary had been compromised in this fashion, and vocabulary gains appeared to be substantially inflated. On a different form of the same test there were much smaller gains. Oddly, the review found no compromise or inflated gains in other subject areas (Nagel, 1984).
Changes in the selection of students for testing. Schools and districts can improve scores by altering the pool of students tested. For example, holding low-achieving students back in the grades before those in which testing is done is likely to raise scores, and at least one study found increases in such retention following the imposition of high-stakes testing (Gottfredson, 1988). The selec-
tivity of the tested group can also be manipulated by being lax about truancy or by excluding from testing students with limited English proficiency or certain handicaps. Although there are no systematic data on the frequency of such practices, they are widely perceived to occur and some states have imposed very strict rules to avoid them. In Kentucky, for example, only handicapped students whose conditions have removed them from a normal diploma-granting program are excluded from the regular state testing program, although other handicapped students undergo testing under special conditions consistent with their Individualized Education Plans.
The Potential of Technical Innovations in Assessment
In the several years since the failings of the test-based accountability of the 1980s have become widely acknowledged, debate has focused in large part on altering tests, now generally called "assessments" to distinguish the new from the old. There are indeed steps that can be taken to lessen the problems noted above, although within practical constraints, the most that one can reasonably expect is to ameliorate them. Several of the most important steps are the following.
Methods of Reducing the Inflation of Scores
The most obvious method of reducing the inflation of scores, frequently discussed but often ignored in practice, is keeping test materials secure and changing them often. If teachers and students know only the framework of a test but have never seen the specific items that will be used in a given form of the test, they will be less able to train for the test at the expense of the domain as a whole. The Educational Testing Service traditionally has kept most SAT items secure and changed many for each new administration of the test, a procedure followed by the NAEP. Publishers of conventional achievement tests, on the other hand, tend to prepare only two highly similar forms of each edition of a test and to issue new editions only every six or seven years. School districts often use only one of the forms and keep copies between administrations of the test, with varying degrees of security.
Although test security and novelty can greatly reduce the inflation of test scores, they are not foolproof. One reason is cost. Test development is a costly process, and putting out new forms and replacing test materials every year would greatly increase the cost of testing programs. Second, if tests are to be comparable from one administration to the next to hold schools accountable for changes over time, successive forms of a test must be very similar. The more similar the test items are, the less impact replacement of test forms has on the inflation of scores.9
A more fundamental problem is that a test can only be an effective inducement to better instruction if teachers understand its content. Indeed, one of the axioms of advocates for accountability-based performance assessments is that the assessments can serve as models of desired student performance and instruction. To serve those functions, tasks very similar to those in the performance assessment must be publicized, and when dropped, they must be replaced by very similar tasks. Thus, accountability and test security impose competing pressures on assessment design.
Another approach to avoid narrowing of instruction and the attendant inflation of scores is to design a broad test while administering only a portion of it to each student. In theory, if a test of a given domain were made broad enough and specific items on it were secure, teaching to the test and teaching the domain would not differ. In practice, most domains are large enough that this ideal cannot be achieved within reasonable limits of expense and testing time, but it can be approximated by making a test several times as long as could be administered to any one student and giving each student a systematic sample of the test's items. In a common variant of this approach, usually called "matrix sampling," a test is broken into several different forms that are distributed randomly to students within the unit for which performance is to be reported, usually a school or district.
Matrix sampling and other sampling approaches, however, have an important limitation that forces a politically difficult trade-off. While sampling approaches can provide better estimates of group performance than can be obtained with a traditional test, they typically do not provide adequate assessments of individual students. Scores for individual students may be unreliable because of short test length, and students' scores may be dependent on the particular form they are given. In theory, one might separate the two functions, using a sampling-based assessment to provide aggregate estimates and a second, linked assessment to provide scores for individual students. In practice, however, it has been politically difficult to maintain an expensive and time-consuming sampling-based testing program that does not provide reliable scores for individual students. For example, Governor Wilson cited the lack of scores for individual students as one reason for terminating California's well-known assessment program, and both Kentucky and Maryland are now wrestling with the question of how to respond to pressure to report student-level scores from their matrix-sampled assessments.
The extent to which techniques such as test security, novel test content, and matrix sampling can avoid inflated test scores remains a matter of debate. There are as yet no good data on score inflation in accountability systems that rely heavily on all of these techniques. It seems likely, however, that they will provide only a partial solution for the foreseeable future.
The Promise (?) of Performance Assessment
A central tenet of the current "second wave" of education reform is that reliance on diverse performance assessments as the basis for school accountability will circumvent problems encountered with test-based accountability in the 1980s. This view appears to be overly optimistic.
There is some evidence, albeit limited, that shifting to performance assessments can address one of the two problems associated with test-based accountability; it can improve rather than degrade instruction. For example, Koretz et al. (1993, 1994a) found that Vermont educators reported a substantially greater emphasis on problem-solving and mathematical communication following implementation of the state's portfolio assessment program. Nevertheless, evidence about the instructional effects of performance assessment programs remains scarce. It is not clear under what circumstances these programs are conducive to improved teaching or what the effects are on student achievement.
On the other hand, there is as yet no reason to believe that test-based accountability will ameliorate the problem of inflated test scores. Indeed, there are reasons to expect that some types of performance assessments may be more susceptible to corruption. Because of the complexity of performance tasks, scores on them are likely to include sizable task-specific but construct-irrelevant variance—that is, variance that reflects idiosyncratic aspects of tasks rather than attributes of the latent trait supposedly being measured. For this reason, performance typically correlates only weakly across related tasks, even when the tasks are as similar as essays (e.g., Dunbar et al., 1991; Shavelson et al., 1993). Moreover, in most instances, performance assessments will comprise far fewer tasks than a corresponding multiple-choice test because of the student time required for each performance and the costs of developing them. Thus, a performance assessment is likely to comprise a relatively small number of poorly correlated tasks with substantial idiosyncratic attributes. Coaching students to do well on a small number of such tasks could easily lead to large gains in scores without commensurate real gains in mastery of the underlying areas of knowledge.
Performance assessment programs present other obstacles as well. They have been time consuming and costly to develop. Because of the amount of student time required to complete each performance, they increase the pressure to use a matrix-sampled design and to forego scores for individual students. In some cases they have proved difficult and costly to score (see Koretz et al., 1994a, b).
Finally, many innovative performance assessments have not yet been adequately validated. Although the tasks they comprise often seem appropriate, such "face validity," in the jargon of educational measurement, is not sufficient basis for judging them to be valid measures. In most cases little of the evidence needed for validation has been gathered; and in some cases the limited evidence available is discouraging. For example, it was noted earlier that the NAEP has
shown essentially chance relationships between writing portfolio scores and scores on NAEP's on-demand test of writing, a pattern that raises serious doubt about the validity of the portfolio scores as a measure of writing proficiency. Koretz et al. (1993, 1994a) disattenuated relationships between portfolio scores in writing and mathematics, on-demand writing scores, and scores on a multiple-choice test of mathematics.10 They reasoned that evidence of validity would be a finding that correlations were higher within domains (but across test formats) than across domains. For the most part the correlations did not show this pattern.
Steps Toward the Appropriate Uses of Tests
The discussion above represents a fairly discouraging assessment of test-based accountability. Traditional approaches have not worked well, and the scanty available evidence does not suggest that shifting to innovative testing formats will overcome their deficiencies. What is needed is a better use of tests, not just better tests.
What then should be done? It is neither realistic nor desirable to avoid the use of achievement tests in accountability systems. Meeting more of the goals of an accountability system and minimizing undesirable effects, however, is likely to be far more complex and difficult than many advocates of test-based accountability contemplate. It will require trial and error and many midcourse corrections. Three questions should be considered in designing an assessment program for this purpose: What attributes are important for the assessment program? How should the assessment itself be evaluated? How might achievement tests be incorporated into an accountability system?
Designing an Assessment Program
To meet the goals of many accountability systems, an assessment system is likely to need several components, each tailored to specific purposes. Tests that are used to hold teachers accountable and to induce changes in instruction may be poorly suited to providing high-quality data for comparing schools or even monitoring progress over time (see Koretz et al., 1994b). It may be important to give heavy emphasis in such tests to formats that have a large positive influence on instruction but that are inefficient or worse in terms of measurement quality. Moreover, any test used for this purpose is vulnerable to corruption, potentially distorting estimates of change.
Therefore, it may be essential to maintain a component of the assessment system that is designed specifically to monitor progress in the aggregate. This component could also serve as an audit mechanism, alerting jurisdictions to instances of egregious inflation of scores on the accountability tests. These tests
would require greater protection from corruption, perhaps including higher levels of test security and more novel items per iteration than tests used for short-term accountability. In addition, monitoring tests might be constructed with more emphasis on formats, including multiple-choice items, chosen on the basis of measurement value rather than instructional incentives, although there are arguments both for and against this approach.
How to combine these two types of tests in measuring performance is likely to be a matter of debate. However, the data systems in which they are combined should be capable of supporting inferences about school as well as student performance. Simple cross-sectional differences in mean or median scores are unlikely to suffice. Some jurisdictions, such as Kentucky, hold schools accountable for changes in scores rather than for cross-sectional rankings that are heavily influenced by noneducational factors, but change scores present difficulties as well. Short-term change scores, particularly for small schools, can be unstable and misleading because of cohort-to-cohort differences in student characteristics. Differential student mobility remains a potentially serious source of bias, even when change rather than a cross-sectional average is the basis for accountability. Moreover, change measures may require careful scaling if they are to be fair to low- and high-achieving schools. Many of these difficulties are at least partially soluble, but in most instances solutions have not even been specified, let alone evaluated.
Evaluating Assessments
The results of accountability-oriented testing programs must themselves be assessed. Test-based accountability systems have been considered by many of their proponents to be self-evaluating, in that increases in scores on the tests used for accountability have been viewed as sufficient evidence that the policy has succeeded. Given the problem of inflated test scores, this view is clearly unfounded.
First, tests used in an accountability system should be evaluated against the conventional standards of reliability, validity, and fairness that apply to all tests, regardless of whether they are used for accountability. Second, tests used for accountability must be evaluated for inflation of scores. The monitoring tests suggested above represent one means of doing this. State-level NAEP scores, if available often enough in the same subjects and grades, might also serve as a mechanism for gauging inflation at the state level, although the NAEP is not designed to provide usable estimates at the level of individual schools and therefore would not be useful for determining whether there are specific schools in which inflation is particularly severe or modest.
Finally, the impact, often technically termed "consequential validity," of accountability-oriented testing programs should be evaluated directly. The possibility of inflated scores augments the importance of the direct assessment of impact, but even when score gains warrant confidence, direct appraisals of im-
pact may be important. For example, some schools may achieve real gains in scores by methods that parents and communities might consider unacceptable—for example, by eliminating important activities such as instrumental music or by imposing oppressive amounts of homework that preclude extracurricular activities. Similarly, some teachers may consider it unproductive in terms of test scores to assign certain types of schoolwork such as long-term research projects or exploration of student-initiated questions. Both desirable and undesirable instructional effects of the accountability system may be distributed inequitably.
Embedding Assessments in an Accountability System
The larger question is the role of achievement tests in an educational accountability system. Achievement tests are an important but insufficient basis for holding schools accountable. "School performance" is more than the aggregate of student test scores, and the considerations above suggest that even high-quality tests do not work well enough as an accountability mechanism to warrant relying on them in isolation.
Efforts to embed tests in a broader range of indicators of school performance, however, remain rudimentary and controversial. A number of current reforms hold schools accountable for a variety of outcomes other than test scores. Both Kentucky and Maryland, for example, hold schools accountable for improving performance on a variety of other outcomes—called "non-cognitive" indicators in Kentucky and "data-based areas" in Maryland—such as drop-out rates, promotion rates, and attendance rates. The accountability systems in both states, however, mirror the national debate in giving more weight to test scores than to other outcomes, and some of the others show too little variance or change over time to have much impact.
The inclusion of school-performance indicators other than student outcomes is currently mired in controversy. Along with renewed enthusiasm for using tests to hold schools accountable has come widespread disparagement of holding schools accountable for "process" variables, such as financial and other inputs, instructional offerings, and similar factors. Few reformers endorse complete elimination of process accountability; for example, few would advocate eliminating all due process guarantees for disabled students. Moreover, some process criteria, such as "delivery standards" or "opportunity-to-learn standards,'' remain a part, albeit a very controversial part, of current reform debate. Nonetheless, process-oriented accountability is widely considered insufficient; and many reformers consider it a counterproductive distraction from the more important issue of outcomes.
The distinction between "process" and "outcome" accountability, however, is misleading and hinders the effort to devise an effective set of indicators for monitoring school performance. Schools produce a wide range of outcomes, some of which shade into "process."
The outcomes used in current accountability systems are often distant from teachers' day-to-day decisions. This is particularly true of some non-test indicators. For example, a fourth-grade teacher is likely to focus on issues much closer at hand than a student's potential decision, years hence, to drop out of school. Even achievement tests may not be a principal concern of many teachers given that many current accountability systems test students only in a few grades.
Teachers often establish shorter-term goals that, if met, produce important proximal outcomes that may or may not be reflected in test scores or other student-performance outcomes years later. For example, a teacher who decides to place greater emphasis on mathematics content that will be tested two grades hence may be contributing directly to higher scores. On the other hand, a teacher's decisions may be intended to increase students' interest in a subject, their intrinsic motivation to pursue it, or their willingness to take on large, self-directed projects. These efforts might be very important in terms of the broad goals of schooling, but their effect on later test scores is uncertain. Indeed, actions that are successful in terms of such proximal outcomes may even have negative effects on scores. For example, a teacher may decide to devote considerable time to a topic of unusual interest to her students to increase motivation, at the cost of reducing time devoted to other tested topics.
Proximal outcomes are often central to informal or local evaluations of schooling. For example, parents and principals often discuss whether course work is sufficiently challenging, whether homework is too heavily focused on boring drills, whether the amount of homework is appropriate, and whether students are motivated by their schoolwork and proud of their products. Centralized accountability systems, however, often give short shrift to proximal outcomes. They are complex, contextualized, very difficult to measure, and seemingly more ambiguous in meaning than test scores.
Thus, one of the major challenges in achieving better educational accountability may be deciding how much weight to give proximal outcomes and how to measure them. Some efforts have already been made to bridge the gap between distant and proximal outcomes. One rationale for large-scale portfolio assessment, for example, is that it holds teachers and students accountable for the work they produce on an ongoing basis, not just for the impact of that work on later test scores. Portfolios could also be used to monitor the quality of teachers' instructional offerings or their success in improving them rather than students' performance. The difficulties inherent in using portfolios and other nonstandardized assessment tools in a large-scale assessment, however, are formidable (Koretz et al., 1994b).
Conclusions
The notion that schools must be held accountable for their performance is compelling, and student achievement as measured by test results is clearly one of
the most important components of evaluation. It is not straightforward, however, to design an accountability-oriented testing program that provides reasonable incentives for change and valid information about improvement, all at a reasonable cost in terms of money and student time. Some requirements of accountability systems are clear, but to have a reasonable chance of success, accountability systems themselves must be the subject of ongoing monitoring and evaluation. Moreover, tested student achievement should be placed in a broader constellation of desirable educational outcomes.
References
Airasian, P. W. 1987. "State mandated testing and educational reform: context and consequences." American Journal of Education 95(May):393–412.
Ambach, G. 1987. Comments on "Should instruction be measurement-driven?" Invited debate, annual meeting of the American Educational Research Association, New Orleans, April .
Cannell, J. J. 1987. Nationally Normed Elementary Achievement Testing in America's Public Schools: How All Fifty States Are Above the National Average. Daniels, W. Va.: Friends for Education.
Clotfelter, C. T., and H. F. Ladd. 1995. Picking winners: recognition and reward programs for public schools. Unpublished paper, The Brookings Institution, Washington, D.C.
Darling-Hammond, L., and A. E. Wise. 1985. "Beyond standardization: state standards and school improvement." The Elementary School Journal Jan.:315–336.
Dunbar, S., D. Koretz, and H. D. Hoover. 1991. "Quality control in the development and use of performance assessment." Applied Measurement in Education 4(4):289–303.
Frechtling, J. A. 1982. Alternative methods for determining effectiveness: convergence and divergence. Paper presented at the annual meeting of the American Educational Research Association, New York, N.Y.
Gentile, C. 1992. Exploring Methods for Collecting Students' School-Based Writing: NAEP's 1990 Portfolio Study. Washington, D.C.: National Center for Education Statistics.
Gentile, C. A., J. Martin-Rehrmann, and J. H. Kennedy. 1995. Windows into the Classroom: NAEP's 1992 Writing Portfolio Study. Washington, D.C.: National Center for Education Statistics.
Goslin, D. A. 1963. The Search for Ability: Standardized Testing in Social Perspective. New York: Russell Sage Foundation.
Goslin, D. A. 1967. Teachers and Testing. New York: Russell Sage Foundation.
Goslin, D. A., R. R. Epstein, and B. A. Hallock. 1965. The Use of Standardized Tests in Elementary Schools. New York: Russell Sage Foundation.
Gottfredson, G. D. 1988. You Get What You Measure, You Get What You Don't: Higher Standards, Higher Test Scores, More Retention in Grade . Report #29, Center for Research on Effective Middle Schools.
Haney, W., and A. Raczek. 1994. Surmounting outcomes accountability in education. Paper prepared for the Office of Technology Assessment, U.S. Congress. Boston College Center for the Study of Testing Evaluation and Educational Policy, Chestnut Hill, Mass.
Hanushek, E. et al. 1994. Making Schools Work: Improving Performance and Controlling Costs. Washington, D.C.: The Brookings Institution.
Jaeger, R. M. 1982. "The final hurdle: minimum competency achievement testing." Pp. 223–247 in The Rise and Fall of National Test Scores , G. R. Austin and H. Garber, eds. New York: Academic Press.
Koretz, D. 1986. Trends in Educational Achievement. Washington, D.C.: Congressional Budget Office.
Koretz, D. 1992. "State and national assessment." In Encyclopedia of Educational Research, 6th ed., M. C. Alkin, ed. Washington, D.C.: American Educational Research Association.
Koretz, D. M., R. L. Linn, S. B. Dunbar, and L. A. Shepard. 1991. "The effects of high-stakes testing: preliminary evidence about generalization across tests." In R. L. Linn (chair), The Effects of High-Stakes Testing. Symposium presented at the annual meetings of the American Educational Research Association and the National Council on Measurement in Education, Chicago, Ill.
Koretz, D., B. Stecher, S. Klein, D. McCaffrey, and E. Deibert. 1993. Can Portfolios Assess Student Performance and Influence Instruction? The 1991–92 Vermont Experience. Santa Monica, Calif.: RAND Corp. (Reprinted from CSE Technical Report 371, National Center for Research on Evaluation, Standards, and Student Testing, Los Angeles.)
Koretz, D., B. Stecher, S. Klein, and D. McCaffrey. 1994a. The Evolution of a portfolio Program: The Impact and Quality of the Vermont Program in Its Second Year (1992–93). Los Angeles: National Center for Research on Evaluation, Standards, and Student Testing.
Koretz, D., B. Stecher, S. Klein, and D. McCaffrey. 1994b. "The Vermont portfolio assessment program: findings and implications." Educational Measurement: Issues and Practice , 13(3):5–16.
Linn, R. L., and S. B. Dunbar. 1990. "The nation's report card goes home: good news and bad about trends in achievement." Phi Delta Kappan 72(2):127–133.
Linn, R. L., M. E. Graue, and N. M. Sanders. 1990. "Comparing state and district results to national norms: the validity of the claim that 'everyone is above average.'" Educational Measurement: Issues and Practice 9(3):5–14.
Mandeville, G. K., and L. W. Anderson. 1987. "The stability of school effectiveness indices across grade levels and subject areas." Journal of Educational Measurement 24(3):203–214.
Mullis, I. V. S., J. A. Dossey, J. R. Campbell, C. A. Gentile, C. O'Sullivan, and A. S. Latham. 1994. NAEP 1992 Trends in Academic Progress. Washington, D.C.: National Center for Education Statistics.
Nagel, T. S. 1984. Desegregation, education, or both? From the inside looking out—findings of an integration analyst. Paper presented at the annual meeting of the American Educational Research Association, San Diego, April 25.
National Commission on Excellence in Education. 1983. A Nation at Risk. Washington, D.C.: U.S. Department of Education.
National Council on Education Standards and Testing (NCEST). 1992. Raising Standards for American Education: A Report to Congress, the Secretary of Education, the National Education Goals Panel, and the American People. Washington, D.C.: NCEST.
Pipho, C. 1985. "Tracking the reforms, part 5: testing—can it measure the success of the reform movement?" Education Week 4(35):19.
Popham, W. J., K. L. Cruse, S. C. Rankin, P. D. Sandifer, and P. L. Williams. 1985. "Measurement-driven instruction: it's on the road." Phi Delta Kappan 66(9):628–634.
Roeber, E. 1988. A history of large-scale testing activities at the state level. Paper presented at the Indiana Governor's Symposium on ISTEP, Madison, Ind., Feb. 10.
Rowan, B., and C. E. Denk. 1983. Modeling the Academic Performance of Schools Using Longitudinal Data: An Analysis of School Effectiveness Measures and School and Principal Effects on School-Level Achievement . San Francisco: Far West Laboratory.
Rowan, B., S. T. Bossert, and D. C. Dwyer. 1983. "Research on effective schools: a cautionary note." Educational Researcher 12(4):24–31.
Salmon-Cox, L. 1982. MAP math: end of year one report. Unpublished, Learning Research and Development Center, University of Pittsburgh.
Salmon-Cox, L. 1984. MAP reading end-of-year report. Unpublished, Learning Research and Development Center, University of Pittsburgh.
Shavelson, R. J., G. P. Baxter, and X. Gao. 1993. "Sampling variability of performance assessments." Journal of Educational Measurement 30(3):215–232.
Shepard, L. A. 1988. The harm of measurement-driven instruction. Paper presented at the annual meeting of the American Educational Research Association, Washington, D.C., April.
Shepard, L. A. 1990. "Inflated test score gains: is the problem old norms or teaching the test?" Educational Measurement: Issues and Practice 9(3):15–22.
Shepard, L. A., and K. C. Dougherty. 1991. "Effects on high-stakes testing on instruction." In R. L. Linn (chair) The Effects of High Stakes Testing, Symposium presented at the annual meetings of the American Educational Research Association and the National Council on Measurement in Education, Chicago, Ill.


