
4
Nursing Personnel in a Time of Change
The previous chapter has portrayed an evolving health care system, driven by the need for cost-effectiveness under continued pressures of cost containment and competition. The aging and increasing diversity of the U.S. population and the projected growth of the oldest old will have a major impact in the years ahead on the demand and supply of health services and the level and type of resources needed to provide those services. Nursing personnel are an integral component of the health care delivery system and, therefore, they are most directly affected by these changes.
As discussed in Chapter 3, the structure, organization, and financing of health care is rapidly changing, leading to a shift in the delivery of health care from the inpatient hospital setting to communities and outpatient care. These changes have led to redesign of staffing patterns, and the organization of care in hospitals. They also are downsizing and engaging in various patterns of substitution of personnel to accommodate the reduced volume of inpatient care and to stay economically competitive and viable. Although the volume of inpatient care has declined, patients entering the hospital are sicker than in previous years and, as a consequence, the intensity of care required has increased.
Staffing in nursing homes has improved slightly since the passage of the Nursing Home Reform Act of 1987 (see Chapter 6 for an elaboration of this subject). Nevertheless, the chronic problems of the limited presence of professional nursing at the bedside in nursing homes continue and take on added importance in the current state of transition in the health care system. Most of the direct care in nursing homes has been, and continues to be, provided by nurse assistants.
The implications of the trends identified above for the nursing workforce are
profound, both in terms of numbers and in terms of adequate distribution of the skills and educational preparation of the workforce. Determination of the adequacy of the nursing workforce (registered nurses, licensed practical nurses, and nurse assistants) in the institutional health service settings that are within the scope of this inquiry calls for an assessment of the overall supply of nursing personnel in the context of the shifting demand for their services and the factors affecting such demand.
This chapter provides a brief overview of the supply of nursing personnel and their employment trends. It examines the adequacy of the quantity and comments on the educational preparation of the supply, given the changing demands for nursing services. The chapter concludes by briefly commenting on the implications for nursing personnel as the nation approaches the next century, and offers a commentary on the kinds of knowledge and skills needed in the nursing workforce to provide effective nursing care in the future.
Supply Of Nursing Personnel
Nursing personnel for purposes of this study include registered nurses (RN), licensed practical nurses, (LPN), and nurse assistants (NA).1 Approximately 3 million health care personnel in the United States work in nursing (HRSA, 1992).
RNs and LPNs are subject to state licensing requirements. Although all RNs take the same licensing examination to qualify for practice, they are prepared through 1 of 3 educational pathways that can take 2, 3, or 4 years of training. This diversity in training requirements is a matter of considerable controversy within the nursing profession. All RNs are not alike in terms of basic and advanced clinical education and skills; their responsibilities may range from the provision of direct patient care at the staff level, to management and direction of complex nursing care systems in the institutional and community settings, as well as to teaching and other academic functions.
LPNs primarily provide direct patient care in institutional settings under the direction of a physician or an RN. Nurse assistants and other ancillary nursing
personnel assist licensed nurses in the provision of basic care to patients, and they work under the supervision of licensed nursing personnel (ICONS, 1993).
At this time, no uniform standards exist for training, competency evaluation, and certification for nurse assistants to qualify for work in all health care settings. Since the implementation of the 1987 Nursing Home Reform Act, nurse assistants employed in nursing facilities, who provide most of the direct care to residents, have to be certified and are required to take a minimum of 75 hours of training within 4 months of employment and be tested for competency in order to be certified to work in nursing facilities. No comparable standard exists for work in hospitals. There appears to be wide variations among hospitals in the level of training provided to this group of nursing staff. For example, in a study of California hospitals, Barter and colleagues (1994) found that the average ancillary personnel in a hospital may receive less than a month of combined classroom and on-the-job training, ranging from less than 1 week to 3 weeks. (See Chapters 5 and 6 for further discussion of NA training.)
Hospitals are the major employers of nursing personnel (RNs, LPNs, and NAs). Many LPNs and nurse assistants also work in nursing homes and other long-term care (LTC) settings, as well as in ambulatory care settings and home health care service. With the exception of hospitals, detailed national data are not readily available on the employment patterns of nursing personnel. Most of the national databases focus on RNs.2 The last comprehensive national sample survey of LPNs, comparable to the periodic National Sample Survey of Registered Nurses, was conducted by the U.S. Public Health Service in 1983. Some information on LPNs, however, can be gleaned from data available from the Bureau of the Census of the U.S. Department of Commerce, the Bureau of Labor Statistics (BLS) of the Department of Labor, the National League for Nursing (NLN), and individual LPN programs. Data on nurse assistants are limited to basic employment-related statistics specific to the employment setting and some aggregate data from the employment statistics published by the BLS. Hence, the discussion in this chapter unavoidably is heavily weighted toward supply and demand issues affecting RNs.
Registered Nurses
RNs are the largest group of health care providers in the United States. For several decades, their numbers have been continually increasing in absolute num-
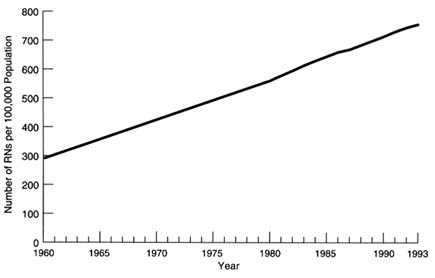
FIGURE 4.1 Estimated active supply of registered nurses (RN) per 100,000 population, United States, 1960–1993. SOURCE: OASH, 1994.
bers and in relation to the population being served, suggesting that the periodic shortages of nurses that the nation has experienced are driven more by increases in demand than by a reduction in quantity. Public policies to alleviate the perceived shortages have focused almost exclusively on developing and funding programs for rapid increases in the supply of nurses, rather than addressing and understanding the issues leading to the recurring shortages, the reasons for the increased demand, and the types and educational mix of the nursing workforce needed and available to meet the changing demand (Aiken, 1995).
In 1992, more than 2.2 million persons held licenses to practice as RNs (Moses, 1994). This number represents an increase of 35 percent since 1980 and a growth of nearly 50,000 per year from 1984 to 1992 (OASH, 1994). In 1960, the nurse-to-population ratio was 292 per 100,000 population, increasing to 560 by 1980, and going up to 755 per 100,000 population by 19933 (unpublished estimates from HRSA) (see Figure 4.1).
Between 1983 and 1993, employment of RNs grew more than twice as fast as employment in the economy as a whole (BLS, 1995c) (see Table 4.1). An estimated 1.8 million of the 2.2 million RNs were employed in nursing positions
TABLE 4.1 Number of Full-Time and Part-Time Employees in Nursing Occupations, United States, Selected Years, 1983–1993
|
|
Year |
Percent Change 1983–1993 |
||||
|
Occupation |
1983 |
1990 |
1991 |
1992 |
1993 |
|
|
Total, all occupations |
92,586 |
111,509 |
110,340 |
110,746 |
112,312 |
21.3 |
|
Registered nurse |
1,287 |
1,700 |
1,756 |
1,820 |
1,887 |
46.6 |
|
Licensed practical nurse |
576 |
635 |
629 |
654 |
679 |
17.9 |
|
Nurse assistant |
1,116 |
1,234 |
1,227 |
1,308 |
1,343 |
20.3 |
|
SOURCE: Bureau of Labor Statistics, Industry-Occupation Matrix. |
||||||
in 1992, an employment rate of nearly 83 percent (Moses, 1994). This compares with about 66 percent for the total U.S. labor force and almost 59 percent for the female labor force (Bureau of the Census, 1995a). Most RNs are women; in 1992 only about 4 percent of the employed RNs were men. Although very small in numbers, the rate of growth since 1988 among men has been faster than among women (Moses, 1994).
Of the 17 percent of RNs who were not working in nursing in 1992, slightly more than 1 percent were actively seeking employment in nursing. The largest portion of those not employed in nursing was not actively looking for jobs in nursing and had not worked in nursing for at least 5 years. Moreover, more than half of those not employed in nursing were 60 years of age and older (Moses, 1994).4
Unemployment rates for RNs were slightly higher in 1994 than they had been for a number of years. Nevertheless, the rates have been consistently lower than the average of 2.5 percent for all professional occupations and 2.9 percent for teachers. Table 4.2 shows trends in unemployment rates for nursing personnel.
Characteristics of RNs
Age Composition of RNs The average age of RNs in 1992 was 43.1 years, representing a continuing increase in average age since 1980. Although some of this increase is to be expected because of the overall aging of the U.S. labor force
TABLE 4.2 Unemployment Rates, Nursing and Other Selected Occupations, United States, Selected Years, 1983–1994
|
|
Year |
|||||
|
Occupation |
1983 |
1990 |
1991 |
1992 |
1993 |
1994 |
|
Total, all occupations |
8.6 |
5.0 |
6.0 |
6.7 |
6.1 |
5.7 |
|
Licensed practical nursesa |
5.3 |
1.7 |
1.8 |
2.0 |
2.2 |
3.3 |
|
Nurse aidesa |
10.8 |
6.8 |
6.7 |
8.0 |
7.8 |
8.0 |
|
Registered nursesa |
1.6 |
1.1 |
1.2 |
1.1 |
1.3 |
1.5 |
|
Professional workers |
3.0 |
1.9 |
2.4 |
2.6 |
2.6 |
2.5 |
|
Teachersb |
2.9 |
1.9 |
1.9 |
2.1 |
2.1 |
2.3 |
|
a Does not include labor force participants who were actively seeking work but had no previous work experience in that occupation. b Does not include college and university teachers. SOURCE: Current Population Survey, special tabulations. |
||||||
the proportion of RNs who are 35 years of age and older increased more than the proportion of workers in all occupations who were 35 and older. Only 11 percent of the RNs were under 30 years of age in 1992, compared with 15 percent in 1980. If current trends continue, by the year 2000 only about 7 percent will be under 30 years. As can be seen from Figure 4.2, by the year 2000 the nursing workforce will be older than it is today; nearly 70 percent of the RNs will be 40 years of age or older and 34 percent will be 50 years or older.5 This aging of the RN workforce can have serious implications for an increasingly demanding hospital nursing practice. It also reduces the ability of the RN to perform certain physical tasks. By starting later in life, lifetime years of service also are truncated.
The age at which persons enter nursing, the characteristics of persons taking the basic education preparation for nursing, and other personal factors, can all factor into the rising age of RNs. The average age at which persons enter nursing practice (that is, the age at graduation) has been increasing for each type of RN entry program. The average age at graduations was 30 years in 1992 compared to 23 years in 1988. In 1992, many of the RNs had worked as LPNs or NAs or had worked in a health care occupation immediately prior to entering a basic nurse education program. Twenty-nine percent of RNs in 1992 had worked in a health care occupation immediately prior to entering a nursing education program. The
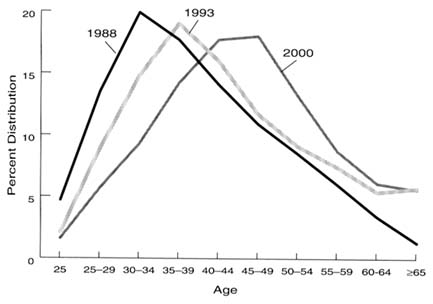
FIGURE 4.2 Age distribution of employed registered nurses (RN), United States, 1988, 1993, and 2000. SOURCE: Moses, 1990, 1994.
majority of this group, 63 percent, had worked as NAs, and nearly 29 percent had worked as LPNs. This group of persons, particularly those who had worked as LPNs, tends to take the educational path of the 2-year associate degree (AD) program (Moses, 1994).
A number of persons are entering professional nursing practice for the first time who have a post-high school degree, and sometimes work experience, in a different field. This number has increased in recent years. The implications of this increase in the number of second-career nurses in the workforce is yet to be fully experienced.
Educational Preparation of RNs
According to the 1992 National Sample Survey of Registered Nurses, 31 percent of employed nurses in all health care settings had a baccalaureate degree in nursing, 31 percent had an AD in nursing, and 30 percent were graduates of diploma programs. Between 1980 and 1992, RNs with ADs in nursing showed the greatest increase; RNs with baccalaureates also showed a substantial growth. Two-thirds of all employed nurses were in staff positions in hospitals. The majority of employed RNs providing direct patient care in noninstitutional settings had less than a baccalaureate degree. For all health care settings taken together, in 1992 half of the top managers and 60 percent of the midlevel manag-
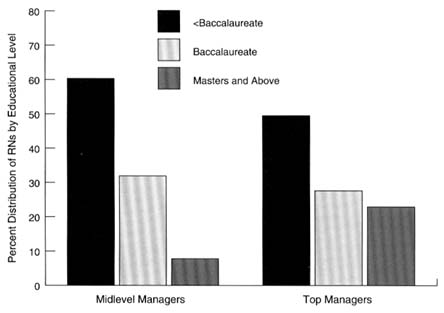
FIGURE 4.3 Highest educational preparation of registered nurses (RN), United States, 1992. SOURCE: OASH, 1994.
ers in nursing had less than a baccalaureate degree (Moses, 1994; OASH, 1994) (see Figure 4.3). Many experts have expressed concern that the continuing trend toward associate degrees may result in a nursing workforce that does not have the knowledge and skills necessary to meet the demand for broad-based skills that will occur in a restructured health care system.
The total number of nursing education programs that prepare RNs has remained around 1,493 during the past decade. In 1993, there were 507 baccalaureate programs, 857 associate degree programs, and 129 diploma programs. Enrollment has been increasing in the basic nursing programs since its low point in 1987, especially in the AD and the basic baccalaureate programs. The number of students who graduate is also increasing. Between 1992 and 1993 the rate of increase was 9.0 percent. This rate is down from nearly 12 percent between 1991 and 1993. In terms of absolute numbers, AD programs are graduating almost twice the number of baccalaureate and diploma graduating students combined (OASH, 1994). However, the rate of growth in graduations from AD programs from 1992 to 1993 is slightly lower than the rate for 1991 to 1992 (See Table 2.12 in Part II of this report). Figure 4.4 shows the trend in graduations by type of basic nursing education programs. The number of new graduates represents the potential increase in nurse supply. With the current increase in basic baccalaureate enrollment, graduations from these programs should increase in the future.
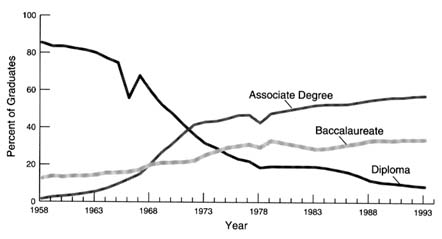
FIGURE 4.4 Percent of registered nurse graduates by type of educational program, United States, 1958–1993. SOURCE: National League for Nursing, Nursing Datasource: Trends in Contemporary Nursing Education, 1981–1994.
Data from NLN for 1994 indicate that graduates from basic nursing educational programs in the academic year 1993-1994 totaled 94,870, an increase of 7.6 percent over the 88,149 graduates in 1992-1993. While increases over the previous year were noted for all three types of programs, the baccalaureate programs showed a far larger increase than associate degree and diploma programs—18.3 percent. Total first-time enrollments for the academic year 1993-1994 also showed some increase over the prior academic year. The total first-time enrollments were 129,897, 2.4 percent more than the 126,837 in 1992-1993 (NLN, 1995).
Total enrollment for the fall of 1994, however, decreased. As of October 1, 1994, 268,350 students were enrolled in basic nursing educational programs, compared to 270,228 in 1993. Baccalaureate program enrollments showed a 1.8 percent increase, from 110,693 in the fall of 1993 to 112,659 in 1994. Total enrollment in both AD and diploma programs declined.
Licensed Practical Nurses
In the health care delivery system, the LPN provides a level of service between the NA and the RN. Their scope of practice does not allow LPNs to assess and formally plan for care. The 12- to 18-month preparation period focuses primarily on skills such as basic bedside nursing in order to provide direct care under the supervision of an RN.
About 1,100 programs prepare students for licensing as LPNs. The vast
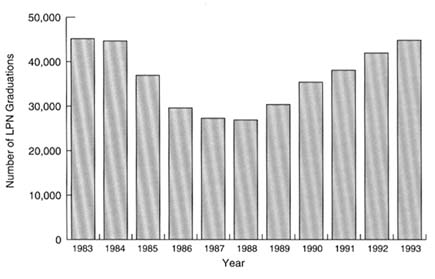
FIGURE 4.5 Number of licensed practical nurse (LPN) graduations, United States, 1983–1993. SOURCE: NLN, 1994b.
majority of these programs are supported by public funding. This funding is very similar to that for AD programs, where 88 percent were publicly funded, compared to 51 percent of basic baccalaureate programs for RNs and 23 percent of diploma programs. Most of the LPN programs are administered by technical or vocational schools. More than two-thirds of the programs in the West were found in junior or community colleges. These are typically 12 months in length (NLN, 1994b).
Annual admissions reached 60,749 in 1993, an increase of 4.3 percent from 1992, and the highest number of admissions in 10 years. Again, LPN admissions were second only to admissions to AD programs. The data also reflect an increase in number of graduations for the fifth consecutive year (see Figure 4.5).
LPNs are the second-largest group of licensed health caregivers in the United States; only RNs are greater in number. They work in hospitals, nursing facilities, home health care, public health and school health clinics, the military, and prisons. Approximately 679,000 LPNs are employed throughout the health care industry, with 262,000 employed in hospitals and 182,110 in nursing facilities (BLS, 1995c). (See Table 4.3 and Table 2.15 in Part II of this report.) In the hospital setting, the LPN functions primarily under the direct supervision of an RN. The LPN employed in the nursing home setting often serves in the capacity of charge nurse. Primary responsibilities include supervising the care being provided by NAs, passing medications and doing treatments, and directly monitoring resident conditions. In either case, the LPN functions under the direction
TABLE 4.3 Number of Full-Time and Part-Time Employees in Hospitals and Nursing Homes, United States, Selected Years, 1988–1994
|
|
Year |
Percent Change 1988–1994 |
|||
|
Health Care Setting |
1988 |
1990 |
1992 |
1994 |
|
|
Hospital |
|||||
|
Registered nurse |
1,039,901 |
1,114,220 |
1,201,650 |
1,203,161 |
15.70 |
|
Licensed practical nurse |
290,780 |
279,775 |
261,909 |
262,238 |
-9.82 |
|
Nurse assistant |
290,070 |
300,590 |
305,624 |
306,009 |
5.49 |
|
Nursing home |
|||||
|
Registered nurse |
86,735 |
93,121 |
96,740 |
109,146 |
25.84 |
|
Licensed practical nurse |
136,662 |
147,667 |
160,663 |
182,116 |
33.26 |
|
Nurse assistant |
553,420 |
595,018 |
639,161 |
643,080 |
16.20 |
|
SOURCE: Bureau of Labor Statistics, Industry-Occupation Matrix. |
|||||
of an RN responsible for assessment. The LPN may also serve as the person implementing care as directed in the patient's care plan. According to a survey of newly licensed LPNs, 39 percent work in hospitals and 49 percent work in long-term care facilities. This is in contrast to newly licensed RNs whose first place of employment is overwhelmingly the hospital (NLN, 1994a).
As seen in Table 4.3, LPN employment in hospitals has been declining. At the same time, LPN employment grew slightly in other industries, particularly in long-term care and home health care settings (BLS, 1995c).
Nurse Assistants
The Bureau of Labor Statistics estimates that in 1994, there were approximately 1,259,100 persons working as nurse assistants or aides in the United States. Of these, 306,000 were employed in hospitals and 643,080 in nursing homes. Unemployment rates for nurse assistants were much higher than for LPNs and RNs. Tables 4.1, 4.2 and 4.3 show trends in the employment of NAs in hospitals and nursing homes from 1983 to 1994.
About 17 percent of the nurse assistants are less than 25 years of age and 44 percent are 35 to 54 years old. The proportion of NAs who are black has not changed much over the years; 29 percent of NAs are black compared to 10 percent of RNs and 19 percent of LPNs. Nearly 18 percent of the NAs had not graduated from high school, and about one-half (46 percent) had a high school diploma. The educational level of NAs working in nursing homes is lower than that of NAs working in hospitals (BLS, 1995c).
Changing Demand For Nursing Personnel
Employment Settings
Hospitals
The hospital has been, and still is, the first place of employment for the majority of RNs. Most of the increases in RN supply over the years have been absorbed by hospitals, where historically about two-thirds of the RNs have worked. Hospitals employed 874,000 RNs in 1993 compared with 698,000 in 19836 (see Table 2.9 in Part II of this report). As stated earlier, the number of RNs employed in hospitals began to increase rapidly following the advent of Medicare in the 1960s and the consequent expansion of the hospital sector. It has continued to grow ever since. As mentioned in Chapter 3, after implementation of the Prospective Payment System (PPS) for Medicare patients, hospital employment levels in the initial years declined along with associated declines in inpatient occupancy rates and discharge rates and a reduction in the average length of stay (HRSA, 1993).
By 1986, however, despite continued decline in inpatient use, hospital staffing began to rise, especially for more highly trained workers. At the same time that hospitals were reducing their nonnursing staff, RN employment continued to increase (HRSA, 1993) (see Figure 4.6). Hospitals began to restructure the composition of the nursing workforce, often substituting RNs for LPNs and other patient care personnel. The increased demand for RNs in large part resulted from a substitution of RNs for LPNs, NAs, and other patient services personnel. Several factors contributed to this continued demand for RNs while other hospital employment was decreasing. Some have suggested that more RNs were needed because of the changing inpatient case-mix after PPS was implemented. Patients who entered the hospital were sicker than in previous years and the average length of stay was shorter, increasing the need for more highly trained workers to administer the procedures, treatments, and care needed. Since 1980, hospitals have increased staffed beds in intensive care units to allow for the increased acuity of the patients. However, Aiken and Hadley (1988), using regression analysis, found that the additional requirement for RNs resulting from more patients in ICUs was offset by the reduced inpatient caseload.
The changing case-mix of inpatients was not the only factor affecting increased employment of RNs, given the magnitude of the increase in RN employ-
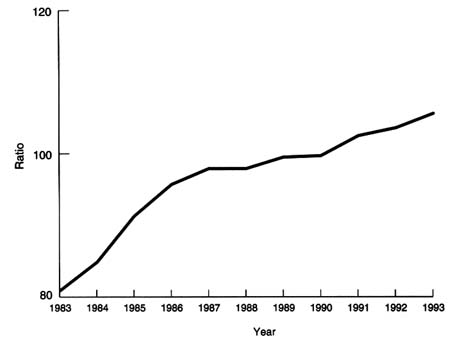
FIGURE 4.6 Ratio of registered nurse full-time-equivalents (FTE) per 100 adjusted average daily census, United States, 1983–1993. SOURCE: American Hospital Association, Annual Surveys, 1983–1993, special tabulations.
ment relative to the patient caseload. The RNs' relative wages during the 1970s and early 1980s also explains the hospitals moving toward a reduced workforce with a richer nursing mix. The widespread substitution of RNs was feasible because the wage difference between LPNs and RNs during the 1970s had narrowed and by the 1980s the average LPN salary was 73 percent of the RN salary (Aiken and Hadley, 1988). This difference was not large enough to be a disincentive for the substitution of RNs, considering that the LPN's scope of practice is more limited and they need supervision by RNs.
Hospitals have increased the aggregate numbers of RNs employed as well as the ratio of RNs to patients. By 1993, around 874,000 RNs were employed in community hospitals throughout the country. Although this number reflects a continuing increase over previous years in the total number of RNs employed and in the number of RNs as a percentage of the total nursing staff (67.5 percent), the rate of increase between 1992 and 1993 was lower than in previous years. (Wide variations reflecting local conditions are noted in the rate of growth across the country.) The annual rate of growth between 1992 and 1993 in the aggregate
TABLE 4.4 Percent Change in Nurse Staffing in Community Hospitals, United States, 1994–1995
numbers of RNs employed as well as the ratio of RNs to patients showed some signs of slowing down (see Table 2.9 in Part II of this report).
However, preliminary unpublished data from AHA's National Hospital Panel Surveys comparing the first quarters of 1994 and 1995 show a substantial percentage increase between 1994 and 1995 in the employment of RNs in hospitals, along with an increase in inpatient admissions (see Table 4.4).
Shift in Service Settings
Although the majority of nurses continue to work in hospitals, major shifts in nursing are taking place as a result of continuing cost pressures, the growth of managed care, and scientific and technological advances. As discussed in Chapter 3, the focus of health care is shifting away from nursing at the hospital bedside to nursing at the patient's side in a continuum of care (see Figure 4.7). The 1992 National Sample Survey of Registered Nurses found a greater number and proportion of RNs working in a variety of settings, notably ambulatory care, than in previous years. The largest increase in the rate of growth between 1988 and 1992 was in the outpatient areas. The rate of growth was about 15 percent for RNs working in community and public health settings. The growth in this service sector is largely due to the growth in home health care. Ambulatory care accounted for an 8 percent increase in the RN workforce. Even within the hospital setting, nurse employment in outpatient departments grew much faster than in inpatient units (Moses, 1994). The increase in employment in outpatient departments of hospitals is not surprising because outpatient admissions show a substantial growth. Despite this increase, however, in absolute terms the largest numbers of RNs by far are still working in inpatient settings of hospitals.
Although opportunities for the employment of RNs in settings other than the
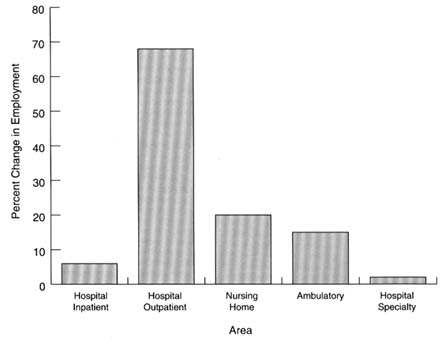
FIGURE 4.7 Percent change in registered nurse employment in selected areas, United States, 1988–1992. SOURCE: OASH, 1994.
hospital have grown in recent years, the absolute number of RNs employed in hospitals has continued to increase. Despite reports of layoffs and downsizing in hospitals and increases in other service settings, hospitals continue to be the first place of employment for a majority of nurses. Over the years the majority of newly licensed nurses have worked in hospitals. This trend continued in 1994, although there was a decline compared to previous years. A national survey of over 61,000 newly licensed RNs conducted in the spring of 1994 by the NLN found that 81 percent of newly licensed nurses were employed in staff positions in hospitals compared to over 90 percent in 1992, and 92 percent in 1990. The 1994 NLN survey also showed that the proportion of newly licensed RNs employed in nursing facilities was rising—11 percent compared to 5 percent in 1992. These results indicate a shift in the first place of employment for RNs, but they have little impact on the total supply of employed RNs; newly licensed nurses represent about 4 percent of the total employed RN workforce (NLN, 1994c; personal communications with E. Moses, Division of Nursing, Public Health Service).
Nursing Homes
Recent data suggest that there might be a slight increase in RNs in nursing facilities. In 1992, nursing homes accounted for about 7 percent of the RN workforce, up from 6.6 percent in 1988 (Moses, 1990; 1994). This increase may be a result of several factors, including the 1987 Nursing Home Reform Act, which requires 24-hour coverage by licensed nursing personnel; the growth of subacute care and special care; and more recently possibly, the reported downsizing and layoffs of RNs in hospitals. Most of these relatively small numbers of RNs working full time in nursing homes do not provide direct nursing care. More than 87 percent of RNs working full time in nursing homes serve as head nurse, assistant head nurse, director of nursing, or assistant director of nursing. Yet most RNs in nursing homes were prepared in a diploma or AD program. The highest nursing-related education for the majority of RNs working in nursing homes was a 3-year diploma program. Less than 3 percent of the RNs working in nursing homes had their master's degree in 1992. RNs working with the elderly tend to be older than the average RN, with a median age of 45 years, and the majority had been working in the profession for 10 years or more (Moses, 1994).
Given the projected growth of the elderly population, long-term care would appear to be an area for growth in RN employment. With the emergence of rehabilitative services in nursing homes and an increasingly complex case-mix, the need for professional nursing is much greater now, and will be in the years ahead, than ever before. It is unlikely, however, that the country will witness any major movement of experienced RNs from hospitals to nursing facilities. As long as long-term care is almost totally dependent on public and out-of-pocket financing, the current paucity of RNs employed in nursing homes will likely continue for fiscal reasons and because of pay differentials between the RNs employed in hospitals and nursing homes.
Implications of Current Trends
The trends in RN employment discussed above suggest that a continuation of the current trend toward reductions in inpatient hospitalization rates and hospital occupancy rates could have important implications for the employment of RNs in inpatient hospital settings. The full impact of these and of further changes that will be brought about by the continued rapid restructuring of the health care system and the growth of managed care may not have been fully felt yet. The relatively small proportion of the total number of RNs employed in settings other than hospitals, even with the recent dramatic growth in those other settings, also means that very large proportional increases in these employment opportunities would have to take place in order to absorb even a modest decline in hospital employment (Yordy, in press). Moreover, some groups of RNs are likely to be disproportionately affected. Researchers in the field have questioned whether the
educational preparation, experience, and skills of many hospital-based staff nurses can be applied in other settings without substantial retraining (Aiken, 1994; McBride, Part II of this report7).
As stated earlier in this chapter, a consequence of the reductions in inpatient admissions and lengths of stay is the increasing complexity of care of inpatients. Such changes have implications for nursing resource requirements. The increased acuity of patients, combined with shortened lengths of stay and technologically driven services, would suggest a need for high ratio of RNs per patient, and this appears to have been the trend until now (AHA, 1995a,b). At the same time, hospitals will not be able to continue to absorb ever-increasing numbers of RNs.
Although hospital employment has continued to grow, some have expressed concern that in recent years most of the growth has been in the nonclinical areas. Anderson and Kohn (in press) examined trends in hospital employment in the period 1981 to 1993. The authors define clinical staff to include all professional staff, nursing staff, technicians, and trainees. Nonclinical staff includes all administrative staff, including administrators, assistant administrators, and medical records administrators, and other personnel who do not fit into the clinical category. Using the Medicare case-mix index as a proxy for adjusting for changing case-mix, they found that employment growth in hospitals during the period of the study increased more rapidly in the nonclinical areas than in the clinical areas. They found no statistically significant difference in the employment growth in states with high and low penetration by health maintenance organization, nor in states with and without all-payer rate-setting programs.
Anderson and Kohn (in press) state that the results must be viewed with caution as the data are not adjusted for the differences in hospital output. The hospital product has changed during the study period, and some of the expansion of the administrative staff may have resulted from responses to the changing health care environment, such as marketing for managed care contracts and developing networks and staff needed for new technology. However, the precise extent of changes in nursing and nonnursing resource requirements cannot be reliably estimated from available data. Likewise, the cumulative effect of such changes may differ when compared across all diagnosis-related groups (DRG) and for non-Medicare patients. Medicare case-mix is only an approximation of the change and it is not clear how much of the annual change in the index is due to real case-mix complexity and how much is a result of increased sensitivity of these measures. Moreover, ProPAC (1995), in its analysis of the annual case-mix change, reported that the total real case-mix and the within-DRG case com-
|
7 |
The Institute of Medicine (IOM) committee commissioned this paper from Angela McBride. The committee appreciates her contributions. The full text of the paper can be found in Part II of this report. |
plexity change for PPS admissions has been decreasing over time (from 1.8 percent in 1987 to 1.0 percent in 1995 and from 0.5 percent in 1987 to 0.2 percent in 1995, respectively). In addition, the shift of less complex cases to the outpatient setting has slowed, reducing increases in the complexity of hospitalized patients.
Salaries
''Nursing has long ignored the obvious point made by economists that high salaries and continued high growth in new jobs are not compatible trends over the long run" (Aiken and Salmon, 1994, p. 319). After a period of low wages in the 1970s and early 1980s, RN salaries have been increasing in recent years. Under continuing pressures to reduce costs, the demand is showing some signs of a slow down. RN salaries rose an average of 33 percent (adjusted for inflation) from 1980 to 1992 (OASH, 1994).8 Earnings of RNs grew faster than overall earnings in the economy from 1987 through 1992 (see Figure 4.8).
In 1992, the average annual salary for RNs employed on a full-time basis was $37,738. This increase occurred at a time when growth in real incomes for many Americans had stagnated or declined. Nurses in staff-level positions earned an annual average salary of $35,212. Wide variations were noted across geographic areas, ranging from more than $41,000 on the Pacific area, to about $31,500 in the Midwest. Nurses with specialized training earn substantially more than the average. Nurse anesthetists earned on average more than $76,000 in 1992, and nurse practitioners and nurse midwives earned $44,000 a year (Moses, 1994). These increases in salary levels may have also attracted more people to the field of nursing in recent years.
Labor costs account for a major proportion of hospital costs. When hospitals face pressures to cut costs, the usual target is labor. Increasing salary levels, combined with the increasing size of the RN workforce, have made RN employment a large and expensive cost center in the health care system. It would not be surprising then, in the current environment of cost containment, if RNs have become a target for cost cutting. Hospitals are reported to have restructured patient services and staffing, reducing RNs as a proportion of total nursing personnel and increasing the employment of ancillary nursing personnel (SEIU, 1993; ANA, 1995a). The committee heard from many RNs and received testimony suggesting that cost reductions are being achieved through RN layoffs, attrition, productivity increases with fewer staff doing more, substitution of lower-cost personnel, or a combination of the above.
Yordy (in press) suggests that under these circumstances, RNs may have to
|
8 |
These figures are averages across all settings. Nursing home salaries are lower than the average and lower than the salaries for hospitals. See Chapter 6 for elaboration of the issue. |
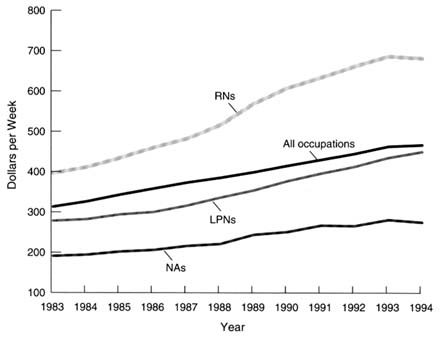
FIGURE 4.8 Median weekly earnings of nursing occupations, United States, 1983–1994. NOTE: LPN = licensed practical nurse; NA = nurse assistant; RN = registered nurse. Earnings are for wage and salaried workers who usually work year-round full time. There was a change in the survey beginning in 1994.
SOURCE: Bureau of Labor Statistics, Current Population Surveys.
make choices and trade-offs with regard to future salary demands and job security. They may have to choose lower salaries or increased productivity with fewer jobs. The committee, however, heard many complaints from RNs employed in hospitals that they are already stressed by overwork because of reduced staff. If that is an accurate portrayal of the situation in hospitals, then one of the choices mentioned above disappears, at least for RNs employed in inpatient hospital service.
A major determining factor in hiring a worker is the cost of hiring that worker compared to the alternatives. In a cost-competitive system, persons with the lowest level of training who can do the job are employed, under the assumption that higher training leads to greater compensation. This could mean that nurses with less training are losing positions in the inpatient hospital sector to nurse assistants and other ancillary nursing personnel, while those with advanced training may be able to find new opportunities.
Is The Supply Adequate For The Demands Of The Next Century?
As discussed in Chapter 5, in the years ahead RNs will be called upon to fill roles that will require increased professional judgment, supervision and direction of work of others, management of complex systems that span the traditional boundaries of service settings, and clinical autonomy. Clearly a strong education base will be required to provide RNs with the needed preparation for their expected future roles in various settings.
In the future, the RN's role will likely involve greater responsibility for patient care and the management of complex systems of care that span the boundaries of institutions. Career opportunities will open in health promotion and clinical decision making as nursing moves toward community-centered practice.
Hospitals are no longer bastions of acute care, with only inpatient units devoted singularly to the care of the ill. They are increasingly a part of a larger network of services. Thinking, acting, and planning for the continuum of services are critical in today's hospital environment, calling for a workforce that is prepared to provide services in a proactive, highly competent, and holistic manner.
Continuation of the trend toward reductions in hospital inpatient admissions and the corresponding shift of employment to ambulatory and community care settings raise questions about the adequacy of educational preparation of future RNs. The baccalaureate degree curriculum has included the necessary training for practice in ambulatory and public health and other community settings as well as clinical experience. Hence, it has long been held as the standard credential for practice in those settings (Aiken, 1994; see McBride, Part II of this report). Demand for RNs to practice in ambulatory care and community-based settings will increase.
Likewise, not all nursing homes today are single-focus settings taking care of chronically ill patients who require mostly custodial care. These settings, once nearly forgotten in most serious discussions about health care, are now becoming the hospital substitute for much of the traditional acute care patient population. With an increased emphasis on providing subacute care as well as rehabilitative care, nursing homes are attempting to provide transitional institutional services that, in the past, would have been provided in the acute care inpatient setting.
Thus, in each of these care settings, consideration needs to be given to the effectiveness of the current workforce for the future. Changes such as those described above and elsewhere in this report require a full examination of the education and skills needed by those delivering care and services. This is not simply an issue of redeploying workers from one setting to another; the required knowledge and skills differ.
These scenarios raise serious concerns about the growing community college
nursing programs designed to prepare nurses primarily for inpatient staff positions. In the future, RNs' roles will require that they exercise more professional judgment and clinical autonomy. In order for RNs to function effectively in a boundary-spanning, interdisciplinary health care system, they will require a new approach to the basic educational preparation of future RNs and some fundamental retraining of those adversely affected by hospital downsizing.
There is general agreement in the nursing community, and within health care in general, that workforce needs and projections for the future must be evaluated. Two questions are central to the deliberations: (1) Do we have an adequate number of nursing staff? and (2) What knowledge and skills should these nurses have?
In assessing the adequacy of the supply of registered nurses to meet the anticipated needs for health care in the twenty-first century, several researchers have conclude that the aggregate quantity of registered nurses in the United States is adequate to meet national needs, at least for the near future, but their educational mix may not be adequate to meet either current or future demands in a rapidly changing health care system (Aiken and Salmon, 1994; see McBride, Part II of this report). Workplace settings are changing rapidly and dramatically. This situation calls for continuous review of the education, training, and retraining needed by those in direct and indirect care giving functions. The committee also notes that with a changing health care system, and the consequent changes needed in the education and training of nursing personnel, a thorough evaluation of the current funding of training may be necessary to determine if any redirection is needed.
Nursing Education and Training for the Future
The findings of the Pew Health Professions Commission, related to practitioners needed for the year 2005 and their education, provide a framework for the development of a strategic direction for the future workforce. The issues of formal educational needs are well articulated in numerous publications of this commission beginning with Healthy America: Practitioners for 2005 and Health Professions Education for the Future: Schools in Service to the Nation, and in the abundance of professional literature that has surfaced over the last few years (McBride, Part II of this report).
The knowledge and skills of all health care professionals require advancement in this rapidly changing health care delivery system. The following general areas are discussed in relation to basic professional nursing education: interdisciplinary education and team approaches to care; management of care, including attention to health care costs, professional accountability, and patient outcomes; new modes of care delivery, including community-based care, managed care, and home care. Lastly, some of the changes needed in advanced practice nursing programs are described.
Interdisciplinary Team Care
At this time, the interdisciplinary education of health care workers from different disciplines is the exception rather than the norm. Yet interdisciplinary team approaches to patient care could potentially lead to better patient outcomes (see Chapter 5 for further discussion of interdisciplinary teams). Although the value of interdisciplinary education for RNs and physicians has been espoused for the past three decades, examples of highly effective programs are rare. Changes in the delivery of health care will require nurses prepared to function effectively as members of the health care team. Necessary changes in the educational programs include a need for educational content on collaborative practice, shared decision making, team building, and team practice. In designing such collaborative educational programs, it will be important to transcend the barriers that currently exist. The literature is rich with descriptions of the obstacles to interdisciplinary education, including, for example, differences in the educational levels of learners and difficulties in coordinating schedules. Collaborative clinical experiences with preceptors who are supportive of interdisciplinary team care are just as important as shared classroom teaching and learning.
Management of Care
Professional nurses have long been taught to be managers of their individual patient's care and, to a lesser extent, managers of a team caring for the patient. Future demands will require a greater emphasis on professional productivity and accountability for the care of groups of patients, with particular attention to the relationships between quality and cost of care. Health care students will benefit from courses in information management, health care finance, and system design and functioning. As patient outcomes have assumed a prominent role in research, health care practitioners will be expected to understand the research and base their therapeutic approaches on the most effective interventions.
New Modes of Care Delivery
As the health care delivery system continues its transformation toward community-based care, with managed care as a prominent organizational mode, professional nurses must be prepared to assume leadership roles in delivering care delivery within these new settings. Although the majority of clinical experiences that are part of nursing education currently take place in the inpatient hospital setting, a major shift in the primary site for clinical education is expected. In fact, there is evidence that many schools are changing their curricula and clinical learning experiences to match the pace of changes in the design of delivery systems. Home care, managed care, and community-based care models have
received renewed attention, although public health nursing has always been a required component of baccalaureate nursing education.
At the core of the needs for future preparation of professional nurses is the requirement to continue to strengthen clinical decision making and clinical judgment skills. RNs will be called on to provide comprehensive care to a larger numbers of patients with more complex health situations. It is imperative that they be prepared for the complexities of patient care that they will confront.
Advanced Practice Nurses
Prepared as specialists in a clinical content area or generalists for primary care, advanced practice nurses (APN), including nurse practitioners, clinical nurse specialists, nurse midwives, and nurse anesthetists, require a firm foundation in the content areas identified above. Further, there may be some knowledge and skills of particular relevance to their specialty practice that would require even more depth in a particular area. The program content for APNs is currently being reviewed by specific accrediting bodies.
In summary, while there may not be total agreement on the adequate number and mix of type of nurses, there is general agreement that the preparation of both the current and the future nursing workforce must be enhanced.
Differentiated Practice
McBride (Part II of this report) has delineated the current and future issues of professional nursing education, indicating several major challenges that clearly need to be addressed if we are to see an appropriate use of professional nursing services in a restructured health care environment. Her call for differentiation of the RN workforce is supported by the work of Aiken (1994, 1995) and others (Koerner, 1992; Larson et al., 1994; Oermann, 1994a,b).
Differentiated practice using "care partners" appears to be the major restructuring activity that has occurred in 1994 and 1995. According to McBride (Part II of this report), the RN skill mix (that is, the proportion of RNs to other nursing staff) appears to be dropping in many settings, from a range of 76-100 percent to a range of 52-79 percent: "Cost effective care requires all health care providers to avoid duplication of effort and to make full use of the best, least expensive caregivers according to need." While these changes lead to uncertainties and concerns about job security for some, multiple career opportunities will continue to abound for those RNs skilled in health promotion and clinical decision making, and knowledgeable about community resources and the integrated delivery of care.
Throughout the site visits and in oral testimony, the committee heard of the need for more assessment of the capabilities of other care givers, along with the need for training in delegation and supervisory skills, which some RNs believed
were currently inadequate for their evolving roles. Many RNs admitted to feeling unsure of their skills and ability to function effectively in these areas. On site visits where successful care partner programs were in place, the committee was informed that in preparation for this type of restructuring considerable time needs to be spent on assessment, delegation, and supervision.
Education must move to an interconnected system of distinct educational levels with differentiated outcomes and a model of differentiated nursing practice should be adopted (McBride, Part II of this report). Aiken (1995) stated that nursing as a profession was producing too many AD graduates and too few baccalaureate and higher-degree nurses to meet future needs. Clifford (1990) has noted that with the health care delivery system being increasingly primary care oriented and boundary spanning, the roles in which nurses will be needed will require more professional judgment and clinical autonomy.
Summary
This chapter has addressed critical issues affecting the nursing workforce, its supply, and the forces affecting its demand. The committee has grappled with the implications of the nature of the current supply of nursing personnel, not just in terms of numbers of RNs, LPNs, and NAs, but also in terms of the distribution of its educational preparations and of the knowledge and skills required in a restructured health care system.
Rapid changes in the health care sector are creating an environment of uncertainty leading to concerns about job security. At the same time, new opportunities for nursing are being created, often away from the traditional inpatient hospital setting. These opportunities will work to the benefit of some and will adversely affect those who do not have the skills and training to move into new types of work. These are major issues of great relevance for the delivery of health care in the twenty-first century. Achievements in scientific and technological advances have made our health care system one of the best in the world and the quality of the health workforce is closely related to the success of the health care system. The committee recognizes that these issues are beyond the scope of its study and cannot be addressed adequately here. It therefore strongly urges the profession of nursing, policymakers, and leaders in the field of health care professions to address these issues comprehensively and decisively so that the country has an adequate nursing workforce in terms of numbers, distribution, and educational mix to provide care in a restructured health care system. The committee also notes that with a changing health care system, and the consequent changes needed in the education and training of nursing personnel, a thorough evaluation of the current funding of training may be necessary to determine if any redirection is needed. For a detailed discussion of federal funding support of nursing education, see Aiken and Gwyther, 1995.


