
2
Racial and Ethnic Differences in Mortality at Older Ages
Irma T. Elo and Samuel H. Preston
Introduction
This paper evaluates evidence regarding racial and ethnic differences in mortality in the United States. In keeping with the theme, we emphasize mortality at older ages; specifically, we deal with ages 45 and above and attempt to extend the analyses to ages 100 and older. We focus on recent estimates rather than attempting a broader historical overview. We give our main attention to mortality rates from all causes combined, although we refer to studies of racial and ethnic differences in mortality by cause of death in a later section.
We deal with four major groups: African Americans, Hispanic, Asian Americans and Pacific Islanders, and whites (or, on occasion, non-Hispanic groups). The analyses are organized by type of data sources available: vital statistics/census-derived rates, linked data files, and extinct generation methods.
Vital Statistics And Census Data
African Americans and Whites
Mortality estimates for whites and African Americans based on vital statistics and census data have consistently shown black death rates to exceed white rates until some age above the mid-seventies; at that point, black death rates have historically "crossed over" white rates and have declined relative to white rates thereafter. In Table 2-1 and Figures 2-1 and 2-2, we show estimates of age-specific death rates by 5-year age groups above age 45 for African Americans and whites (as well as for Asian/Pacific Islanders and Hispanics) in 1989. The rates
TABLE 2-1 Death Rates Based on Vital Statistics and Census Data: Whites, African Americans, Asian/Pacific Islanders, and Hispanics, 1989
are obtained in a conventional manner, using 1989 deaths from vital statistics in the numerator (National Center for Health Statistics [NCHS], 1993) and the Census Bureau's estimates of population on July 1, 1989, in the denominator (Hollman, 1993).1 The crossover to lower African-American mortality occurs in the age interval 85 to 89 for males and 90 to 94 for females. At younger ages,
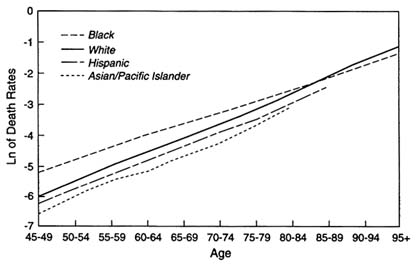
FIGURE 2-1 Death rates, white, African-American, Asian/Pacific Islander, and Hispanic females, 1989. SOURCES: Based on data from National Center for Health Statistics, 1993; Hollman, 1993; 1989 NCHS Mortality Detailed Data Tape.
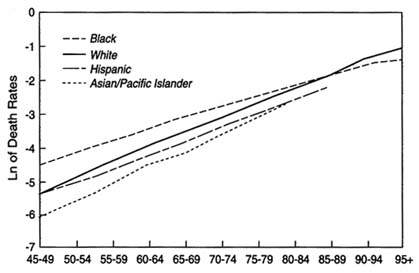
FIGURE 2-2 Death rates, white, African-American, Asian/Pacific Islander and Hispanic males, 1989. SOURCES: Based on data from National Center for Health Statistics, 1993; Hollman, 1993; 1989 NCHS Mortality Detailed Data Tape.
age-specific death rates for African Americans exceed white rates by as much as two to one, and there is a gradual, but steady, narrowing of the differential as age advances (Table 2-1 and Figures 2-1 and 2-2). Throughout the 20th century, black-white mortality differentials have been characterized by the occurrence of the greatest relative disadvantage for blacks in middle age, followed by a slower rate of increase in black death rates relative to white rates.
Many observers have attributed the crossover to the ''survival of the fittest," suggesting that adverse conditions faced by African Americans at younger ages subject the weakest members of a cohort to high mortality with only the most robust reaching old age (e.g., Jackson, 1980; Markides and Mindel, 1987; Otten et al., 1990; Manton et al., 1991; Zopf, 1992). Manton and others have further formalized this notion into arguments involving unobserved heterogeneity (Manton and Stallard, 1981; Manton et al., 1981, 1987). These views have dominated much of the literature on mortality of elderly African Americans. Yet evidence from other populations suggests that cohorts who have experienced unfavorable conditions in early life also tend to experience elevated mortality at older ages (Elo and Preston, 1992; Mosley and Gray, 1993).
An alternative explanation for the crossover phenomenon is the poor quality of vital statistics and census data used to estimate African-American mortality, on which much of the evidence for the crossover has been based (Zelnik, 1969; Coale and Kisker, 1986, 1990). Zelnik and Coale and Kisker cite the likelihood that misreporting of age and other forms of error have seriously biased African-American death rates at older ages. The unreliability of age data for older African Americans undoubtedly reflects the fact that many of their births were never registered. Most were born in the South, where few states were members of the birth-registration area before 1920 (Shapiro, 1950).
Substantial evidence exists to support the notion that the misreporting of age is a serious source of bias in estimates of mortality at older ages, particularly among African Americans. The first study to reveal serious inconsistencies in age reporting in vital statistics and census data was the 1960 Matched Records Study, which linked death certificates registered in May to August 1960 to the 1960 Census of Population (NCHS, 1968; Kitagawa and Hauser, 1973). In only 44.7 percent of nonwhite male and 36.9 percent of nonwhite female matched cases was the same age reported in the two sources. Ages reported on the death certificate were systematically younger than those reported on the census record, and discrepancies increased sharply with age and were pronounced even in 5-year age groups. Such inconsistencies were less pronounced for whites than nonwhites; 74.5 percent of the ages agreed in the two sources for white males and 67.9 percent for white females.2 Corrections for age discrepancies in the two
|
2 |
Because African Americans made up 92 percent of the total nonwhite population in the 1960 Census of Population, these results mostly reflect age reporting among African Americans (tabulated from the Bureau of the Census, 1983:Table 4-5). |
sources led to only relatively small changes in the white rates at older ages but substantially increased estimated death rates for nonwhites. The racial crossover in mortality moved from the age interval 75 to 79, based on uncorrected rates, to the last open-ended age interval, 85 and older, after corrections were made for age inconsistencies (Kitagawa and Hauser, 1973:Table 6-1).
More recent evidence of inconsistencies in vital statistics and census data come from evaluations of intercensal changes in cohort size and intercensal deaths. These results for each of the intercensal decades from 1930-1940 to 1980-1990 show increasing amounts of inconsistency between vital statistics and census data for African Americans as age advances (Elo and Preston, 1994). Mortality rates based on these data are likely to be highly unreliable. Similar analyses for whites, on the other hand, have concluded that vital statistics and census data for the most recent decade, 1980-1990, are highly consistent up to age 94, with consistency levels similar to those found in Sweden and the Netherlands, countries with population registers (Shrestha and Preston, 1995).
Coale and Kisker (1990) have suggested that African-American vital statistics deaths from age 65 to age 70 are more numerous than Medicare deaths, but that at ages above 80 they are 7 percent to 10 percent incomplete. They base their conclusion on a comparison of census populations with reconstructed populations inferred from registered deaths. The authors interpreted this finding as a suggestion of possible underregistration of African-American deaths at advanced ages, but the finding is also consistent with greater overstatement of age in the census than in death statistics, a pattern revealed by the 1960 matching study discussed above. Although we have uncovered no studies of possible underregistration of deaths, Shryock and Siegel (1973) assert death underregistration to be less than 1 percent in 1967.
Another potential problem with the use of vital statistics and census data is inconsistency of the reporting of race on death certificates and on the census records. Available evidence suggests that this is not an important issue for African Americans or whites.3 The 1960 Matched Records Study found, for example, that 98.2 percent of African Americans (all ages combined) had the same race reported on the death certificate as on the census record; if we ignore whether the same individual was represented in the two totals, the net difference was only 0.3 percent (NCHS, 1969).4 A more recent study linking records from 12 Current Population Surveys (CPS) with the National Death Index for 1979 to 1985 found a similarly high correspondence in the reporting of race among
African Americans; for 98.2 percent the same race was reported on the death certificate as in the CPS record, with a net difference of 0.4 percent (Sorlie et al., 1992). The consistency in the reporting of race is even higher for whites; in the 1960 study, 99.8 percent of the whites had the same race recorded on the death certificate and the census record (NCHS, 1969), and in the 1979-1985 CPS/death certificate link the agreement for whites was 99.2 percent (Sorlie et al., 1992).
Hispanics
The recent addition of a Hispanic-origin item to death certificates on a state-by-state basis starting in 1978 permits a (nearly) national level calculation of death rates from vital statistics and censuses for Hispanics. Estimated death rates for the self-identified Hispanic population in 1989 are presented in Table 2-1 and Figures 2-1 and 2-2. Because published numbers of deaths for Hispanics are available only in 10-year age categories, we have derived the numerators from a tabulation of the NCHS death files for 1989. Death certificates in which the Hispanic-origin field is classified as Mexican, Puerto Rican, Cuban, Central or South American, or other Hispanic origin are included. Population denominators are based on the Census Bureau's estimates of the Hispanic population on July 1, 1989; Hispanic identification is based on responses to the 1980 and 1990 Hispanic origin questions included in the two censuses (Hollman, 1993). Because Louisiana, New Hampshire, and Oklahoma did not tabulate data on deaths by Hispanic origin (NCHS, 1993:Table 7-7), these states, representing about 1 percent of the older Hispanic population, are excluded from the numerator and the denominator. Hispanic residents of other states who died in Louisiana, New Hampshire, or Oklahoma are also necessarily excluded from the numerator in the calculation of death rates. The number of Hispanic deaths may thus be slightly underestimated and may lead to a small downward bias in the death rates shown in Table 2-1.
Except for males aged 45 to 49, death rates for the Hispanic population are below those of the white population for both sexes at all ages. The proportionate gap between Hispanics and whites tends to increase with age, so that Hispanic death rates are 26 percent to 30 percent below those of whites at ages 80 to 84 and 85 to 89. Similar differences in Hispanic and white death rates at ages 45 and above are revealed by the mortality estimates, also based on vital statistics and census data, incorporated into the Census Bureau's population projections (Day, 1993). The difference between Hispanic and white rates increases as age advances, with the ratios of Hispanic to white rates declining from 1.02 at ages 45 to 49 to 0.71 at ages 80 to 84 for males and from 0.88 at ages 45 to 49 to 0.72 at ages 80 to 84 for females (Bureau of the Census, unpublished tabulations).5 The
results of Table 2-1 are consistent with Hispanic/non-Hispanic differences in 1979 to 1981 in 15 reporting states; at all ages above 44, Hispanic males and females had death rates below the national average in these 15 states (NCHS, 1990).
The pattern revealed in Table 2-1 is also consistent with earlier analyses of Hispanic mortality at a subnational level. Most of these studies focused on Texas and California, where persons of Mexican origin dominate among the Hispanic group, or on New York, where Puerto Ricans dominate. Rather than using self-identification, the studies identify the Hispanic-origin population either by applying a Spanish surname classification system to deaths and population or by using the identification of place of birth to classify those born outside the United States. Studies using place of birth to identify the Hispanic-origin population sometimes focus separately on Mexican, Puerto Rican, or Cuban-born persons.
One of the most detailed studies compares age-specific death rates of various Hispanic subgroups with those of whites during 1979-1981 (Rosenwaike, 1987). The study uses 10-year age groups up to age 75 and above, and deals separately with persons born in Mexico, Puerto Rico, and Cuba. Of the 24 age, sex, and origin groups for which comparisons with whites are made at ages 45 and older, only 4 show higher death rates for Hispanics (Puerto Rican males at ages 45 to 54 and 55 to 64; Puerto Rican and Mexican females at 65 to 74). Cubans, a relatively high-status immigrant group, show exceptionally low mortality in all comparisons. All three Hispanic-origin groups have lower age-standardized death rates than whites for diseases of the heart, cerebrovascular diseases, and malignant neoplasms, with the exception of heart disease among Puerto Rican women.
Bradshaw and Liese (1991) provide a useful chronological review of studies of Hispanic mortality in the Southwest and California. Most of the studies are based on Spanish surname classifications. In general, studies of relative mortality among older Hispanics since 1950 show older Hispanic males to have lower mortality than older non-Hispanic males. The picture for females is more complex. Early studies usually found older Hispanic females to be at a disadvantage, but this disadvantage has typically been reduced or reversed in more recent years (e.g., Rosenwaike and Bradshaw, 1989). Female Hispanics appear to have made faster progress relative to non-Hispanics than have male Hispanics. This tendency was observed (for all ages combined) in the Hispanic study with the longest historical sweep, an analysis of mortality among people with Spanish surnames from 1940 to 1980 in Bexar County, Texas (San Antonio) (Frisbie, 1991:Table 3:3). If the results in Table 2-1 are correct, Hispanic females have achieved mortality conditions every bit as favorable as Hispanic males.
The question, of course, is whether Table 2-1 is credible. There are several potential sources of error. First, misreporting of age may be a serious problem for Hispanics, as it is for blacks. The only study that we know of that provides direct evidence about age reporting patterns among Hispanics in the United States is a study by Kestenbaum (1992) that linked 1987 death certificates from Texas and
Massachusetts to the Social Security Administration's Master Beneficiary Record File. This study shows that for Hispanics, age reporting in the two sources was more consistent than for African Americans but less consistent than for non-Hispanic whites. At death certificate ages 65 and above, ages agreed for 88.4 percent of Hispanic, 72.6 percent of African-American, and 94.6 percent of non-Hispanic white decedents. At death certificate ages 85 and above, the respective percentages were 81.7 percent, 63.2 percent, and 91.7 percent. Only 21 percent of the Hispanic population aged 65 and older resided in these two states in 1990, and thus the above results may not accurately reflect age reporting patterns among the Hispanic population nationwide (Bureau of the Census, 1992a, 1992b, 1992c). Nevertheless, the results suggest that age reporting problems are more prevalent among Hispanic Americans than non-Hispanic white Americans.
Indirect evidence further suggests that inconsistencies in age reporting between death certificates and census records could lead to biased estimates of Hispanic mortality at older ages. Rosenwaike and Preston (1984) use intercensal methods to compare the consistency of recorded deaths and population counts by cohort in the censuses of 1960 and 1970. Using data on the Puerto Rican-born population from the censuses and vital statistics systems of both the United States and Puerto Rico, they find large inconsistencies at older ages. For example, there were 25 percent too many persons reported at ages 75 and above in the 1970 census relative to the number expected from the 1960 census and intercensal deaths. This inconsistency is much larger than that found using the same basic method on data for African Americans for the same or later periods (Elo and Preston, 1994). Dechter and Preston (1991) demonstrate that these inconsistencies are large and pervasive in Latin America.
An additional problem, not serious for blacks or whites, is a potential disparity between ethnic identification systems used for deaths and for population counts. Rosenwaike and Bradshaw (1988) examine death certificates and coding instructions for vital statistics offices in five states that were using the Hispanic-origin question. They find that the ethnic systems are "demonstrably incomparable" with census systems, especially for subcategories of the Hispanic population.
Fortunately, the Sorlie et al. (1992) study investigates the comparability of Hispanic identification in the CPS and on death certificates for states using the Hispanic-origin question on death certificates. They find net underreporting of Hispanic-origin question on death certificates, but the discrepancy was not large: in a linked file, 600 decedents were identified as Hispanic on the CPS, and 563 death certificates identified an Hispanic origin. Sixty-two people were listed as Hispanic on the CPS but not on the death certificate, and 25 on the death certificate but not on the CPS. The numbers pertain to all ages; no age breakdown is available. The net error of 6.6 percent in the Sorlie et al. study suggests that Hispanic death rates in Table 2-1 should be raised by this amount as a first approximation.
Results are reported only for the matched sample in which Hispanic-origin field is filled out on the death certificate. A failure to report on this field on death certificates may bias estimates of Hispanic mortality computed in the conventional manner. In 1989, for example, information on Hispanic origin was missing on about 3 percent of the death certificates at ages 45 and above.6 In contrast, when the Hispanic-origin field is not filled out on a census form, the Census Bureau uses various imputation procedures to assign a value to the missing data.
The only other linked data set that permits an investigation of the comparability of classifications is the Kitagawa-Hauser (1973) study of U.S. death certificates and 1960 census records. Their only result pertaining to the Hispanic population relates to persons born in Mexico. Correction for inconsistencies in reporting left the death rate unchanged for Mexican-born males and reduced the uncorrected death rate by 2 percent for Mexican-born females. Consistent with results reported earlier, corrected age-standardized death rates for Mexican-born males were 16 percent below those of white natives aged 35 and older in 1960, whereas corrected female rates were 1 percent higher (Kitagawa and Hauser, 1973:104, 106).
Asian Americans and Pacific Islanders
Death rates for Asian Americans and Pacific Islanders as a group in 1989 are shown in Table 2-1 and Figures 2-1 and 2-2. Because published figures for this group are also available only in 10-year age intervals, we have obtained data for the numerators from the NCHS Mortality Detail Files for 1989. The numerator data consist of all deaths that were classified as Chinese, Japanese, Hawaiian (including part-Hawaiian), Filipino, and other Asian or Pacific Islander. Population estimates used in the denominator include persons who reported themselves in one of the Asian and Pacific Islander groups listed on the census form, who wrote in responses specifying one of the Asian countries not listed, or who identified themselves as belonging to one of the Pacific Islander cultural groups. The denominator data are again based on Census Bureau's population estimates for July 1, 1989 (Hollman, 1993).
Mortality among Asian Americans and Pacific Islanders appears to be lower than for any other group shown in Table 2-1. The greatest advantage relative to whites is indicated for males in the age range 45 to 49 to 55 to 59, where the rates for Asian/Pacific Islanders are only about half of the rates for white males. At ages above 75, male rates are still 33 percent to 36 percent below those of white males. The advantage of Asian/Pacific Islander females relative to white females is also substantial; death rates for Asian/Pacific Islander females are 34 percent to
46 percent below white female rates at ages 45 to 49 through 80 to 84, and 30 percent below the white rates at ages 85 and older.
Previous studies based on vital statistics and census data have similarly documented low mortality among Asian Americans. Yu et al. (1985) estimated mortality in 1979-1981 among Chinese, Japanese, and Filipinos, the three largest Asian groups in the United States. No sex-specific tabulations were shown. All estimated rates above age 45, shown for 10-year age intervals, were well below the rates for whites. Filipinos showed strikingly low mortality; death rates for Filipinos were 41 percent to 69 percent below white rates. Except in the final, open-ended age interval, 85 and above, Japanese had lower mortality rates than the Chinese, although both were well below those of whites. Among the Japanese, at ages 45 to 54 to 75 to 84, estimated death rates were 40 percent to 59 percent below white rates; among the Chinese, death rates fell below the white rates by 21 percent to 49 percent. Similar results have been shown for Asian-American males and females in 1979-1981 at ages 45 to 64 (U.S. Department of Health and Human Services, 1985:Figures 6 and 7). In addition, state-level studies from California and Hawaii have shown mortality to be lower for Japanese and Chinese than for white Americans (for a review, see Barringer et al., 1993).
A more recent set of mortality estimates for Asian/Pacific Islanders has been prepared by the Bureau of the Census in conjunction with its population projections (Day, 1993). These estimates pertain to fiscal year 1992. The Bureau's estimates are also based on vital statistics and census data, although the definition of Asian/Pacific Islanders differs from that used in Table 2-1. For the calculation of age-specific death rates, the estimated number of deaths was obtained by subtracting deaths of American Indians, provided by the Indian Health Service, from the deaths of "other races." This procedure was employed because NCHS death data by race were available only for whites, blacks, and other races for the time period of interest. Thus, deaths of the Asian/Pacific Islander population are a residual category once deaths for whites, African Americans, and American Indians are excluded (Day, 1993:xxxvii). The denominator data come from the 1990 census with adjustment for net census coverage error by the use of demographic analyses. The Bureau's estimates also place Asian/Pacific Islander death rates well below those of whites for both men and women. In the age range from 45 to 49 to 80 to 84, the death rates for Asian/Pacific Islander males are 34 percent to 45 percent below white male rates; for females, the relative advantage ranges from 20 percent to 44 percent (Bureau of the Census, unpublished tabulations).
The estimates discussed above, however, must be viewed with extreme caution. The main difficulty in estimating accurate levels of mortality from vital statistics and census data for Asian Americans and Pacific Islanders stems from problems in comparability of race reporting in the two sources. Although most studies that have examined the bias resulting from the lack of agreement in the denominator and numerator data for Asian Americans have focused on estimates of infant mortality (e.g., Frost and Shy, 1980; Yu, 1984; Wang et al., 1992),
Sorlie et al.'s (1992) study, discussed above, covers the entire age range. The discrepancies between the baseline race identification taken from the CPS and the matching death certificate were much larger for Asian/Pacific Islanders than for whites, African Americans, or Hispanics. The agreement for Asian/Pacific Islanders was only 82.4 percent, and the race of the decedent was more often classified as white on the death certificate than on the CPS. No detail by age or sex was available, although the authors noted that "the rates of agreement did not vary much by sex or age group of the decedent" (Sorlie et al., 1992:182). The total number of deaths classified as Asian/Pacific Islander in the CPS surveys was 272 versus 242 on the matching death records, leading the authors to conclude that death rates for Asian/Pacific Islanders calculated from vital statistics and census data are likely to be underestimated by 12 percent (272/242 = 1.12). Even if the Asian/Pacific Islander death rates in Table 2-1 were multiplied by 1.12, they would still be well below those of white Americans.
The only other national-level study that has examined the comparability of race classifications on death certificates and census records for Asian Americans over the entire age range is the 1960 Matched Records Study, discussed previously. In 1960, percentage agreement was high for Japanese (97.0%), somewhat lower for Chinese (90.3%), and very low for Filipinos (72.6%) (NCHS, 1969). Comparable estimates for the same subgroups are not possible from the National Longitudinal Mortality Survey (NLMS). We know of no studies that have examined consistency of age reporting in vital statistics and census data for Asian Americans and Pacific Islanders. However, a strong emphasis on age in East Asian cultures appears to be associated with unusually accurate age reporting (Coale and Bannister, 1994).
The large influx of Asian immigrants since the mid-1960s and the increasing diversity of the Asian/Pacific Islander population as a whole undoubtedly contribute to the uncertainties in the comparability of vital statistics and census data used in the estimates of mortality. Mortality levels are also likely to vary among the Asian/Pacific Islander subgroups and raise questions of the relevance of mortality estimates for the Asian/Pacific Islander group as a whole (Barringer et al., 1993).
Linked Studies
Estimates of mortality based on data sources where information for deaths and population at risk comes from a single file avoid the racial and ethnic classification problems created by dual data sources discussed above. Data sources of this type available for estimating mortality among older Americans are Social Security and Medicare files, the NLMS, and subnational studies.7
Social Security and Medicare Data
We first focus on two studies that have explicitly examined black-white mortality differentials based on Social Security and Medicare data. We then briefly discuss studies of Hispanic mortality. We know of no studies that have used Social Security and Medicare data to estimate mortality among Asian Americans and Pacific Islanders.
Comparisons of death rates based on vital statistics and census data with those obtained from Social Security and Medicare data suggest that conventionally constructed death rates underestimate African-American mortality at older ages. Coale and Kisker (1990) have shown, for example, that in 1980, nonwhite rates calculated from registered deaths and census counts are substantially lower than Medicare rates from about age 82 to age 95 for both males and females. Most ratios of death rates calculated from death registration and census data divided by Medicare death rates for nonwhites fell well below 0.95, while white mortality schedules from the two data sources showed close correspondence up to age 95. Above age 95, however, the mortality schedules for both whites and nonwhites from both sources appeared flawed. The authors' final estimates of mortality showed nonwhite death rates to be above white rates up to age 90, with the estimated rates above age 90 being slightly lower for nonwhites than for whites.
These results undoubtedly reflect inconsistencies between age reporting in Social Security data and on death certificates. Linked studies of death certificates with Social Security Administration (SSA) records have shown particularly large inconsistencies in age reporting for African Americans. The previously cited study by Kestenbaum (1992) based on death data from Massachusetts and Texas found, for example, that only 72.6 percent of African Americans whose age at death on the death certificate was 65 and over had the same age reported in the two sources; for the 85 and older age group, the percentage was even lower, 63.2 percent. Consistent with findings from previous studies, age reporting among non-Hispanic whites was much more compatible; ages agreed for 94.6 percent and 91.7 percent of non-Hispanic white decedents aged 65 and above and 85 and above, respectively.
Similarly, findings based on a national sample of African-American decedents aged 65 and older in 1985 show large discrepancies in age reporting on the death certificate and a matching SSA record (Elo et al., 1996). Only 63 percent of decedents aged 65 and older had the same exact age reported in the two sources; discrepancies were pronounced even in 5-year age groups, with only 82 percent of the decedents falling within the same 5-year age group on death certificates and the matching SSA records. Comparability of age reporting for whites was not examined. In both studies, when ages disagreed, the death certificate age was much more likely to be younger than the age at death based on SSA records, except among the oldest old.
Perhaps the most careful analyses of old age mortality based on Social Security and Medicare data was conducted by Kestenbaum (1992). The author compared white and black mortality differentials at ages 85 and older based on Social Security and Medicare data from which records for certain subpopulations though to have most unreliable information had been excluded. Black mortality exceeded or was the same as white mortality up to age 87 for males and up to age 88 for females, at which ages the rates crossed over. The author concluded that "allowing some margin for error, we can assert confidently that white mortality exceeds black mortality after age 90" (Kestenbaum, 1992:572).
Because age data on SSA records are reported by the decedents several years or decades prior to death, whereas the death certificate age is reported by relatives or others, it is generally believed that an individual's age at death based on Social Security records is more accurate than the age recorded on the death certificate. Furthermore, SSA now requires verification of alleged age as a condition for entitlement to program benefits and enrollment in Medicare. The superiority of age reporting in Social Security is supported by results from a three-way matching study linking a sample of death certificates for African Americans aged 65 and older in 1985 to records for those same individuals in U.S. censuses of 1900-1920 and to Social Security records (Preston et al., 1996).
Among the oldest cohorts, however, there are reasons to suspect the accuracy of age reporting even in the SSA files. Problems with SSA data among the oldest old stem from the relatively lax procedures used in the past to verify an individual's age. Prior to November 1965, an individual filing for Social Security benefits was not usually required to provide proof of age as long as the alleged age was the same as on a request for a Social Security card filed at least 5 years earlier (Deutch, 1973); this was the practice even though SSA made no systematic attempt to verify the date of birth reported on the initial application forms (Aziz and Buckler, 1992). Thus, SSA information on date of birth has not been strictly verified for many persons born near or before the turn of the century. Even after stricter verification procedures were instituted in 1965, many elderly persons who could not obtain a birth certificate were allowed to submit various documents of lesser quality as proof of age (Social Security Administration, 1988).
We are not aware of any analysis of Hispanic mortality that uses data from the Social Security Administration. However, when the Census Bureau undertook projections of the Hispanic population in 1986, it investigated mortality among Spanish surnamed persons aged 65 and older in Medicare files during the period 1968-1979. The unpublished analysis is summarized in Spencer (1986). Death rates for elderly Hispanics computed from Medicare files were lower than those of elderly whites or blacks. These rates were the principal basis for the life-table values at baseline used in projections. At age 65, female life expectancy
estimated for 1983 was 19.36 years and male life expectancy was 15.84 years (Spencer, 1986:Table B-2). These are 0.5 and 1.3 years higher than the respective life expectancies for whites in 1982 (NCHS, 1985:11).
National Longitudinal Mortality Survey
An alternative source of data for estimating mortality for various racial and ethnic groups is the NLMS. Below, we show mortality estimates obtained from the NLMS Public Use Sample, which is based on five CPS surveys conducted between March 1979 and March 1981. The NLMS contains 637,324 individual records that have been linked to the National Death Index (NDI) for the years 1979-1985.8 This record linkage identified 22,649 deaths that had occurred within the 5-year period following the date of the CPS interview to members of the five CPS cohorts (for details on the linkage procedures, see Rogot et al., 1986).9 Because no other follow-up of individuals included in the five CPS cohorts was attempted, all individuals who were not linked to the NDI were considered to be alive at the end of the 5-year follow-up period.10 These procedures are likely to result in some deaths being missed because of a lack of perfect detection of deaths in the NDI. Rogot et al. (1992:2) have noted that ''there is some ascertainment loss, of perhaps 5%, occurring in the matching process because of recording errors in the files being matched."
There are reasons to suspect that the success in matching to the NDI differs by characteristics of the decedent, including race. Curb et al. (1985), for example, found significant variation by race and sex in the identification of known deaths in the NDI in 1979-1981. Deaths of African Americans and women were less likely to be located in the NDI than those of whites and men. The main explanation given for this finding was Social Security number discrepancies in the NDI and in the identifying information of the decedent used in the match. Boyle and Decouflé (1990) also found that in a match to the NDI, nonwhite deaths were missed more often than white deaths in a follow-up study of randomly selected Vietnam veterans. We have no way of knowing whether the
linkage rates varied by race or ethnicity in the NLMS, but it is possible that they were more complete for whites than for African Americans and perhaps Hispanics.11 We have elsewhere shown that estimates of white male and female death rates by educational attainment at ages 55 to 64 through 75 to 84 based on the NLMS are comparable to those estimated from the National Health and Nutrition Survey Epidemiologic Follow-up Study (NHEFS) for a roughly similar time period (Preston and Elo, 1995).
The NLMS data on socioeconomic and demographic characteristics come from the interview data from the CPS surveys, in which the interviewer contacts, by personal interview or through the telephone, the most knowledgeable adult member of the household, who provides information on all household members. Our samples for these analyses consist of 86,802 males and 104,372 females aged 45 to 89, of whom 11,165 and 8,584 respectively, had died during the 5-year follow-up period. 12 Because of the small number of deaths for Asian/Pacific Islanders and Hispanics, direct calculation of death rates is not feasible. Therefore, to assess racial and ethnic differences in mortality, we estimate a logit regression model where the dependent variable is the log odds of the probability of dying during the 5-year follow-up period.13 The estimated coefficients are then translated into age-specific death rates by 5-year age groups. Race/ethnicity is a combined categorical variable. Categories are non-Hispanic white, non-Hispanic African American, non-Hispanic Asian/Pacific Islander, and Hispanic. Note that Hispanic individuals can be of any race; the other groups exclude all individuals who identified themselves as Hispanic.
Tables 2-2 and 2-3 present the estimated coefficients from the logit models. Model 1 presents the main effects for the various racial/ethnic groups; Model 1a further distinguishes between native- and foreign-born Hispanics and Asian/Pa-
TABLE 2-2 Coefficients of Equations Predicting the Log Odds of Dying in a 5-Year Period: Males Aged 45 to 89, 1979-1985, National Longitudinal Mortality Surveya
|
Characteristic |
Model 1 |
Model 1a |
Model 2 |
Model 3b |
|
Age |
0.0926 (0.001) |
0.0927 (0.001) |
0.0956 (0.001) |
0.0826 (0.001) |
|
Race/ethnicityc |
|
|
|
|
|
Black |
0.2934 (0.039) |
0.2935 (0.039) |
2.1379 (0.228) |
0.0610 (0.042) |
|
Asian/Pacific Islander |
-0.4393 (0.105) |
|
-0.4376 (0.106) |
-0.4461 (0.107) |
|
Asian/Pacific Islander Native born |
|
-0.3589 (0.171) |
|
|
|
Asian/Pacific Islander Foreign born |
|
-0.5526 (0.154) |
|
|
|
Asian/Pacific Islander Birthplace unknown |
|
-0.3028 (0.251) |
|
|
|
Hispanic |
-0.4041 (0.071) |
|
0.3542 (0.413) |
-0.5462 (0.072) |
|
Hispanic Native born |
|
-0.1020 (0.107) |
|
|
|
Hispanic Foreign born |
|
-0.6246 (0.124) |
|
|
|
Hispanic Birthplace unknown |
|
-0.4838 (0.175) |
|
|
|
Age-race/ethnicity interactions |
|
|
|
|
|
Age/black |
|
|
-0.0282 (0.003) |
|
|
Age/Hispanic |
|
|
-0.0115 (0.006) |
|
|
Constant |
-7.8178 (0.071) |
-7.8245 (0.072) |
-8.0209 (0.077) |
-7.5322 (0.081) |
|
Log likelihood |
-28,897.9 |
-28,890.9 |
-28,866.0 |
-28,553.2 |
|
Sample size |
86,802 |
86,802 |
86,802 |
86,802 |
|
a White is used as the reference category; standard errors are in parentheses. b Model 3 includes controls for education, income, current residence, and marital status. c White, black, and Asian/Pacific Islander categories exclude all Hispanics. Hispanics can be of any race. |
||||
TABLE 2-3 Coefficients of Equations Predicting the Log Odds of Dying in a 5-Year Period: Females Aged 45 to 89, 1979-1985, National Longitudinal Mortality Surveya
|
Characteristic |
Model 1 |
Model 1a |
Model 2 |
Model 3b |
|
Age |
0.0921 (0.001) |
0.0922 (0.001) |
0.0941 (0.001) |
0.0862 (0.001) |
|
Race/ethnicityc |
|
|
|
|
|
Black |
0.3402 (0.041) |
0.3403 (0.041) |
1.673 3(0.251) |
0.1806 (0.043) |
|
Asian/Pacific Islander |
-0.5081 (0.144) |
|
-0.5014 (0.144) |
-0.5480 (0.146) |
|
Asian/Pacific Islander Native born |
|
-0.3309 (0.228) |
|
|
|
Asian/Pacific Islander Foreign born |
|
-0.6754 (0.219) |
|
|
|
Asian/Pacific Islander Birthplace unknown |
|
-0.4559 (0.356) |
|
|
|
Hispanic |
-0.2495 (0.080) |
|
-0.2431 (0.080) |
-0.3970 (0.081) |
|
Hispanic Native born |
|
-0.0174 (0.125) |
|
|
|
Hispanic Foreign born |
|
-0.4128 (0.138) |
|
|
|
Hispanic Birthplace unknown |
|
-0.3225 (0.196) |
|
|
|
Age-race/ethnicity interactions |
|
|
|
|
|
Age/black |
|
|
-0.0197 (0.004) |
|
|
Constant |
-8.5145 (0.081) |
-8.5187 (0.081) |
-8.6590 (0.086) |
-8.3985 (0.094) |
|
Log likelihood |
-25,790.9 |
-25,787.8 |
-25,776.7 |
-25,673.7 |
|
Sample size |
104,372 |
104,372 |
104,372 |
104,372 |
|
a White is used as the reference category; standard errors are in parentheses. b Model 3 includes controls for education, income, current residence, and marital status. c White, black, and Asian/Pacific Islander categories exclude all Hispanics. Hispanics can be of any race. |
||||
cific Islanders. Because place of birth was missing for a sizable fraction of the sample, we have further distinguished this group from the foreign- and native born Hispanics and Asian/Pacific Islanders. The purpose Model 1a is to investigate the hypothesis that the relatively low mortality of Asian/Pacific Islanders and Hispanics reflects the fact that many of these individuals are recent migrants to the United States. Previous studies have noted the unusually low mortality of Hispanic, Asian, and other foreign-born adults in the United States (e.g., Elo and Preston, 1996; Kestenbaum, 1986; Rosenwaike, 1987). In Model 2 we introduce interactions between age and race/ethnicity; only interactions significant at least at the 10 percent level are included. Model 3 repeats the same analysis as Model 1 with controls for education, income, marital status, and current residence (central city, metropolitan area outside central city, and nonmetropolitan area).
Table 2-4 and Figures 2-3 and 2-4 present the age-specific death rates by 5-
TABLE 2-4 Predicted Death Rates: Whites, African Americans, Asian/Pacific Islanders, and Hispanics, National Longitudinal Mortality Survey, 1979-1985
|
|
Death Rates (per 1,000) |
Ratios |
|||||
|
Age Group |
Whites |
African Americans |
Asian/ Pacific Islanders |
Hispanics |
African- American to White Rates |
Asian/Pacific Islander to White Rates |
Hispanic to White Rates |
|
Males |
|
|
|
|
|
|
|
|
45-49 |
4.58 |
10.88 |
2.97 |
3.92 |
2.38 |
0.65 |
0.86 |
|
50-54 |
7.33 |
15.08 |
4.77 |
5.94 |
2.06 |
0.65 |
0.81 |
|
55-59 |
11.70 |
20.82 |
7.63 |
8.98 |
1.78 |
0.65 |
0.77 |
|
60-64 |
18.55 |
28.59 |
12.17 |
13.52 |
1.54 |
0.66 |
0.73 |
|
65-69 |
29.12 |
38.99 |
19.28 |
20.25 |
1.34 |
0.66 |
0.70 |
|
70-74 |
45.09 |
52.71 |
30.24 |
30.07 |
1.17 |
0.67 |
0.67 |
|
75-79 |
68.42 |
70.46 |
46.75 |
44.17 |
1.03 |
0.68 |
0.65 |
|
80-84 |
101.11 |
92.95 |
70.80 |
63.89 |
0.92 |
0.70 |
0.63 |
|
85-89 |
144.66 |
120.72 |
104.37 |
90.63 |
0.83 |
0.72 |
0.63 |
|
Females |
|
|
|
|
|
|
|
|
45-49 |
2.28 |
5.03 |
1.38 |
1.79 |
2.21 |
0.61 |
0.79 |
|
50-54 |
3.64 |
7.26 |
2.21 |
2.86 |
1.99 |
0.61 |
0.79 |
|
55-59 |
5.80 |
10.45 |
3.53 |
4.56 |
1.80 |
0.61 |
0.79 |
|
60-64 |
9.20 |
14.99 |
5.63 |
7.25 |
1.63 |
0.61 |
0.79 |
|
65-69 |
14.54 |
21.41 |
8.93 |
11.49 |
1.47 |
0.61 |
0.79 |
|
70-74 |
22.80 |
30.37 |
14.12 |
18.10 |
1.33 |
0.62 |
0.79 |
|
75-79 |
35.36 |
42.71 |
22.16 |
28.24 |
1.21 |
0.63 |
0.80 |
|
80-84 |
53.96 |
59.35 |
34.39 |
43.49 |
1.10 |
0.64 |
0.81 |
|
85-89 |
80.56 |
81.28 |
52.54 |
65.71 |
1.01 |
0.65 |
0.82 |
|
SOURCE: Calculations by the authors from the National Longitudinal Mortality Survey public use file, based on coefficients presented in Tables 2-2 and 2-3, Model 2. |
|||||||
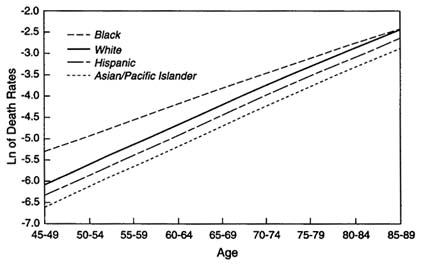
FIGURE 2-3 Death rates, white, African-American, Asian/Pacific Islander, and Hispanic females, ages 45 to 69, 1979-1985. SOURCE: Based on data from the National Longitudinal Mortality Survey.
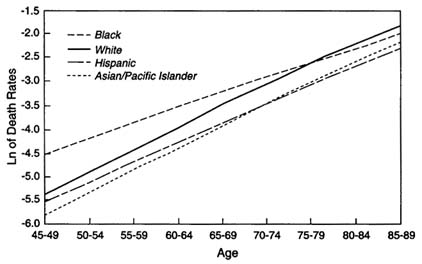
FIGURE 2-4 Death rates, white, African-American, Asian/Pacific Islander, and Hispanic males, ages 45 to 89, 1979-1985. SOURCE: Based on data from the National Longitudinal Mortality Survey.
year age groups up to age 85 to 89 that are predicted from the coefficients shown in Tables 2-2 and 2-3, Model 2.14 Because the NLMS excluded persons who were in institutions at the beginning of the follow-up period, death rates based on the NLMS are below the national level recorded in vital statistics, particularly at older ages. The predicted death rates for white and African-American males and females at the youngest age interval shown in Table 2-4 (45 to 49) are similar to the rates based on U.S. life tables in 1983 (near the midpoint of the follow-up period), but they begin to diverge thereafter, with the largest differences recorded at the oldest ages (cf. NCHS, 1986).
African Americans
As shown in Tables 2-2 and 2-3, African Americans have higher mortality than whites, Asian/Pacific Islanders, or Hispanics. The coefficients for African Americans in Model 1 for both sexes in NLMS are large and highly significant. As age advances, however, the racial gap in white and black death rates begins to narrow as is indicated by the significant and negative interaction terms between age and being African American (Tables 2-2 and 2-3, Model 2). This convergence is clearly evident in Table 2-4 and Figures 2-3 and 2-4, which present the predicted death rates by 5-year age groups. At ages 45 to 49 and 50 to 54, African-American death rates are twice as high as white rates, but the differentials narrow substantially thereafter, as was the case with similar comparisons presented in Table 2-1. For males, the predicted death rates cross over in the age interval 80 to 84; for females the rates have become nearly identical by age 85 to 89, the last age interval shown. In the 1983 U.S. life tables, the black-white mortality crossover for both males and females occurred in the age interval 85 and older, the final, open-ended, age interval shown (NCHS, 1986).
Hispanics
The results from the NLMS also place mortality of older Hispanic Americans below that of non-Hispanic whites. The ratios of Hispanic to white rates in Table 2-4 are not very different from those derived from dual data sources in Table 2-1. The ratios are actually somewhat lower for males in Table 2-4. Female ratios, on average, are slightly higher in Table 2-4 than in Table 2-1. Consistently with many earlier studies, Sorlie et al. (1993), also based on the NLMS, have further demonstrated lower mortality at ages 45 and above for all
|
14 |
The coefficients were translated into age-specific death rates as follows: [ln(ek + 1)]/5 = µ (x to x+n); where k represents the sum of the appropriate coefficients from Model 2 in Tables 2-2 and 2-3. For example, the death rate among white males in the age interval 45-49 is obtained as follows: [ln(e(-8.0209 + 44.5*0.0956) +1]/5 = 0.00458. The calculations shown in Table 2-4 use more precision than the coefficients shown in Tables 2-2 and 2-3. |
Hispanic subgroups (Mexican, Puerto Rican, Cuban, and other Hispanic) relative to non-Hispanics.
An examination of Model 1a suggests that much of the Hispanic advantage is due to exceptionally low mortality among Hispanics born outside the United States (Tables 2-2 and 2-3). The results from the NLMS in fact suggest that the mortality of U.S.-born Hispanics is not significantly different from that of non-Hispanic whites for either males or females. The mortality of those for whom a birthplace was not reported appears closer to that of the foreign born. The low mortality of the foreign born is often interpreted as reflecting the positive selection of migrants on such attributes as healthiness. But it is also possible that the advantage of nonnatives reflects in part the difficulties of following them up in the U.S. death records, since it is likely that some may have died abroad. It is also, of course, possible that the linkage of the CPS cohorts to the NDI was more successful for native- than for foreign-born Hispanics, an outcome that would lead to an underestimate of mortality among the foreign born. We have no way of knowing whether this was in fact the case.
We should also exercise some caution in drawing firm conclusions from the above results because of the relatively small number of deaths in the NLMS, which also prevents us from conducting more detailed analyses of mortality by cause of death that could shed further light on the observed patterns. Nevertheless, the above results underscore the importance of distinguishing between the native born and the foreign born in studies of health and mortality among the U.S. Hispanic population. There is clearly a need for further studies in this area. Data collection efforts that provide large enough sample sizes and that institute stringent follow-up procedures are needed if we hope to obtain accurate estimates of mortality for the Hispanic population in the United States.
Asian Americans and Pacific Islanders
The results based on the NLMS also confirm the low mortality of Asian Americans and Pacific Islanders relative to whites and other racial and ethnic groups. The relative advantage appears somewhat greater for females than for males (Tables 2-2 and 2-3). As was the case with Hispanics, results from Model 1a suggest that a portion of the lower mortality of Asian/Pacific Islanders is attributable to the low mortality among the foreign born. The findings for the native-born Asian Americans and Pacific Islanders further imply that their mortality is also lower than that of non-Hispanic whites, although the small number of deaths makes the results unstable and reaches significance only for males.
The results from the NLMS indicate that mortality estimates based on vital statistics and census data seem to exaggerate the relative mortality advantages of Asian/Pacific Islander males and females in comparison with white Americans. Ratios of Asian/Pacific Islander death rates to those of whites range from 0.52 to 0.69 for males in Table 2-1, compared with a range of 0.65 to 0.72 in Table 2-4.
The respective numbers for females are 0.54 to 0.70 and 0.61 to 0.65. This exaggeration is most likely the result of underestimation of mortality for this ethnic group based on data obtained from dual sources. As noted above, the consistency of race reporting for this subpopulation in death statistics and census records is low, much lower than for other racial and ethnic groups. Even so, the NLMS results continue to suggest that Asian/Pacific Islanders in the United States have extremely low mortality in comparison with whites and African Americans.
Subnational Studies
A number of studies have used data from small-scale, subnational data collection efforts, in addition to national data, to examine black-white mortality differentials at older ages. Wing et al. (1985), for example, analyzed data collected in the community-based Evans County (Georgia) Study to examine the black-white mortality crossover. These data, together with data from the Charleston Heart Study (Charleston County, South Carolina), were reanalyzed by Manton et al. (1991). The Evans County data consist of a 20-year follow-up of 3,102 persons aged 15 to 75 in 1960-1962, and the Charleston Heart Study data are based on a 25-year follow-up of 2,181 individuals aged 35 to 97 in 1960-1961. In both studies, the age of the participants was obtained by a personal interview at the start of the study.
Manton et al. (1991) examined the age pattern of black and white mortality and tested the sensitivity of the mortality crossover to different specifications of the hazard function and the use of different ages at the start of the follow-up. The age at the start of the follow-up had little effect on the results, and the same was true for the hazard functions specified. The authors found strong evidence for a racial crossover in mortality for females (at age 92). The results for males were more ambiguous. According to the authors (1991:1057):
The relatively small differences in black/white male mortality rates in middle age caused the crossover to be less significant for males. … Nonetheless, the difference is in the hypothesized direction and the hazard function yields a crossover at an age [80-84] consistent with other studies. This, coupled with the strong evidence for a crossover in female mortality, indicates that the crossover is a real phenomenon.
The convergence of black and white death rates at older ages has also been documented in the Alameda County (California) study by Kaplan et al. (1987). The authors examined the association between behavioral and demographic risk factors during a 17-year follow-up among subjects who were at least 38 years of age at the baseline interview in 1965. Age-stratified proportional hazard analyses were conducted to compare risk factor associations and mortality at ages 60 to 69 and 70 and older with two younger age groups (38 to 49 and 50 to 59). As noted
above, a convergence of black and white death rates at older ages was observed; at ages 70 and older, black mortality was insignificantly lower than white mortality; the relative hazard for blacks relative to whites was 0.76 with a 95 percent confidence interval of 0.52 to 1.12, when other risk factors were controlled for (Kaplan et al., 1987:Table 4).
The results from all studies discussed thus far, whether based on vital statistics and census data or on a single source, show a similar age pattern of differentials between white and black mortality. African-American death rates exceed white rates at younger ages, with the two rates slowly converging as age advances until, at the oldest ages, African-American death rates fall below those of whites. We have suggested that inconsistencies in age reporting in vital statistics and census data could account for this pattern when dual data sources are used for mortality estimates. But even when a single data source is used, a racial crossover is observed. It is possible that differences between African Americans and whites in the accuracy of age reporting at the baseline could lead to the observed mortality patterns. If, for example, net overstatement of age is more common among African Americans than whites, this could produce a racial crossover in death rates at older ages because the reported black death rates at a given age would actually pertain to what is, on average, a younger age group. None of the studies has made an attempt to verify the accuracy of baseline age reporting or of differences in the accuracy of age reporting by race. Even estimates based on Social Security and Medicare data are affected by a lack of stringent age verification procedures for the oldest old at the time when they applied for Social Security benefits. Studies that have examined age reporting patterns among whites and African Americans suggest that age reporting appears more accurate for whites than blacks. We address the implications of age misreporting bias for the observed racial crossover in mortality in the next section.
Extinct Generation Estimates
An alternative method of estimating mortality at older ages is to track deaths by age in a birth cohort until the last member of the cohort has died. One can then reconstitute the size of the cohort and death rates at all previous ages. The extinct generation method is the principal procedure being used in a major international analysis of mortality trends at older ages (Kannisto, 1994).
Elo and Preston (1994) have used the extinct generation method to reconstruct African-American mortality back to 1930 for cohorts born before 1890. When reassembled into age-specific death rates for various periods of time, the extinct generation estimates show lower death rates above age 80 or 90 than do conventional vital statistics/census methods in 1930, 1940, and 1970, the only years investigated. Many of the extinct generation death rate series do not increase with age. The authors argue that net overstatement of age on death certificates is the likely source of these anomalies.
To investigate the effect of age misstatement on African-American mortality at older ages, the authors have matched a sample of 5,262 death certificates of African Americans dying at ages 60 and above in 1985 or 1980 to records from U.S. censuses of 1900, 1910, and 1920 and to records of the SSA: 56.8 percent of the death certificates were matched to an early census and 88.1 percent to Social Security records; for 50.5 percent of death certificates, a three-way match was attained (Preston et al., 1996).
This study shows that ages on death certificates are subject to serious error. In only about 70 percent of death certificates did the age at death agree with that available from either of the other two sources. With respect to both alternative sources, the pattern of age misstatement on death certificates was one of net understatement. Nevertheless, too many deaths are registered at ages 95 and above as well as at ages 60 to 69.
In order to convert the corrected distribution of age at death into age-specific death rates, the authors used a variant of the extinct generation method. In particular, they used an intercensal growth correction to transform the age distribution of deaths in 1985 into what the distribution would be in a cohort subject to 1985 death rates for the rest of its life. The resulting life table death rates are presented in Table 2-5. Corrected death rates are somewhat higher than uncorrected death rates at 85 to 89 and much higher than uncorrected rates at ages over 90. The racial crossover in mortality when compared to the uncorrected white death rates for 1985 has disappeared.
TABLE 2-5 Estimated Age-Specific Death Rates by Race: United States, 1985 (Death Rates per 1,000)
|
|
Females |
Males |
||||
|
|
African Americans |
African Americans |
||||
|
Age Group |
Death Certificate Ageb |
Final Agec |
Whitesa |
Death Certificate Ageb |
Final Agec |
Whitesa |
|
65-69 |
26.3 |
22.7 |
16.1 |
46.0 |
44.0 |
30.3 |
|
70-74 |
38.7 |
35.4 |
25.2 |
65.0 |
62.4 |
47.5 |
|
75-79 |
54.9 |
52.9 |
40.1 |
87.6 |
91.1 |
71.5 |
|
80-84 |
83.8 |
70.2 |
67.8 |
123.4 |
114.4 |
109.2 |
|
85-89 |
118.5 |
128.9 |
115.1 |
160.5 |
168.8 |
162.5 |
|
90-94 |
153.4 |
198.7 |
188.6 |
199.2 |
272.3 |
238.2 |
|
95+ |
214.3 |
290.8 |
271.2 |
232.8 |
323.2 |
317.7 |
|
a White rates are based on registered deaths in 1985 and the Census Bureau's estimates of population on July 1, 1985. b Death rates based on age as reported on the death certificate. c Death rates based on deaths corrected for age misstatement. The final, open-ended, age group for males and females is 95+. SOURCE: Preston et al., 1996. |
||||||
The Preston et al. (1996) study is the most painstaking attempt to establish corrected ages at death for older African Americans, and it is the only study that fails to reveal a crossover between white and black death rates. These two features are likely to be related to one another. Nevertheless, the results are based on a relatively small number of linked cases and an unconventional methodology. If the authors are correct, their conclusions should be validated within the next 10 to 15 years through Social Security data for cohorts whose ages have been subject to improved verification.
Causes Of Death
The major causes of death for people aged 45 and above are diseases of the heart, malignant neoplasms, and cerebrovascular disease. It would be surprising if racial and ethnic differences in death rates from all causes combined were not principally attributable to differences in death rates from these causes. Table 2-6 presents age-standardized death rates at ages 45 and older from these causes in 1989-1991 for the major racial and ethnic groups that we are dealing with. The rates use preliminary death rates supplied by NCHS and census-based population estimates; they are calculated by the U.S. Department of Health and Human Services (NCHS, 1994). As noted earlier, differences in racial and ethnic classification systems between deaths and population estimates have probably biased downward death rates for Hispanics (perhaps by 7% or so) and Asian/Pacific Islanders (12%).
For every comparison of all-cause death rates between whites and another group that can be made in Table 2-6, the three identified causes account for a majority of the all-cause discrepancy. Nearly always, they operate in concert. Hispanics and Asian/Pacific Islanders have lower age-standardized death rates than whites from all causes and from each of the three causes (although differences for cerebrovascular disease are minor and in one case negligible); blacks have higher mortality than whites from all three causes.
In addition to the excess mortality of blacks from the three causes shown in Table 2-6, mortality from diabetes is an important source of black-white mortality differentials at ages 45 and older. Death rates from diabetes are two to three times higher for blacks than for whites at these ages, although the racial differentials narrow at older ages (Manton et al., 1987; NCHS, 1993). Diabetes is also an important factor contributing to the excess mortality from heart disease and stroke among African Americans. Relative to whites, African Americans have been shown to have a twofold excess risk of diabetes at ages 45 and above, with females having higher prevalence than males. Data on multiple-cause mortality, an important source of information for describing mortality at older ages, further show that diabetes is frequently identified as a contributing cause of death at older ages (Manton et al., 1987).
TABLE 2-6 Age-Standardized Death Rates at Ages 45 and Older by Race/Ethnicity for Certain Major Causes of Death: United States, 1989-1991 (Deaths per 100,000)
|
Cause of Death |
Whites |
Blacks |
Asian/Pacific Islanders |
Hispanics |
|
Males |
|
|
|
|
|
All causes |
2,030 |
3,039 |
1,158 |
1,484 |
|
Diseases of the heart |
726 |
969 |
373 |
485 |
|
Cerebrovascular diseases |
99 |
194 |
99 |
84 |
|
Malignant neoplasms |
565 |
870 |
335 |
352 |
|
Females |
|
|
|
|
|
All causes |
1,223 |
1,776 |
714 |
892 |
|
Diseases of the heart |
376 |
597 |
205 |
271 |
|
Cerebrovascular diseases |
84 |
148 |
81 |
63 |
|
Malignant neoplasms |
380 |
457 |
215 |
238 |
|
SOURCE: Compiled from NCHS, 1994: Tables 32-35. |
||||
The excess mortality of African Americans from heart disease and stroke also reflects differences in the distribution of other risk factors between blacks and whites. The increased prevalence and severity of hypertension among blacks than whites are well established and are considered important factors contributing to their poorer health outcomes (e.g., Johnson et al., 1986; Manton et al., 1987; Svetkey et al., 1993; NCHS, 1994:Table 78). A much higher prevalence of obesity among black women than other race/sex groups also places them at an increased risk of mortality (NCHS, 1994:Table 80).
The higher prevalence of cigarette smoking among black than among white males has also contributed to the higher African-American male mortality from heart disease, stroke, and lung cancer. The male differentials in lung cancer mortality are similar to those for all cancers combined, shown in Table 2-6. In contrast, age-adjusted death rates from lung cancer at ages 45 and older were higher for white than for African-American women in 1989 (NCHS, 1993). These distinct patterns undoubtedly reflect past cohort differentials in smoking habits.
The black disadvantage in cancer mortality and morbidity is also evident when we examine cancer incidence and survival. For many of the most important cancers, age-adjusted cancer incidence rates in 1991 were higher for black than for white males, including cancers of the oral cavity and pharynx, esophagus, stomach, colon, pancreas, lung, and prostate. For females, incidence rates were also higher for cancers of the colon, pancreas, lung and bronchus, and cervix uteri (NCHS, 1994:Table 67). In contrast, the age-adjusted incidence rate for breast cancer was lower for black than for white women. Five-year relative cancer survival rates are also generally lower for blacks than for whites. In the period 1983-1990, for example, the 5-year relative survival rates from cancers of all
sites was 35.7 percent for black males versus 50.8 percent for white males; the respective rates for females were 45.5 percent and 59.8 percent. Of the specific cancer sites for which data were shown—11 for males and 10 for females—survival rates were lower for blacks than for whites in all but two cases for males and one for females (NCHS, 1994:Table 68).15
Some of the poorer cancer survival rates among blacks seem to be attributable to differences in the stage of the disease at the time of the diagnosis (Brawn et al., 1993; Eley et al., 1994). A study (Ragland et al., 1991) that examined stage-specific survival rates for cancers for which mortality is considered avoidable by early diagnosis (colon, rectum, bladder, breast, cervix, uterine corpus, and prostate), for example, found no significant stage-specific differentials in survival by race for colon, male rectal, and prostate cancer. Stage-specific survival differences did, however, persist for male bladder, female rectal, and breast cancer. It has been suggested that racial differentials in survival from breast cancer may be linked to nutritional status and lower levels of serum albumin and hemoglobin (Coates et al., 1990).
Stroke mortality has declined rapidly in recent years, a decline that has been attributed to favorable trends in risk factors (Higgins and Thom, 1993). Black-white differentials in stroke mortality, however, remain substantial (Table 2-6). Among factors contributing to cerebrovascular mortality on which blacks are adversely distributed are socioeconomic status, prevalence of hypertension and diabetes, and prevalence of cigarette smoking among males.
The extent to which well-established risk factors (smoking, systolic blood pressure, total serum cholesterol level, body mass index, alcohol intake, and diabetes) account for black-white mortality differentials was recently investigated by Otten et al. (1990) in a national sample of adults based on data drawn from the National Health and Nutrition Survey Epidemiological Follow-up Study (1971-1984). At ages 35-77, major cardiovascular diseases accounted for 56.1 percent of the racial differences in mortality (both sexes combined), with cerebrovascular diseases alone accounting for 28.0 percent. Cancer accounted for an additional 18 percent (Otten et al., 1990:Table 2). In an analysis of all-cause mortality, the above six risk factors accounted for 31 percent of the excess mortality of African Americans at ages 35 to 54 and all of the much smaller black excess at ages 55 to 77.
Using a more detailed list of causes of death than shown in Table 2-6 for Hispanics, Markides and Coreil (1986) identify a ''Mexican-American" pattern of mortality, which has extended to the Hispanic population as a whole in more recent years (Sorlie et al., 1993). The pattern includes unusually high death rates
from diabetes, cirrhosis of the liver, and homicide and unusually low death rates from cardiovascular diseases and cancer. Sorlie et al. (1993) show that Hispanic death rates are low for cancer at all major sites, including the lung. As noted earlier, Rosenwaike (1987) examines 1979-1981 age-adjusted death rates by cause for persons born in Cuba, Mexico, and Puerto Rico. Mexicans and Puerto Ricans have much higher death rates than whites from diabetes, cirrhosis, and homicide; Cubans show a significant excess mortality only for homicide.
Conclusions
In this paper, we examine recent evidence on racial and ethnic differences in mortality in the United States at ages 45 and above. The four racial and ethnic groups included are African Americans, Hispanics, Asians and Pacific Islanders, and whites. We review evidence based on various types of data sources, including vital statistics and census data, linked data files, and extinct generation methods. The data for estimating adult and old age mortality in the United States appear most reliable for whites. Various sources of data error, including age misreporting, inconsistencies in the coding of race and ethnicity, and difficulties of following the foreign born in vital statistics data, create uncertainties in mortality estimates for other racial and ethnic groups.
A comparison of mortality estimates among whites and African Americans shows a convergence in white and black death rates at oldest ages. At younger ages, age-specific death rates for African Americans exceed white rates by as much as two to one, with a gradual narrowing of the differentials as age advances, until at the oldest ages, African-American death rates fall below those of whites. This pattern of differentials has been documented in vital statistics and census data, linked data files, and Social Security/Medicare data. Substantial evidence exists, however, to support the view that age misreporting has biased mortality estimates at older ages for African Americans. Age reporting inconsistencies in vital statistics and census data and age misreporting in death statistics, both of which are more pronounced for African Americans than whites, seriously bias comparisons of age-specific death rates based on dual data sources and on extinct generation estimates. Differences in age reporting accuracy at the baseline interview in linked data files could also produce the observed mortality patterns. None of the studies based on linked data sets have attempted to verify the accuracy of age reporting at the baseline interview. At the oldest ages, age reporting in Social Security/Medicare data also has not been strictly verified.
The only study that has systematically investigated the effects of age misreporting on mortality estimates among African Americans has demonstrated that age-specific death rates for African Americans at the oldest ages are biased downward. Mortality estimates based on corrected age distribution of deaths are substantially higher than estimates based on uncorrected data at ages 85 and above. When compared to mortality estimates for whites at these ages, no evi-
dence for a racial crossover in mortality is found. Uncertainty about white rates at ages 95+, however, prevents firm conclusions about racial differences in mortality at the highest ages. This is the only study reviewed here which does not show a racial crossover in mortality. It is also the only one that has attempted to establish corrected ages at death for African Americans.
Mortality estimates for Hispanics and for Asian/Pacific Islanders place their mortality below that of white Americans. The proportionate gap between Hispanics and whites increases with age, while the Asian/Pacific Islander advantage is larger at younger than at older ages. In both cases, a portion of the lower mortality is attributable to the low mortality among the foreign born, particularly among Hispanics. It is often assumed that the low mortality of the foreign born is related to the healthy migrant effect, but it is also possible that deaths of the foreign born are missed in U.S. death records because some of these individuals may have died abroad. Inconsistencies in the reporting of race in vital statistics and census data also bias mortality estimates downward for both Hispanics and Asian/Pacific Islanders. Age misreporting at older ages introduces an additional source of bias in estimates of mortality among Hispanics, although this bias appears to be less severe than for African Americans. Nevertheless, mortality estimates based on linked data sources suggest that mortality among both Hispanics and Asian/Pacific Islanders is below that of white Americans.
References
Aziz, F., and W. Buckler 1992 The status of death information in Social Security Administration files. Pp. 262-267 in Proceedings of the Social Statistics Section, American Statistical Association. Washington, DC: American Statistical Association.
Barringer, H.R., R.W. Gardner, and M.J. Levin 1993 Asian and Pacific Islanders in the United States. The Population in the United States in the 1980s. Census Monograph Series. New York: Russell Sage Foundation.
Boyle, C.A., and P. Decouflé 1990 National sources of vital status information: Extent of coverage and possible selectivity in reporting. American Journal of Epidemiology 131(1):160-168.
Bradshaw, B.S., and K.A. Liese 1991 Mortality of Mexican-origin persons in the southwestern United States. Pp. 81-94 in Mortality of Hispanic Populations, Ira Rosenwaike, ed. New York: Greenwood Press.
Brawn, P.N., E.H. Johnson, D.L. Kuhl, M.W. Riggs, V.O. Speights, C.F. Johnson, P.P. Pandya, M.L. Lind, and N.F. Bell 1993 Stage at presentation and survival of white and black patients with prostate carcinoma. Cancer 71(8):2569-2573.
Bureau of the Census 1983 Census of Population: 1980. General Population Characteristics. United States Summary. Final report PC80-1-B1. Washington, DC: U.S. Department of Commerce.
1992a 1990 Census of Population: General Population Characteristics, Massachusetts. Washington, DC: U.S. Department of Commerce.
1992b 1990 Census of Population: General Population Characteristics, Texas. Washington, DC: U.S. Department of Commerce.
1992c 1990 Census of Population: General Population Characteristics, United States. Washington, DC: U.S. Department of Commerce.
Coale, A.J., and J. Bannister 1994 Five decades of missing females in China. Demography 3(3):459-479.
Coale, A.J., and E.E. Kisker 1986 Mortality crossover: Reality or bad data? Population Studies 40:389-401.
1990 Defects in data on old-age mortality in the United States: New procedures for calculating mortality schedules and life tables at the highest ages. Asian and Pacific Population Forum 4(1):1-31.
Coates, R.J., W.S. Clark, J.W. Eley, R.S. Greenberg, C.M. Huguley Jr., and R.L. Brown 1990 Race, nutritional status, and survival from breast cancer. Journal of the National Cancer Institute 82(21):1684-1692.
Curb, J.D., C.E. Ford, S. Pressel, M. Palmer, C. Babcock, and C.M. Hawkins 1985 Ascertainment of vital status through the National Death Index and the Social Security Administration. American Journal of Epidemiology 121(5):754-766.
Day, J.C. 1993 Population Projections of the United States, by Age, Sex, Race, and Hispanic Origin: 1993 to 2050. Current Population Reports, Bureau of the Census, Series P-25, No. 1104. Washington, DC: U.S. Department of Commerce.
Dechter, A., and S.H. Preston 1991 Age misreporting and its effects on adult mortality estimates in Latin America. Population Bulletin of the United Nations 31/32:1-17.
Deutch, J. 1973 Proof of age policies—Past, present, and future. Unpublished internal memorandum by the Evaluation and Measurement System Staff, to the Assistant Bureau Director, Program Policy. U.S. Department of Health, Education, and Welfare. Washington, DC.
Eley, J.W., H.A. Hill, V.W. Chen, D.F. Austin, M.N. Wesley, H.B. Muss, R.S. Greenberg, R.J. Coates, P. Correa, C.K. Redmond, C.P. Hunter, A.A. Herman, R. Kurman, R. Blacklow, S. Shapiro, B.K. Edwards 1994 Racial differences in survival from breast cancer: Results of the National Cancer Institute black/white cancer survival study. Journal of the American Medical Association 272(12):947-954.
Elo, I.T., and S.H. Preston 1992 Effects of early-life conditions on adult mortality: A review. Population Index 58(2):186-212.
1994 Estimating African-American mortality from inaccurate data. Demography 31(3):427-458.
1996 Educational differentials in mortality: United States, 1979-85. Social Science and Medicine 42(1):47-57.
Elo, I.T., S.H. Preston, I. Rosenwaike, M. Hill, and T.P. Cheney 1996 Consistency of age reporting on death certificates and Social Security records among elderly African Americans. Social Science Research 25:292-307.
Frisbie, W.P. 1991 Mortality Among Mexican Americans and Mexican Immigrants. Final report to the National Institute of Child Health and Human Development. Austin: Department of Sociology, University of Texas. Unpublished.
Frost, F., and K.K. Shy 1980 Racial differences between linked birth and infant death records in Washington state. American Journal of Public Health 79:974-976.
Hahn, R.A., J. Mulinare, and S.M. Teutsch 1992 Inconsistencies in coding of race and ethnicity between birth and death in U.S. infants. Journal of the American Medical Association 267(2):259-263.
Higgins, M., and T. Thom 1993 Trends in stroke risk factors in the United States. Annals of Epidemiology 3(5):550-554.
Himes, C.L., S.H. Preston, and G.A. Condran 1994 A relational model of mortality at older ages in low mortality countries. Population Studies 48(2):269-291.
Hollman, F. 1993 U.S. Population Estimates by Age, Sex, Race, and Hispanic Origin: 1980 to 1991. Current Population Reports, Series P-25, No. 1095. Bureau of the Census. Washington, DC: U.S. Department of Commerce.
Jackson, J.J. 1980 Minorities and Aging. Belmont, CA: Wadsworth.
Johnson, J.L., E.F. Heineman, G. Heiss, C.G. Hames, and H.A. Tyroler 1986 Cardiovascular disease risk factors and mortality among black women and white women aged 40-64 years in Evans County, Georgia. American Journal of Epidemiology 123(2):209-220.
Kannisto, V. 1994 Development of Oldest Old Mortality, 1950-1990. Odense, Denmark: Odense University Press.
Kaplan, G.A., T.E. Seeman, R.D. Cohen, L.P. Knudsen, and J. Guralnik 1987 Mortality among the elderly in the Alameda County study: Behavioral and demographic risk factors. American Journal of Public Health 77(3):307-312.
Kestenbaum, B. 1986 Mortality by nativity. Demography 23(1):87-90.
1992 A description of the extreme aged population based on improved Medicare enrollment data. Demography 29:565-580.
Kitagawa, E.M., and P.M. Hauser 1973 Differential Mortality in the United States: A Study of Socioeconomic Epidemiology. Cambridge, MA: Harvard University Press.
Manton, K.G., C.H. Patrick, and K.W. Johnson 1987 Health differentials between blacks and whites: Recent trends in mortality and morbidity. Milbank Quarterly 65 (Suppl. 1):129-199.
Manton, K.G., and E. Stallard 1981 Methods for evaluating heterogeneity of aging processes in human populations using vital statistics data: Explaining the black/white mortality crossover by a model of mortality selection. Human Biology 53:47-67.
Manton, K.G., E. Stallard, and J.W. Vaupel 1981 Methods for comparing the mortality experience of heterogeneous populations. Demography 18:389-410.
Manton, K.G., E. Stallard, and S. Wing 1991 Analyses of black and white differentials in the age trajectory of mortality in two closed cohort studies. Statistics in Medicine 10:1043-1059.
Markides, K.S., and J. Coreil 1986 The health of Hispanics in the southwestern United States: An epidemiologic paradox. Public Health Reports 101:253-265.
Markides, K.S., and C.H. Mindel 1987 Aging and Ethnicity. Newbury Park, CA: Sage Publications.
Mosley, W.H., and R. Gray 1993 Childhood precursors of adult morbidity and mortality in developing countries: Implications for health programs. Pp. 69-100 in The Epidemiological Transition: Policy and Planning Implications for Developing Countries, James Gribble and Samuel H. Preston, eds. Washington, DC: National Academy Press.
National Center for Health Statistics 1968 Comparability of age on the death certificate and matching census record, United States, May-August 1960. Vital and Health Statistics 2(29).
1969 Comparability of marital status, race, nativity, and country of origin on the death certificate and matching census record, United States, May-August 1960. Vital and Health Statistics 2(34).
1985 Vital Statistics of the United States, 1982. Life Tables. Volume II, Section 6. Hyattsville, MD: Public Health Service.
1986 Vital Statistics of the United States, 1983. Life Tables. Volume II, Section 6. Hyattsville, MD: Public Health Service.
1990 Deaths of Hispanic origin, 15 reporting states, 1979-81. Vital and Health Statistics 20(18).
1993 Vital Statistics of the United States 1989. Volume II, Mortality, Part A. Hyattsville, MD: Public Health Service.
1994 Health, United States, 1993. Hyattsville, MD: Public Health Service.
National Institutes of Health 1992 National Longitudinal Mortality Study. Public use file documentation. Bethesda, MD: National Institutes of Health.
Otten, M.W., S.M. Teutsch, D.F. Williamson, and J.S. Marks 1990 The effect of known risk factors on the excess mortality of black adults in the United States. Journal of the American Medical Association 263:845-850.
Perks, W. 1932 On some experiments in the graduation of mortality statistics. Journal of the Institute of Actuaries 63:12.
Preston, S.H., and I.T. Elo 1995 Are educational differentials in adult mortality increasing in the United States? Journal of Aging and Health 7(4):476-496.
Preston, S.H., I.T. Elo, I. Rosenwaike, and M. Hill 1996 African-American mortality at older ages: Results from a matching study. Demography 33(2):193-209.
Ragland, K.E., S. Selvin, and D.W. Merrill 1991 Black-white differences in stage-specific cancer survival: Analysis of seven selected sites. American Journal of Epidemiology 133(7):672-682.
Robinson, J.G., and Y.J. Gist 1992 The effect of alternative race classification rules on the annual number of births by race: 1968-1989. Presented at the annual meeting of the Population Association of America, Denver, CO.
Rogot, E., P. Sorlie, and N.J. Johnson 1986 Probabilistic methods in matching census samples to the National Death Index. Journal of Chronic Diseases 39(9):719-734.
Rogot, E., P.D. Sorlie, N.J. Johnson, and C. Schmitt 1992 Mortality Study of 1.3 Million Persons by Demographic, Social, and Economic Factors: 1979-1985 Follow-up. NIH publication 92-3297. Bethesda, MD: National Institutes of Health.
Rosenwaike, I. 1987 Mortality differentials among persons born in Cuba, Mexico, and Puerto Rico residing in the United States, 1979-81. American Journal of Public Health 77(5):603-606.
Rosenwaike, I., and B. Bradshaw 1988 The status of death certificates for Hispanic population of the Southwest. Social Science Quarterly 69:722-736.
1989 Mortality of the Spanish surname population of the Southwest: 1980. Social Science Quarterly 70:631-641.
Rosenwaike, I., and S.H. Preston 1984 Age overstatement and Puerto Rican longevity. Human Biology 56(3):503-525.
Shapiro, S. 1950 Development of birth registration and birth statistics in the United States. Population Studies 4:86-111.
Shrestha, L., and S.H. Preston 1995 Consistency of census and vital registration data on older Americans: 1970-1990. Survey Methodology 21(2):167-177.
Shryock, H.S., and J.S. Siegel 1973 The Methods and Materials of Demography. Rev. ed. Volume 2. Washington, DC: Bureau of the Census.
Social Security Administration 1988 Social Security Handbook: 1988. 10th ed. Baltimore, MD: Social Security Administration.
Sorlie, P.D., E. Backlund, N.J. Johnson, and E. Rogot 1993 Mortality by Hispanic status in the United States. Journal of the American Medical Association 270(20):2464-2468.
Sorlie, P.D., E. Rogot, and N.J. Johnson 1992 Validity of demographic characteristics on the death certificate. Epidemiology 3(2):181-184.
Spencer, G. 1986 Projections of the Hispanic Population: 1983 to 2080. Current Population Reports, Series P-25, No. 995. Bureau of the Census. Washington, DC: U.S. Department of Commerce.
Svetkey, L.P., L.K. George, B.M. Burchett, P.A. Morgan, and D.G. Blazer 1993 Black/white differences in hypertension in the elderly: An epidemiologic analysis in central North Carolina. American Journal of Epidemiology 137(1):64-73.
U.S. Department of Health and Human Services 1985 Report of the Secretary's Task Force on Black and Minority Health . Volume II: Crosscutting Issues in Minority Health. Washington, DC: U.S. Department of Health and Human Services.
Wang, X., D.M. Strobino, and B. Guyer 1992 Differences in cause-specific infant mortality among Chinese, Japanese and White Americans. American Journal of Epidemiology 135(12):1382-1393.
Wing, S., K.G. Manton, E. Stallard, C.G. Hames, and H.A. Tryoler 1985 The black/white mortality crossover: Investigation in a community-based study. Journal of Gerontology 40(1):78-84.
Yu, E. 1984 The low mortality rates of Chinese infants: Some plausible explanatory factors. Social Science and Medicine 16:253-262.
Yu, E.S., C-F. Chang, W.T. Liu, and S.H. Kan 1985 Asian-white mortality differences: Are there excess deaths? Pp. 209-251 in Report of the Secretary's Task Force on Black and Minority Health. Volume II: Crosscutting Issues in Minority Health. Washington, DC: U.S. Department of Health and Human Services.
Zelnik, M. 1969 Age patterns of mortality of American Negroes 1900-02 to 1959-61. Journal of the American Statistical Association 64(326):433-451.
Zopf, P.E., Jr. 1992 Mortality Patterns and Trends in the United States. Studies in Population and Urban Demography, no. 7. Westport, CT: Greenwood Press.


