
Measurement of Environmental Quality in the United States
N. PHILLIP ROSS, CARROLL CURTIS, WILLIAM GARETZ, AND ELEANOR LEONARD
Office of Policy and Planning
Environmental Information and Statistical Division
U.S. Environmental Protection Agency
CONTENTS
The purpose of this paper is to provide an overview of environmental quality assessment activities in the United States. The topic is extremely broad and complex; this paper only touches on a limited number of issues and initiatives.
BACKGROUND
The rapid growth of the American society has brought with it the concomitant pollution of the environment. By the early 1960s it was apparent that additional government regulation was needed to deal with the growing levels of detectable anthropogenic pollution in our ambient environment. The United States Congress passed the National Environmental Protection Act (NEPA) in 1969 (42 U.S.C. 4341). This landmark legislation was the precursor to the creation of the U.S. Environmental Protection Agency. The NEPA required that the executive branch create the President's Council on Environmental Quality (CEQ) to formulate and recommend national policies to promote the improvement of the quality of the environment. Additional responsibilities were provided by the Environmental Quality Improvement Act of 1970 (42 U.S.C. 4371 et seq.).
The CEQ has statutory responsibility for overseeing the implementation of NEPA. The Council also develops and recommends to the President national policies that further environmental quality; performs continuing analysis of changes or trends in the national environment; reviews and appraises programs of the federal government to determine their contributions to sound environmental policy; conducts studies, research, and analyses relating to ecological systems and environmental quality; and assists the President in the preparation of the annual environmental quality report to Congress.
In its annual report, CEQ uses data obtained from a number of federal agencies to report on:
-
the status and condition of the major natural, man-made, or altered environmental classes of the nation, including, but not limited to, the air, the aquatic (including marine, estuarine, and fresh water) and the terrestrial environment (including, but not limited to, the forest, dry land, wetland, range, urban, suburban, and rural environment);
-
current and foreseeable trends in the quality, management, and utilization of such environments and the effects of those trends on the social, economic, and other requirements of the nation;
-
the adequacy of available natural resources for fulfilling human and economic requirements of the nation in light of expected population pressures;
-
a review of the programs and activities (including regulatory activities) of the federal government, the state and local governments, and nongovernmental entities or individuals with particular reference to their effect on the resources; and
-
a program for remedying the deficiencies of existing programs and activities, together with recommendations for legislation.
The Annual Report requires that CEQ obtain considerable support from other federal agencies with environmental responsibilities. CEQ coordinates this input through its Inter-agency Committee on Environmental Trends (ICET) which is co-chaired by CEQ and EPA. Even with the support of other agencies, the Annual Report does not provide a comprehensive annual state-of-the-environment picture, but it does provide a compilation of a selected set of analyses of environmental concerns focused towards policy interests in that year.
The United States is one of a very few countries in the world that does not produce a comprehensive publication on the state of the environment. The U.S. environmental community is presently moving in the direction of state-of-the-environment reporting through the development of a set of "environmental" indicators that will give a comprehensive picture (i.e., spatial) of the condition of the nation's environment and can also be used to evaluate temporal trends in environmental quality. These "environmental indicators" would be used much in the same way that we use economic indicators to assess the state of the economy and forecast economic trends.
The scientific community does not unanimously agree on what the best indicators of environmental quality should be. Unlike economic statistics in which the universe of concern is usually well defined (i.e., defined operationally by economists) and directly accessible via surveys and questionnaires, the environment does not provide such parameters. What is an ecosystem? What is the border of the wetlands? How do we assess air quality on a national scale, on a local scale? We cannot question the trees. We must design instruments that indirectly measure the parameters of interest. The collection of environmental data for inferential purposes is difficult and extremely expensive, and as such, not many data have been collected for purposes of describing the universe; most information is collected for purposes of compliance and enforcement. Only recently have we started to examine the impacts that our regulatory efforts have had on the quality of the ambient environment.
FRAMEWORKS FOR ORGANIZING ENVIRONMENTAL INDICATORS
Before undertaking the task of identifying environmental indicators for state-of-the-environment assessments, it is absolutely necessary to develop a framework with which to approach the process of selection and development. There are potentially thousands of environmental indicators. In order to develop relevant sets, some conceptual framework for a unified system of environmental information is necessary. Such a framework would provide the basis for identifying a set of environmental indicators (i.e., core set) that can be used to assess the quality of
the nation's environment. The USEPA has developed a conceptual framework for environmental information.1 The framework is based on a Pressure-State-Response model (PSR), which is presently used by the Organization for Economic Cooperation and Development (OECD), Canada, the Netherlands, and a number of other countries and NGOs. The following discussion is a extracted from the USEPA document:
Federal, state, local, and nongovernmental organizations (NGOs) spend hundreds of millions of dollars each year on the collection, storage, and use of environmental data. Many of these data are collected for specific purposes and are not designed to be used for developing general measures of environmental quality. A framework will provide a structure for organizing this vast quantity of primary data into an integrated system of compatible spatial and temporal statistics, indices, etc., which can facilitate secondary uses of environmental information for indicators and decision-making. The basic PSR framework was originally developed by the Organization for Economic Cooperation and Development's Group on the State of the Environment.2 The PSR model asserts that human activity exerts Pressure (such as pollution emissions or land use changes) on the environment, which can produce changes in the State of the environment (for example, changes in ambient pollutant levels, habitat diversity, water flows). Society then Responds to changes in pressures or state with environmental and economic policies and programs intended to prevent, reduce, or mitigate pressures and/or environmental damage.3
Environmental quality is the reflection of the State component of the PSR/E model. Both pressure and responses impact environmental quality. State is the most difficult measure to obtain, and in many instances, measures of response or pressure are used as indicators of quality based on the underlying causal relationship of the PSR/E model. The State of the environment is concerned with ambient physical, chemical, biological, and ecological conditions; changes in ecosystem composition, structure, and function at various spatial and temporal scales (including the "built" environment); human health; and environment-related welfare.
The USEPA model builds on the base OECD PSR model in the following ways:
-
A derivative category called "Effects" is added, for attributed relationships between two or more Pressure, State, and/or Response variables, resulting in a "PSR/E" framework (Figure 1).
-
Human driving forces of environmental change, and pressures of nonhuman origin are also included in the framework. Distinctions are made in terms of specific subcategories in which the State of the environment can be measured, and the types of entities making Responses.
-
Each subcategory is elaborated with a generic menu designed to facilitate linking environmental information collection efforts to common sets of environmental values, goals, and priorities.
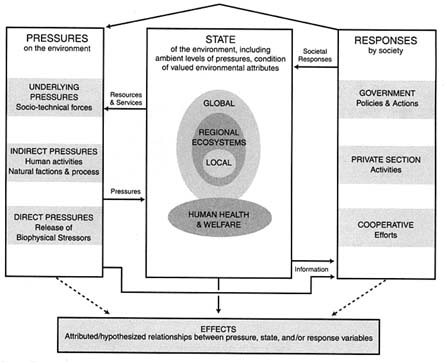
FIGURE 1 Pressure-State-Response/Effects (PSR/E) Framework.
-
The framework is consistent with a hierarchical view of ecosystems, allowing for the spatial nesting of environmental information, compatible with community- or ecosystem- (place-) based approaches to environmental management.
-
It is compatible with assessment-driven approaches to indicator selection.4
Indicators of Environmental Quality
In the last several years a number of organizations have been focusing on the development of environmental indicators that can be used to measure environmental quality, conditions, and trends. Like economic indicators (e.g., unemployment rates, cost-of-living index), environmental indicators hope to provide the public and decision-makers with directional measures of change that will allow for a more informed public and improved environmental planning and decision-making. There are many definitions for environmental indicators that appear in the literature, however the operational definition that we use in this paper is:
An environmental indicator is an environmental or environmentally related variable or estimate, or an aggregation of such variables into an index, that is used in some decision-making context:
-
to show patterns or trends in the state of the environment;
-
to show patterns or trends in the human activities that affect, or are affected by, the state of the environment;
-
to show relationships among environmental variables; or
-
to show relationships between human activities and the state of the environment.
This definition of an environmental indicator is purposely very broad to reflect the diversity of assessment and reporting contexts in the term as used. Thus the definition includes both measured or observed variables and composite indicators that aggregate a number of variables into a single quantity.
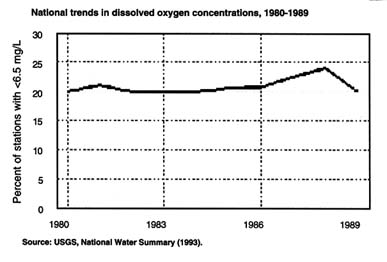
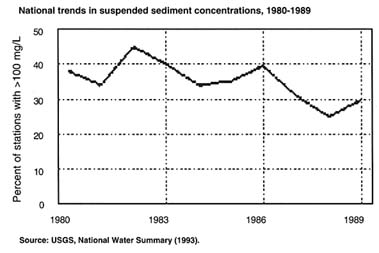
An example of a possible indicator of environmental quality is suspended sediment concentrations in the nation's rivers and streams. Figure 2 is a graphical display showing this measure as obtained from the USGS's NASQAN data base.
Suspended Sediment Concentrations in the Nation's Rivers and Streams
About 10 percent of NASQAN stations showed decreased suspended sediment concentrations over the sampling period 1980–1989. The quantity of suspended sediment transported to coastal waters decreased or remained the same in all but the North Atlantic region.
Indicator/Data Selection
Assessments of environmental quality can utilize either primary data collected specifically for the purpose for which they are used or secondary data that
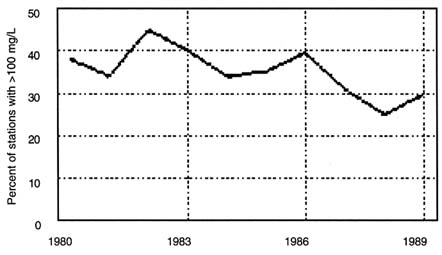
FIGURE 2 National trends in suspended sediment concentrations, 1980–1989.
were originally collected for other purposes. When basing assessments on existing data, analysts do not have the kind of control over factors such as data quality that they would if a new data collection effort were undertaken. In spite of these shortcomings, time and resource constraints frequently dictate the use of existing data. Various assumptions, models, and extrapolations are then applied in an effort to ''adjust" the data so they can be used in a new assessment context (see, for example, Kineman5).6 The USEPA has developed a draft proposal for a process to be used in selecting environmental indicators for a variety of purposes (policy development, program assessment, state of the environment, etc.). See Appendix A.
As discussed earlier, it is the state of the environment (SOE) that provides the most direct measure of environmental quality. Unfortunately, the U.S. does not collect a lot of data that will allow for easy development of SOE indicators. Tables 1–4 attempt to provide a comprehensive listing of State measures organized via the PSR/E model. Although the listings are not inclusive of all possible measures, they provide the focus necessary to define a "core" set of quality measures that can provide some assessment of the state of the environment in the context of the model.
As you can see from the tables, there is potentially a large number of indicators that one would want to have to make an overall assessment of environmental quality. It is critical that a core set be defined: a set of indicators that will provide decision-makers and the public with the baseline information they need to manage the environment, and at the same time not bankrupt the system. Environmental
Table 1 State of the Environment—Global Ecosystem
|
Valued Environmental Attributes (VEAs) |
|
Stability of global climate: atmospheric composition, temperature, precipitation patterns, storms, droughts, ocean currents |
|
Integrity of the stratospheric ozone layer |
|
Global scale genetic and species diversity |
|
Global environmental diversity |
|
Biogeochemical cycling (and storage) of carbon, nitrogen, phosphorus, and other elements |
|
Energy fixation/primary productivity |
|
Topsoil quantity and quality |
|
Management of species migration |
|
Environmental Conditions and Changes of Human and Natural Origin |
|
Atmospheric levels of greenhouse gases; ozone depleting substances |
|
Global temperature |
|
Global habitat alteration and destruction, including deforestation |
|
Global levels of soil erosion/degradation |
|
Globally transported pollutants in air or water (e.g., to polar regions) |
|
Global changes in species occurrence and distribution |
|
Proliferation of introduced (non-native) species |
TABLE 2 State of the Environment—Regional Ecosystems
|
Valued Environmental Attributes (VEAs) |
|
Regional genetic diversity, species diversity |
|
Regional environmental diversity (i.e., types of habitat) |
|
Biological integrity/health (e.g., Karrs Index of Biotic Integrity) |
|
Primary productivity/energy fixation |
|
Productive capacity of land for agriculture, forestry; soil quantity and quality (e.g., diversity of soil biota) |
|
Air quality |
|
Water quality |
|
Productivity of valued plant or animal species |
|
Stocks of nonrenewable resources: minerals, metals, fossils fuels, ect. |
|
Hydrologic functions of landscapes: flood regulation; groundwater recharge; water supply; water filtration; river flows to support aquatic species, irrigation, recreation, transport, power |
|
Geomorphological functions of landscape: wind and wave buffering; erosion control; sediment retention |
|
Stability of regional climate: precipitation, temperature, humidity, storms, ect. |
|
Contaminant/pollutant detoxification, dilution, storage by media (including air, water, soil and sediments) and biota |
|
Biogeochemical cycling, including eutrophication |
|
Discrete landscape features valued for aesthetic, cultural, spiritual reasons: particular mountains, waterfalls, etc. |
|
Habitat for wildlife, including migratory corridors |
|
Natural pest control |
|
Wilderness, open space |
|
Conditions and Changes of Human and Natural Origin |
|
Winds, oceans currents |
|
Precipitation, flooding, droughts |
|
Regional temperatures, humidity |
|
Hurricanes, tornadoes, dust storms, other extreme weather events |
|
Solar radiation; cloud cover |
|
Glaciation, sea ice |
|
Sea level |
|
Landform geology; erosion, sedimentation, landslides and land subsidence, earthquakes, volcanic eruptions; soil types |
|
Drainage basins; changes in river flows; groundwater depletion |
|
Soil erosion, compaction, salinization, and degradation |
|
Import/export of soil, nutrients, etc., to/from ecosystems; various nonpoint source pollution |
|
Regional ambient levels of pollutants in media; long-range transport of pollutants in air, water |
|
Forest and grass fires |
|
Ecosystem types, land cover/land use types (extent and spatial pattern) |
|
Distribution of native species and communities; species loss, changes in species range |
|
Feeding areas, habitats, migration routes of wildlife |
|
Regional habitat destruction, fragmentation; succession/retrogression |
|
Distribution, proliferation of exotic species, less desired native species, pests, disease vectors |
TABLE 3 State of the Environment—Local Ecosystems
|
Valued Environmental Attributes (VEAs) |
|
Safe drinking water (quantity and quantity) |
|
Maintenance of hydrological and geomorphological functions (see regional menu) |
|
Food safety (freedom from contaminants, undesired organisms) |
|
Air quality (visibility, outdoor, indoor, workplace) |
|
Pleasant climate (e.g., temperature, precipitation) |
|
Tree cover |
|
Natural control of pest and exotic (non-native) species |
|
Pollination |
|
Nutrient flows/cycles |
|
Productivity of commercially, recreationally valued species |
|
Local biodiversity and biotic integrity; healthy population of local keystone and other desired species |
|
Local environmental diversity |
|
Proximity of homes to jobs, shopping, schools, parks, civic facilities |
|
Access to local and regional transport (roads, public transport); safe routes for non-motorized traffic (sidewalks, bike paths) |
|
Land availability for various uses: residential and commercial constructions, agriculture, transportation corridors, parks, etc. |
|
Utilities (electricity, communications network, etc.) |
|
Sanitation (disposal, treatment, recycling options) |
|
Recreationally, aesthetically valued locations/sites/vista |
|
Other aesthetically and culturally valued attributes |
|
— Quiet |
|
— Absence of noxious odors |
|
— Cultural and Historical sites and districts |
|
Conditions and Changes of Human and Natural Origin |
|
Quantity and distributions of land and water suitable for various human uses |
|
Local climate |
|
Pollutant levels, proliferation of disease vectors in air, water, soil, food |
|
Proliferation of unwanted exotic species, less desired native species |
|
Local habitat alteration/fragmentation, destruction |
|
Trophic structure and functioning of ecosystems, including energy transfer, nutrient flows, etc. |
|
Biological community structure: species diversity, niche structure, etc. |
|
Condition of key species (individuals and populations), body burdens of chemicals; population size and dynamics |
|
Extent and distribution of paved surfaces, etc. |
TABLE 4 State of Human Health and Welfare VEAs
|
Human and Health-Related Economic Welfare |
||
|
|
Longevity (i.e., avoidance of premature death) |
|
|
|
Appropriate physiological function of body systems (i.e., avoidance of morbidity for each of the following systems): |
|
|
|
|
— circulatory — respiratory — nervous — digestive — musculoskeletal — endocrine — immune — reproductive system, etc. Psychological health (i.e., avoidance of unnecessary environmental stress) |
|
Health-Related Economic/Welfare Values |
||
|
|
|
— Adequate income — Time for family, work, and leisure |
|
|
Value of marketed environmental goods: crops, livestock, timber, fish, shellfish, fur-bearing animals, other species valued for use as food, pets, etc. |
|
|
|
Non-animal commercial inputs (chemicals, fertilizer, peat, metals, minerals) |
|
|
|
Fossils fuels |
|
|
|
Livestocks forage |
|
|
|
Water supply for domestic consumption, agriculture, energy production, industrial/commercial uses, waste disposal. |
|
|
|
Land and water use for human settlements, transport (e.g., navigation channels), etc. |
|
|
Other Use Values |
||
|
|
Recreation and tourism: camping, hiking, boating, swimming, sightseeing, photography, fishing, hunting, meditation, etc. |
|
|
|
Other aesthetic values (e.g., scenic views in residential areas) |
|
|
|
Scientific and research value |
|
|
Non-Use Values |
||
|
|
Existence value |
|
|
|
Historical, cultural, heritage, and spiritual value |
|
|
|
Bequest value |
|
|
|
Intrinsic value |
|
|
|
Scarcity/uniqueness value |
|
|
Value of Ecosystem Services (marketed or not, see Tables 1-3) |
||
data collection is extremely expensive, difficult, and time consuming. It is estimated that the USEPA spends in excess of $500 million a year on data collection, most of which is for enforcement and compliance data. Other federal agencies, as well as states, local governments, the regulated community, and environmentally focused NGOs, also spend significant dollars on environmental information collection.
ONGOING ENVIRONMENTAL QUALITY ASSESSMENT
As discussed earlier in the introduction, the CEQ has the responsibility for reporting to the President on the quality of the nation's environment each year. The CEQ publication Environmental Quality relies heavily on information to be input from several federal agencies covering a large variety of environmental areas and issues. Aside from this publication, there is no official U.S. publication (Note: except the U.S. national report for UNCED) that provides comprehensive information on the state of the U.S. environment. National environmental statistics are not collected in a centralized manner and there is no single source that one can use to assess the state and quality of the environment. The U.S. is one of a few countries in the world that does not have a centralized statistical system for collecting and analyzing environmental information and statistics. No single agency has the responsibility to provide information on the overall quality of the environment. Different federal and state organizations have focused responsibilities and produce a number or statistical summaries that can provide a limited picture of environmental quality, trends, and conditions.
The federal agencies that collect, publish, and disseminate environmental statistics are discussed below. For each agency a brief overview of the kind of information available is provided along with some examples of statistical summaries and graphics.
ENVIRONMENTAL RESPONSIBILITIES OF THE U.S. EXECUTIVE BRANCH
The executive branch of the U.S. government is responsible for developing environmental policy and implementing and enforcing federal environmental statutes. This responsibility is vested in the various executive offices, departments, independent agencies, and associated organizations (see Appendix B for more detail):
-
Council on Environmental Quality—Formulates and recommends to the President national policies to promote the improvement of the quality of the environment and carries out other responsibilities as provided by NEPA.
-
Department of Agriculture—Lead agency for natural resources and the environment, which includes the Forest Service and Soil Conservation Service.
-
These two services work to enhance the environment and maintain high production capacity by helping landowners protect the soil, water, forests, and other natural resources.
-
Department of Commerce—The National Oceanic and Atmospheric Administration in Commerce collects data and works to improve the understanding and benefits of the earth's physical environment and oceanic resources.
-
Department of Energy—As part of its mission to provide a framework for a comprehensive and balanced energy plan for the nation, the Department directs programs designed to increase the production and utilization of renewable energy and improve the energy efficiency of transportation, buildings, industrial systems, and related processes.
-
Department of Health and Human Services—Plays a large role in defining and pursuing environmental health goals through research, administration, and service programs and provides assistance and support to state environmental departments and health agencies. The following institutions have responsibilities for environmental health activities: Centers for Disease Control and Prevention; National Center for Environmental Health; Agency for Toxic Substances and Disease Registry; Food and Drug Administration; National Institutes of Health, and the National Institute of Environmental Health Sciences.
-
Department of the Interior—As the nation's principal conservation agency, the Department is responsible for most of the nationally owned public lands and natural resources. Its responsibilities include fostering sound use of land and water resources; assessing and protecting fish, wildlife, and biological diversity; preserving the environmental and cultural values of national parks and historic places; and providing for outdoor recreation. The Department assesses mineral resources and works to ensure that their development is in the best interest of the nation by encouraging stewardship and citizen participation in their care. The Department also has a major responsibility for Native American communities and for people who live in island territories under U.S. administration. Lead agencies for the environment are the United States Fish and Wildlife Service, National Park Service, National Biological Survey, United States Geological Survey, and Bureau of Land Management.
-
Department of Justice—Through its Environment and Natural Resources Division, the Department enforces civil and criminal environmental laws in order to protect citizens' health and the environment. It defends environmental challenges to government programs and activities; and represents the United States in all matters concerning the protection, use, and development of the nation's natural resources and public lands, wildlife protection, Native American rights and claims, and the acquisition of federal property.
-
Department of Labor—Through its Occupational Safety and Health Administration, the Department administers a variety of federal laws guaranteeing workers' rights to safe and healthful working conditions.
-
Department of State—Through its Bureau of Oceans and International
-
Environmental and Scientific Affairs, the Department formulates proposals and implements U.S. policy on international issues and significant global problems related to environment, oceans, fisheries, population, and space and other fields of advanced technology.
-
Department of Transportation—Environmental responsibilities include environmental impact assessments, and analyses of current and emerging transportation issues related to energy and the environment. It also enforces various laws related to transportation and discharge of oil and hazardous materials.
-
Environmental Protection Agency—The mission of this independent agency is to control and abate pollution in the areas of air, water, solid waste, pesticides, radiation, and toxic substances. Its mandate is to mount an integrated, coordinated attack on environmental pollution in cooperation with state and local governments.
Several independent commissions and government corporations also share some of the responsibility for our environment. Chief among these are the Federal Emergency Management Agency (emergency planning, preparedness, mitigation, response, and recovery from natural disasters and human-caused emergencies); National Aeronautics and Space Administration (studies global climate change and integrated functioning of the earth as a system); National Science Foundation (supports research for improved understanding of the fundamental laws of nature); Nuclear Regulatory Commission (licenses and regulates civilian use of nuclear energy to protect public health and safety and the environment); Federal Energy Regulatory Commission (transmission and pricing of electricity and hydroelectric licensing); U.S. Information Agency (encourages international discussion and cooperation on fundamental concerns, including the global environment); Marine Mammal Commission (protection and conservation of marine mammals); Tennessee Valley Authority (in support of its mission to advance economic growth in the Tennessee Valley, conducts research and development programs in forestry, fish and game, and watershed protection).
WHAT INITIATIVES ARE UNDER WAY FOR THE FUTURE?
Environmental Strategies for the 1990s and Beyond
The United States is entering a new phase in the evolution of environmental protection, one that recognizes that effective environmental protection and control involve more subtle and complex variables than have been considered under earlier, centralized, command-and-control approaches. It also one that emphasizes the positive relationship between a healthy environment and a prosperous economy. The following strategies embrace these concepts:
Ecosystem Approach to Resource Management.
Public concern about the environment, together with new thinking by scientists and resource managers,
has led to a new philosophy about how to manage resources in the United States. This philosophy says that we can manage resources to sustain their full array of values and uses through a broader understanding of their associated ecosystems. This approach calls for a shift of focus from more traditional single-resource, single-species management to a collaborative, developed, holistic approach that integrates ecological, economic, and social factors affecting a management unit defined by ecological, not political, boundaries. This approach requires knowledge of the composition, structure, and function of ecosystems, their relationships and influences on each other, and their capacity to support multiple uses and to produce goods and services for society without sacrificing health, sustainability, or biodiversity.
The elements of an ecosystem approach are not new, but their endorsement by the federal government represents an advance in coordinated resource management. Much of the genesis for the evolving federal approach to ecosystem management came from the Administration's 1993 Report of the National Performance Review, which strongly supported the concept of cross-agency ecosystem planning and management and led to the establishment of an Interagency Ecosystem Management Task Force to develop principles and guidelines for ecosystem sustainability.
In addition, statutes such as the Forest and Rangeland Renewable Resources Planning Act, the National Forest Management Act, and the Federal Land Policy and Management Act, which outline various procedures to follow in federal public land planning, also authorize the employment of principles intrinsic to ecosystem management. For example, they call for planning to be interdisciplinary, coordinated among agencies, and based on available science. The National Forest Management Act explicitly directs that the diversity of plant and animal species be considered in planning. Moreover, the Endangered Species Act directs the Secretary of the Interior, and the Secretary of Agriculture with respect to National Forest System lands, to establish and implement a program to conserve fish, wildlife, and plants, including those listed as threatened or endangered.
There are many additional examples of ecosystem-based management being practiced or planned at a variety of geographic scales and by a broad range of agencies and cooperators. Many of these are described in a recently released Congressional Research Service (CRS) Report for Congress entitled Ecosystem Activities: Federal Agency Activities. 7
In recognizing that techniques for applying an ecosystem approach may vary according to the natural resource issues and ecological systems involved, several ongoing ecosystem activities were selected by the Interagency Ecosystem Management Task Force in 1994 as case studies. These "survey and assist" ecosystems (Anacostia River Watershed; Great Lakes; Pacific Northwest forests; Prince William Sound; South Florida; Southern Appalachian Highlands; and Southern Louisiana wetlands) were selected to learn from the experience of those implementing an ecosystem approach and to help determine what the Task Force or
Congress can do to support efforts in the field and facilitate more effective performance by the federal agencies. In addition, the Great Plains, Mojave Desert, and Monterey Bay ecosystems were selected as "new initiative laboratories" to employ a collaborative process in documenting historical ecosystems, developing a vision of the range of desired future conditions, and considering how current stakeholders will address key concerns. This work is in progress.
Sustainable Development.
"Sustainable development" is broadly defined as economic growth that will benefit present and future generations without detrimentally affecting the resources or biological systems of the planet. In many respects, sustainable development is a corollary of ecosystem management—management approach that integrates ecological, economic, and social factors in restoring and/or maintaining the health, sustainability, and native biological diversity of ecosystems to support human communities and their economic base. Sustainable development operates on the tenet that the economy and the environment are inextricably linked; that an economy will not remain healthy if renewable resources are consumed faster than they can be replenished, or non-renewable resources faster than substitutes can be developed.
In 1993, the President's Council on Sustainable Development was established by Executive Order 12852 to develop a national sustainable development strategy. The 25-member Council brings together leaders from industry; government; and environmental, labor, and civil rights organizations. It is charged with developing bold new approaches to integrate economic and environmental policies.
In 1994, the Council issued a draft Vision Statement in which it states that … a sustainable United States will have an economy that equitably provides opportunities for satisfying livelihoods and a safe, healthy, high quality of life for current and future generations. Our nation will protect its environment, its natural resource base, and the functions and viability of natural systems on which all life depends.
The Council also issued draft Principles for Sustainable Development related to the vision described above. A final report of the Council was issued in the fall of 1995 after the Forum took place.
To support the activities of the Council, an Interagency Working Group on Sustainable Development Indicators was initiated in late 1993 to encourage cooperation among federal agencies in the creation of indicators for sustainable development. This effort also supports the recommendations of Agenda 21 from UNCED that sustainable development indicators be developed at the national level in a holistic fashion.
Sustainable development indicators are numerical measures that indicate the extent to which the current path of economic development is affecting the following three basic types of resources on which the well-being of both present and future generations depends:
-
renewable and non-renewable resources that directly support economic activity;
-
environmental resources—the reservoirs of air, water, and land into which wastes from human activity are discharged and through which humans and other living things are exposed to waste products; and
-
ecological resources—the plants and animals and their habitats that make up the biosphere and the processes by which they interact and evolve, providing in the process both essential support for human life and many valuable goods and experiences.
Patterned somewhat after widely used economic indicators, sustainable development indicators are being designed to measure performance in relation to sustainability goals and policies, and to provide the feedback needed to promote improvement of management techniques in a timely manner. Work in this area is progressing.
Environmental Goal Setting.
EPA has launched a project to produce a set of realistic and measurable U.S. environmental goals to be achieved early in the next century. To generate broad national input into the process, EPA sponsored a series of public meetings around the country in 1994. Participation by other federal, state, and local government agencies is also being sought, and the project is being coordinated with the President's Council on Sustainable Development. The effort also complements the efforts of other countries, such as Canada, Norway, New Zealand, and the Netherlands, in developing goals and plans for sustainable development.
Ultimately, the EPA goals will contain three tiers of measurable targets. Tier 1 goals will specify a condition of the environment that the nation is seeking to achieve by a certain year. Tier 2 objectives will specify reductions in pollutant loadings or other source-related causes that must be achieved to reach a Tier 1 goal. Tier 3 "action targets" will identify the specific work that EPA and others must complete to accomplish the overall goals.
The three tiers of goals will provide direction for the design of more effective, efficient programs to fulfill national priorities. Together with congressional mandates, the goals will drive EPA's planning, management, and budget.
Pollution Prevention.
There is a growing realization that in many instances it is far cheaper to prevent pollution than to clean it up. In the Pollution Prevention Act of 1990, Congress stated a national policy that "pollution should be prevented or reduced at the source whenever feasible" and that "disposal and other releases into the environment should be employed only as a last resort and should be conducted in an environmentally safe manner." This statute also requires development of a national source reduction, strategy, and it calls on the states to promote the use of source reduction techniques by businesses, which some states are already doing.
Since Earth Day 1993, a number of new initiatives and executive orders have been implemented to establish the federal government as a leader in advancing pollution prevention. Most notably, federal facilities are now required to develop written pollution reduction strategies incorporating source reduction in facility management and acquisition programs. Each agency must begin immediately to minimize the acquisition of the most potent (Class I) ozone-depleting substances and to maximize the use of safe alternatives. Similarly, agencies must also establish a plan and goals for eliminating or reducing the unnecessary acquisition of products containing extremely hazardous substances or toxic chemicals. Federal facilities that manufacture, process, or use toxic chemicals are now required to reduce toxic emissions and report publicly on toxic wastes and releases under the Emergency Planning and Community Right-to-Know Act. Energy efficiency in the workplace will be enhanced by government purchase of Energy Star computer equipment (which saves energy by automatically entering a low-power, standby state when inactive) and other energy-efficient products. Also toward this end, agencies are now required to set goals of reducing energy consumption, increasing energy efficient, auditing their facilities for energy and water use, increasing the use of solar and other renewable energy sources, designating ''showcase" facilities, and minimizing the use of petroleum-based fuels. In addition, federal agencies must implement affirmative acquisition programs for products less harmful to the environment when possible, including alternative-fueled vehicles and products containing pre- and post-consumer recycled materials. These and other federal initiatives will help augment the importance of adopting pollution prevention principles at every level of government and throughout the private sector. They are also aimed at encouraging new technologies and building markets for environmentally preferable and recycled products.
Enhanced Regional and International Environmental Cooperation
The United States has taken several steps toward greater cooperation on many of the most pressing environmental challenges facing the world. In addition to its work on a U.S. sustainable development plan, the United States has fulfilled several other commitments that grew out of the 1992 United Nations Conference on Environment and Development (UNCED), also known as the Earth Summit. At the Earth Summit, the United States joined other countries in signing the Framework Convention Climate Change, an international agreement whose ultimate objective is to achieve stabilization of greenhouse gas concentrations in the atmosphere at a level that would prevent dangerous anthropogenic interference with the climate system. Since then, the United States has released the "Climate Change Action Plan" (1993), which details the initial U.S. response to climate change, and the "Climate Action Report" (1994), which describes the current U.S. program and represents the first formal U.S. communication under the Framework Convention on Climate Change. In June 1993, the United States
signed the Convention on Biological Diversity, indicating its commitment to help stem the loss of the earth's species, their habitats, and ecosystems. The United States has committed to provide $430 million over the next four fiscal years toward the replenishment of the recently restructured Global Environmental Facility (GEF), which will act as the interim institutional mechanism for both the biodiversity and the climate change conventions.
The United States has also succeeded in getting regional and international trading systems to begin address environmental issues. The North American Free Trade Agreement (NAFTA), which went into effect in 1994, expressly endorses the principle of sustainable development and includes environmentally positive provisions on dispute settlement and investment. In 1993, the United States joined the governments of Canada and Mexico in signing the North American Agreement on Environmental Cooperation, an integral part of NAFTA. The objectives of the Environmental Agreement are to promote improved environmental conditions throughout North America and to improve national enforcement of laws relating to environmental protection. It also provides for monitoring the environmental effects of the NAFTA. In addition, the United States reached agreement with Mexico for two new institutions devoted to environmental improvement in the border area: the Border Environment Cooperation Commission, which will work with local communities to develop and arrange financing for vitally needed environmental infrastructure projects, and the North American Development Bank, which will use 90 percent of its capital—to be contributed equally by the United States and Mexico—to leverage private funds in order to finance the construction of border environmental projects through bonds and other instruments.
The United States demonstrated its commitment to integrating environmental protection and international trade by endorsing the establishment of a Committee on Trade and Environment as part of the new World Trade Organization (WTO) under the General Agreement on Tariffs and Trade (GATT). The Committee, with powers and functions equivalent to those of other standing committees established in the WTO, will have broad terms of reference that include making recommendations on changes to existing trade rules. It can recommend changes in trade rules to govern the use of trade measures for environmental purposes, and to safeguard environmental agreements. It can also examine how the trading system should treat environmental packaging and labeling, and what rules should govern the use of taxes, such as energy taxes, for environmental purposes. With the creation of this committee, the trading system can now become fully involved in promoting sustainable development.
NOTES
APPENDIX A
Process for Selecting Indicators and Data and Filling Information Gaps: Criteria for Selecting Indicators
In selecting environmental indicators, it is important to have clear selection criteria. Previously developed criteria are available from several sources including the Environmental Monitoring and Assessment Program (EMAP), the International Joint Commission for the Great Lakes (IJC), and the Intergovernmental Task Force on Water Quality Monitoring (ITFM). The choice of selection criteria depends in part on the intended use of the indicators. Therefore, the list of criteria suggested here, in Table A-1, has been adapted from other sources (primarily the ITFM criteria).
The selection criteria are grouped based on considerations of validity, interpretability, timeliness, understandability, and cost considerations. These considerations include the following:
-
Indicators should be valid measures of the valued attribute. Validity is a qualitative association between the concept embodied in the value and the measurable quantity represented by the indicator. Validity is established if there is a close scientific or logical link between the indicator and the the value. Three factors are listed in Table A-1 that contribute to a close logical link between the indicator and the valued attribute. First, indicators that have wide scope provide a balanced measure of the valued attribute. Second, indicators that respond to the cumulative effect of multiple stressors will be more generally applicable than those that are responsive to only a few stressors. Third, indicators that are highly correlated with other measures of the valued attribute will be generally applicable to the environmental system being measured. Indicators must be sensitive enough to measure changes over a reasonable time but not so sensitive that they fluctuate substantially between time periods. The signal-to-noise ratio for an indicator is in part determined by the data used to assess the indicator. Expert knowledge and peer review can be used to assess the sensitivity of different indicators.
-
Indicators should be interpretable in terms of the end point in the assessment process. They should be able to distinguish unacceptable from acceptable environmental conditions.
-
Timely indicators that anticipate future changes in the environment are preferred over those that are not anticipatory. To the extent that an indicator does not anticipate future conditions, the indicator with the least time lag would be preferred. The time lag depends on both the characteristics of the indicator and the time lag between the data collection and when the data are available to calculate the indicator.
-
Indicators should be understandable by the public and perceived as relevant. Understandability is in part a characteristic of the indicator and in part a function of how the indicator is presented. EPA may need to educate the public.
TABLE A-1 Criteria for Selecting Indicators
|
Criterion |
Explanation |
|
Validity |
|
|
Scientific Relevance to the Valued Attributea |
Scientific theory links the indicator to societal or environmental values. |
|
Scope/Applicability |
The indicator responds to changes on an appropriate geographic (e.g., national or regional) and temporal (e.g., yearly) scale. |
|
Integrates Effects/Exposures |
The indicator integrates effects or exposure over time and space and responds to the cumulative effects of multiple stressors. It is broadly applicable to many stressors and sites. |
|
Representative |
Changes in the indicator are highly correlated with other measures of the valued attribute. |
|
Signal-to-Noise Ratio |
The indicator is able to distinguish meaningful differences in environmental conditions with an acceptable degree of resolution. |
|
Interpretability |
|
|
Interpretablea |
There is a reference condition or benchmark against which to measure changes and trends. The indicator can distinguish acceptable conditions in a scientifically defensible way. |
|
Comparability |
The indicator can be compared to existing and past measures of conditions to define trends and variation. |
|
Timeliness |
|
|
Timely/Anticipatory |
The indicator provides early warning of changes. |
|
Understandability |
|
|
Understandablea |
Indicator is in, or can be transformed into, a format that is understandable to the target audience. |
|
Perceived Relevance to the User |
The measured quantity is seen by the audience as being important or relevant to their lives. |
|
Cost-Effectiveness |
|
|
Cost-Effectiveness |
Information is available or can be obtained with reasonable cost and effort. Provides maximum information per unit effort. |
|
Minimal Environmental Impact |
Sampling produces minimal environmental impact. |
|
a Indicates critical criteria. |
|
-
on the importance of some indicators. If possible, indicators should be "attention grabbers" in that they communicate to the audience why the value is important, e.g., information on the number of fish is generally more interesting to the public than data on macroinvertebrates in the food chain. Keeping data presentations simple, graphic, and consistent will help. When there is uncertainty as to how an indicator will be understood, the use of focus groups may help EPA to understand how the public perceives the indicator and to provide guidance on improvements to the indicator
-
Finally, indicators should be cost-effective relative to alternatives, and to the effort and expertise to collect the data, if required, and monitor the indicator over time.
CRITERIA FOR SELECTING EXISTING DATA SETS TO QUANTIFY INDICATORS
Table A-2 sets forth proposed criteria for evaluating the usefulness of a data set for quantifying an indicator. Critical criteria for selecting data sets would include the availability of data on the selected parameters, appropriate temporal and spatial coverage, documented quality, and accessibility. Because changes in the data collection procedures might affect the technical credibility, the magnitude of the estimation error (and the associated sample size), and the cost, another critical criterion for consideration of a data set is that minimal standards of technical credibility, estimation precision, and cost can be achieved by either the present data collection procedures or reasonable modifications.
It is likely that either sampling procedures or laboratory analysis procedures will change over the time that a data source is used to quantify an indicator and monitor progress. These changes will result from advancements in technology and changes in budgets and uses of the data sets over time. The effect of these changes can be minimized by using (1) measurements for which changes in technology are likely to improve the precision but not affect the measurement bias and (2) procedures for which the measurement bias is relatively insensitive to the magnitude of the collection effort. To the extent that this cannot be achieved, a comparability study can be used to compare the indicator before and after the change. The value of both the original and the revised indicator can be used for some time to provide information on how the two indicator compare. This same procedure can be used if a entirely new data set is used for the revised indicator.
PROCESS FOR SELECTING INDICATORS AND DATA
The proposed process for selecting indicators and data and filing information gaps consists of four basic steps. Characteristics of how these four steps interrelate is provided in Figure 1 on p. 139. These four steps are discussed in more detail below:
TABLE A-2 Criteria for Selecting Existing Data Sets to Quantify Indicators
|
Criterion |
Explanation |
|
Availability of Dataa |
Data set provides measurements of the parameter(s) or variable(s) specified in the indicator. |
|
Appropriate Temporal Coveragea |
At a minimum, information should be available for the present and for future years. In addition, temporal coverage within reporting cycles (usually annually) may have gaps but should not exclude data that will significantly affect the indicator. |
|
Appropriate Spatial Coveragea |
Information should be available on a national (regional) basis for a national (regional) program, or, if the information is compiled from local or regional data, the information will need to be aggregated using scientifically and statistically valid procedures. |
|
Documented Quality |
The information should be of known quality, i.e., there should be (1) documented QA/QC procedures for the collection, analysis and presentation of data; (2) documentation of any deviations from the procedures; and (3) quantitative information on both sampling and non-sampling errors. |
|
Accessibilitya |
The information should be retrievable and analyzable using existing data retrieval and analysis procedures. EPA would not be prohibited from using the data due to confidentiality concerns, etc. |
|
Technical Credibility |
The procedures used to manage and analyze the data should follow accepted professional practices. In addition, the sample and data collection procedures should not be inconsistent with the use of the data as a measure of the indicator, as judged by technical experts in the field who are familiar with the data. The calculated bias in the indicator should be insensitive to the magnitude of the data collection effort and to political pressures. In general, this criterion will eliminate self-reported data from consideration. |
|
Acceptable Estimation Error |
The precision and bias of the indicator should be acceptable given the desired precision specified by of the program. |
|
Acceptable Cost |
Cost of data collection, management, and analysis are within programmatic guidelines. |
|
a Indicates critical criteria. |
|
Step 1: Identify and Recommend Indicators for Reporting
Step 1a: Identify possible indicators. Compile two lists of candidate environmental indicators. The first list includes indicators developed to measure valued attributes, without any consideration for the availability of data. The second list includes currently used indicators. In many cases these indicators are meaningful and informative summaries constructed from available data. Many indicators will appear on both lists.
Step 1b: Score each indicator, using the criteria in Table A-1, to identify candidate indicators. Review each indicator in the two lists and select a range of possible indicators for further consideration. Indicators will be rejected if they do not satisfy all of the critical criteria shown in Table A-1. Of the remaining indicators, use a combination of peer review, literature review, and expert knowledge to select the candidate indicators for further consideration. The availability of data would be used as a criterion only for selecting between otherwise similar indicators.
Make a preliminary determination (using the descriptions of each indicator and the short forms for each data set) of which data sets are useful for each indicator. (See step 3a below.) This will provide additional information for each indicator on what data may be available.
Step 1c: Review the values, the information about the indicators, the criteria for selecting indicators, and the data available for each indicator (as a secondary criterion) to select proposed indicators. The process will use a combination of peer review, literature review, and expert knowledge to select the proposed indicators.
The process of making a preliminary choice, gathering more information, and making a more refined choice of indicators is iterative. Additional iterations may be necessary to refine the selection of indicators and to incorporate new information as it is gathered.
Step 2: Inventory and Describe Existing Data Sets That May Be Suitable for Quantifying Indicators
This step consists of 91) an ongoing inventory of existing data held by EPA, other federal agencies, and other groups that may be suitable for use in reporting and (2) summarizing information about the data sets to facilitate the use of appropriate data sets to measure the selected indicators. This step is broken into three substeps shown in Figure A-1 and described below.
Step 2a: Inventory existing data sets for their potential suitability for quantifying the candidate indicators. Prepare an assessment of existing data sources potentially available for reporting. Continually revise the assessment as new information
is gathered through discussions with other federal agencies, non-government organizations, etc.
Step 2b: Complete a preliminary characterization of data sets potentially suitable for the candidate indicators. After the candidate indicators have been selected, conduct a preliminary assessment of each data set that might potentially be used to assess one of the candidate indicators. To do this, prepare a "short from" to screen each data set. The "short form" will summarize the most important information needed to decide if a data set is potentially appropriate for a selected indicator. Two draft short forms appear on pages 172 through 178.
Step 2c: Complete a detailed characterization of candidate sets. After an initial selection of data sets that data might be appropriate for the preliminary selection of indicators (see step 3a), do a more extensive examination for each data set that might be useful for the candidate indicators. For example, a form provides additional details beyond that provided by the short form if it can be used to determine if a data set (1) provides adequate data for a selected indicator or (2) provides data that, if augmented or modified, can be made adequate.
Step 3: Identify and Recommend Information/Data for Selected Indicators
Once the indicators to be used in reporting have been selected, the next step is to select the information/data to be used to quantify the indicators. This requires examining existing data collection and analysis programs to determine if appropriate information is or will be available. To the extent that characteristics of the data collection procedures affect the evaluation of the criteria for selecting indicators—validity, interpretability, sensitivity, timeliness, understandability, and cost-effectiveness—the program should evaluate these criteria in light of the proposed data set. The process will be accomplished in the following two steps:
Step 3a: Identify candidate sets for each indicator. Use the information from the short form, published EPA data documentation, and other sources to identify data sets that might be appropriate for use with each indicator. Several data sets might be appropriate for use with an indicator. If several data sets could be used, all would be considered unless one or more were clearly inferior to the others (i.e., being similar on most criteria but clearly worse on some). Additional information would be collected on all data sets that were being considered for any of the candidate indicators (step 2c). In some cases it may not be possible to identify any data that might be appropriate.
Step 3b: Identify proposed data sets for each indicator, if possible. Use additional information to identify data sets that either are appropriate for use with each indicator or, if not, could be made acceptable with additional data collection or changes in procedures. If several data sets are appropriate for use with an
indicator, the best one would generally be chosen. In some cases it might not be possible to identify any data that are appropriate. For those indicators where the available data are either inadequate and can be improved or are not available, a data gap exists.
Step 4: Fill Information Gaps
For indicators that lack adequate information:
-
Document the information gap.
-
Review existing indicators and data to see if some can be used as interim indicators to at least provide some information on possible progress.
-
Develop strategies for filling information gaps, including improvements to existing programs in data collection, data analyses, and information management. Developing strategies includes determining if data can be made available by modifying existing data management and analysis procedures. For example, this could include the reanalysis of existing data or the integration and harmonization of two or more separate data sets.
-
If the information can be made available by changes in existing data management or data analysis procedures, develop a strategy for making the needed changes.
-
If the information cannot be made available by changes to existing data management or data analysis procedures, determine if there are validated test methods, statistical methods, etc., at the levels of accuracy and levels of reliability required:
-
For each indicator with validated methods, identify the type of data required (including statistical design) and design a data collection and data analysis program. If feasible, implement the program.
-
For each indicator without validated methods, set up a process to develop these. If needed, set priorities for developing these methods. Once appropriate methods are developed, identify the type of data required (including statistical design and data analysis) and design a data collection and analysis program. If feasible, implement the program.
-
APPENDIX B
DEMONSTRATION GRAPHICS FOR STATE OF THE ENVIRONMENT REPORTING
I. Examples of Graphics Used in Air Quality Status and Trends Reports
A. Ambient Air Quality. Graphics from the EPA, OPPE, ESID, Compendium of Selected National Environmental Statistics in the U.S. Government (Draft: 8/24/94 with updates by agency).
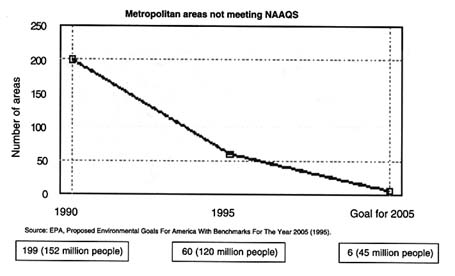
B. Metropolitan Areas Not Meeting National Ambient Air Quality Standards (NAAQS). Graphic from EPA, OPPE, Proposed Environmental Goals For America With Benchmarks For The Year 2005, Summary (Draft For Government Agencies' Review, February 1995).
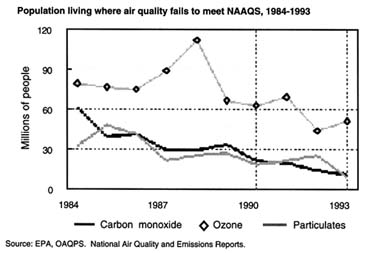
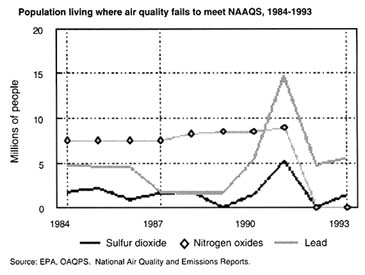
C. Population Living Where Air Quality Fails to Meet National Ambient Air Quality Standards (NAAQS). Graphic from the EPA, OPPE, ESID, Compendium of Selected National Environmental Statistics in the U.S. Government (Draft: 8/24/94 with updates by agency).
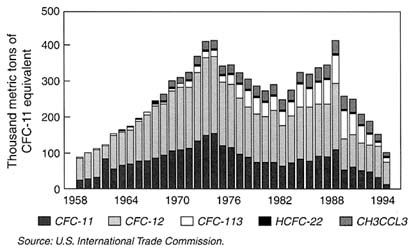
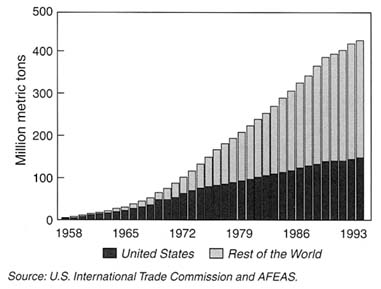
B. Cumulative CFC Production for the United States and the Rest of the World. Graphic from EPA, OPPE & OAR and World Resources Institute, Protection of the Ozone Layer (Draft Environmental Indicators Bulletin, May 1995).
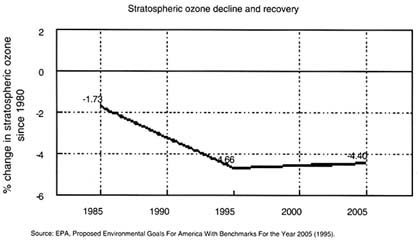
C. Stratospheric Ozone Decline and Recovery. Graphic from EPA, OPPE, Proposed Environmental Goals For America With Benchmarks For The Year 2005: Summary (Draft For Government Agencies Review, February 1995).
III. Examples of Graphics Used in Water Quality Status and Trends Reports
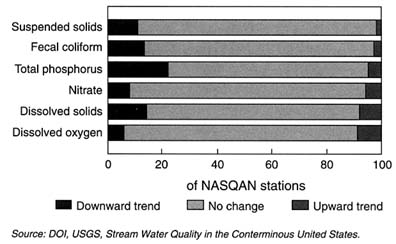
A. Stream Water Quality, by Pollutant Concentration Indicator. Graphic from the EPA, OPPE, ESID, Compendium of Selected National Environmental Statistics in the U.S. Government (Draft: 8/24/94 with updates by agency).
B. National Trends in River and Stream Water Quality. Graphics from Council on Environmental Quality, Environmental Quality 1993 (1995).
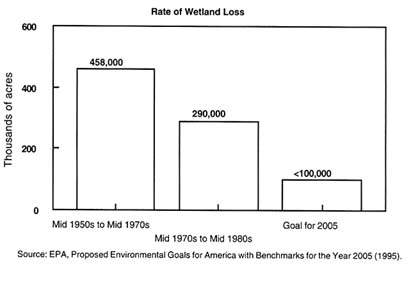
E. Rate of Wetlands Loss. Graphic from EPA, OPPE, Proposed Environmental Goals For America With Benchmarks For The Year 2005: Summary (Draft For Government Agencies' Review, February 1995).
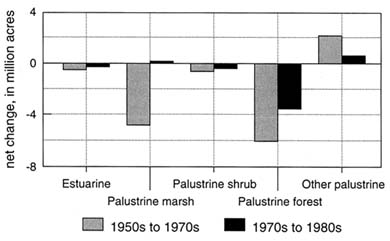
F. Changes in Wetlands, by Type. Graphic from the EPA, OPPE, ESID, Compendium of Selected National Environmental Statistics in the U.S. Government (Draft: 8/24/94 with updates by agency).
IV. Examples of Graphics from the Compendium of Environmental Statistics That Have Been Updated and Augmented with Metadata and Interpretive Text in a LOTUS NOTES DATABASE (Under Development). The LOTUS NOTES Entries Have Been Converted to Word perfect Files for the Purpose of this Demonstration. Two Pressure Entries That Are Related to Air Quality Are Presented.
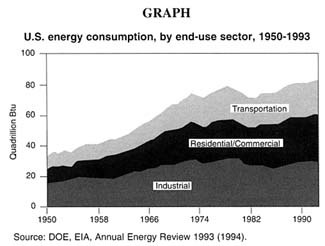
A. Energy Consumption by End-Use Sector
Environmental Statistics and Information Division Compendium of Environmental Statistics
|
Data Entry Author: Carroll Curtis |
Date Created: 07/27/95 02:58:40 PM |
|
Topic: Energy Consumption by-End-Use Sector |
Environment Media: Energy |
Technical Notes: Totals include fossil fuels consumed directly in the sector, electricity sales to the sector, and energy losses in the generation and transmission of electricity (allocated in proportion to electricity sales per sector). Due to a lack of consistent historical data, some consumption of renewable energy resources is not included. For example, in 1992, 3.0 quadrillion Btu of renewable energy consumed by U.S. electric utilities to generate electricity for distribution is included, but an estimated 3.0 quadrillion Btu of renewable energy used by other sectors in the United States is not included.
Publication Name(s): U.S. Department of Energy, Energy Information Administration. Annual Energy Review 1993 [DOE/EIA-0384(93)], Table 2.1, p. 39 (Washington, DC: DOE, EIA, July 1994).
Last Updated by ESID: 06/27/95 CNC
INTERPRETIVE TEXT
Energy consumption by the industrial sector increased throughout the 1960s and in 1973 reached 32 quadrillion Btu. Of the three end-use sectors, the industrial sector proved to be the most responsive to the turmoil in energy markets after the 1973–1974 Arab oil embargo. In 1979, industrial consumption of energy peaked at 33 quadrillion Btu. In the 1980s, a stagnant economy restrained industrial consumption, which declined to a 16-year low of 26 quadrillion Btu. In 1988 and 1989, economic growth spurred demand for energy in the industrial sector, and industrial energy consumption in 1989 rose to 29 quadrillion Btu. Despite slow economic growth in the 1990s, industrial energy consumption, trended upward. In 1993, industrial consumption energy reached 31, quadrillion Btu, the highest level in 14 years.
Much of the growth in energy consumption during the 1950-through-1993 period occurred in the residential and commercial sector. Residential and commercial consumption leveled off in response to higher energy prices in the late 1970s and early 1980s, but lower prices in the 1986-through-1993 period played a role in boosting residential and commercial energy consumption to the record level of 30 quadrillion Btu in 1993.
Energy consumption by the transportation sector was primarily petroleum consumption. Over the 44-year period, the transportation sector's consumption of petroleum more than tripled, but growth was slower during the 1980s than in previous decades. In 1993, consumption of petroleum in the transportation sector totaled 23 quadrillion Btu, up 1.6 percent from the 1992 level.
Publication Name (if different from Table &/or Graph Publication Name):
Last Updated by ESID: 06/27/95 CNC
Table U.S. energy consumption, by end-use sector, 1950–1993 (quadrillion Btu)
|
Year |
Industrial |
Residential & commercial |
Transportation |
Total |
|
1950 |
15.71 |
8.87 |
8.49 |
33.08 |
|
1951 |
17.13 |
9.30 |
9.04 |
35.47 |
|
1952 |
16.76 |
9.54 |
9.00 |
35.30 |
|
1953 |
17.65 |
9.50 |
9.12 |
36.27 |
|
1954 |
16.58 |
9.78 |
8.90 |
35.27 |
|
1955 |
18.86 |
10.41 |
9.55 |
38.82 |
|
1956 |
19.55 |
10.96 |
9.86 |
40.38 |
|
1957 |
19.60 |
10.98 |
9.90 |
40.48 |
|
1958 |
18.70 |
11.64 |
10.00 |
40.35 |
|
1959 |
19.64 |
12.15 |
10.35 |
42.14 |
|
1960 |
20.16 |
13.04 |
10.60 |
43.80 |
|
1961 |
20.25 |
13.44 |
10.77 |
44.46 |
|
1962 |
21.04 |
14.27 |
11.23 |
46.53 |
|
1963 |
21.95 |
14.71 |
11.66 |
48.32 |
|
1964 |
23.27 |
15.23 |
12.00 |
50.50 |
|
1965 |
24.22 |
16.03 |
12.43 |
52.68 |
|
1966 |
25.50 |
17.06 |
13.10 |
55.66 |
|
1967 |
25.72 |
18.10 |
13.75 |
57.57 |
|
1968 |
26.90 |
19.23 |
14.86 |
61.00 |
|
1969 |
28.10 |
20.59 |
15.50 |
64.19 |
|
1970 |
28.63 |
21.71 |
16.09 |
66.43 |
|
1971 |
28.57 |
22.59 |
16.72 |
67.89 |
|
1972 |
29.86 |
23.69 |
17.71 |
71.26 |
|
1973 |
31.53 |
24.14 |
18.60 |
74.28 |
|
1974 |
30.70 |
23.72 |
18.12 |
72.54 |
|
1975 |
28.40 |
23.90 |
18.25 |
70.55 |
|
1976 |
30.24 |
25.02 |
19.10 |
74.36 |
|
1977 |
31.08 |
25.39 |
19.82 |
76.29 |
|
1978 |
31.39 |
26.09 |
20.61 |
78.09 |
|
1979 |
32.61 |
25.81 |
20.47 |
78.90 |
|
1980 |
30.61 |
25.65 |
19.69 |
75.96 |
|
1981 |
29.24 |
25.24 |
19.51 |
73.99 |
|
1982 |
26.14 |
25.63 |
19.07 |
70.85 |
|
1983 |
25.75 |
25.63 |
19.13 |
70.52 |
|
1984 |
27.86 |
26.48 |
19.80 |
74.40 |
|
1985 |
27.22 |
26.70 |
20.07 |
73.98 |
|
1986 |
26.63 |
26.85 |
20.81 |
74.30 |
|
1987 |
27.83 |
27.62 |
21.45 |
76.89 |
|
1988 |
28.99 |
28.92 |
22.30 |
80.22 |
|
1989 |
29.35 |
29.40 |
22.58 |
81.33 |
|
1990 |
29.93 |
28.79 |
22.54 |
81.26 |
|
1991 |
29.57 |
29.42 |
22.12 |
81.12 |
|
1992 |
30.58 |
29.10 |
22.46 |
82.14 |
|
1993 |
30.77 |
30.34 |
22.83 |
83.96 |
Publication Name(s): U.S. Department of Energy, Energy Information Administration. Annual Energy Review 1993 [DOE/EIA-0384(93)], Table 2.1, p. 39 (Washington, DC: DOE, EIA, July 1994).
Technical Notes: See Technical Notes above. Also see Compendium Database entry for Renewable Energy Resources. Totals may not equal sum of components due to independent rounding. Current-year data are preliminary and may be revised in future publications.
Administrative Notes: The Energy Information Administration publishes two sets of statistics on end-use energy consumption. The first set, based on surveys directed to suppliers and marketers, provides continuous series for the years 1949 through 1993 and allocates U.S. total energy consumption into one of three end-use sectors: industrial, residential and commercial, and transportation. The statistics from these surveys are presented above. The second set, based on surveys directed to end-users of energy, provides detailed information on the type of energy consumed and the energy-related characteristics of manufacturing establishments, commercial buildings, households, and household motor vehicles. For information on the second set of statistics, contact EIA specialist for the Manufacturing Energy Consumption Survey [John L. Preston (202/586-1128)], Residential Energy Consumption Survey [Wendel L. Thompson (202/586-1119)], Residential Transportation Energy Consumption Survey [Ronald Lambrecht (202/586-4962)], or Commercial Buildings Energy Consumption Survey [Martha M. Johnson (202/586-1135)].
Review Contact for Statistics (if different from Contact below):
Last Updated by ESID: 06/27/95 CNC
Contact Information
|
Agency/Department: U.S. Department of Energy |
Bureau: Energy Information Administration |
|
|
Division/Office: Office of Energy Markets and End Use |
Branch/Address: Forrestal Building, EI-231 |
|
|
City: Washington |
State: DC |
Zip Code: 20585 |
|
Contact's Last Name: Brown |
First Name: Samuel E. |
|
|
Phone#: (202) 586-5108 |
Fax: |
Internet Mail Address: |
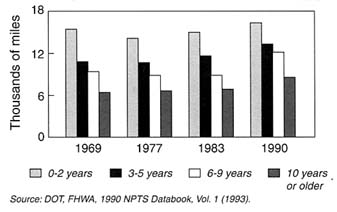
B. Aging of U.S. Vehicle Fleet
Environmental Statistics and Information Division Compendium of Environmental Statistics
|
Data Entry Author: Carroll Curtis |
Date Created: 07/27/95 02:58:40 PM |
|
Topic: Aging of the U.S. Vehicle Fleet |
Environment Media: Transportation |
Technical Notes:
Publication Name(s): U.S. Department of Transportation, Federal Highway Administration. 1990 NPTS Databook: Nationwide Personal Transportation Study, Vol. I (Washington, DC: DOT, FHMA, November 1993).
Last Updated by ESID: 07/27/95 CNC
INTERPRETIVE TEXT
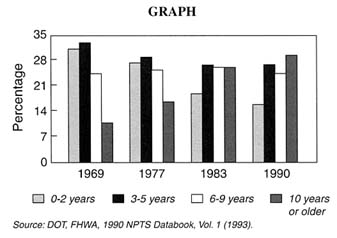
American households tend to keep their cars and trucks for a longer period of time. Over the period 1969-to-1990, the average age of household vehicles increased by 51 percent, from 5.1 years in age to 7.7 years. The percentage of household automobiles that are 10 or more years old increased from 10.8 in 1969 to 29.9 in 1990. While 31.4 percent of household automobiles in 1969 were less than two years old, this percentage decreased to 15.6 percent in 1990. Vehicles of all ages are driven more than in previous years, yet the rate of increase was more between 1969 and 1990 for older vehicles than younger ones. In 1990, between 20 percent and 26 percent of all vehicle trips were taken in vehicles 10 years and older, regardless of the number of vehicles available to the household.
The aging of the U.S. vehicle fleet has implications for energy consumption and air pollution issues, and the introduction of recent safety features into the household vehicle fleet. The fuel consumption characteristics of the older fleet clearly lag that of the newer fleet. From a level of 13.5 miles per gallon when the energy shock hit in the early 1970s, the fuel economy of the fleet has risen to a level approximating 21 miles per gallon in 1990. This suggests that for each mile of VMT occurring in older vehicles we pay a substantial energy penalty. The air pollution control consequences are probably even more pronounced. The year 1981 was a key turning point in the air quality control characteristics of the vehicle fleet. The differences in pollution per vehicle mile for vehicles pre- and post-1981 are extraordinary. In terms of safety there so many new safety features—anti-lock brakes, airbags, traction control, etc.—that will only slowly gain penetration into the fleet. On the other hand, one of the benefits of a fleet that lasts longer is for resource conservation and minimizing junk yards.
Publication Name (if different from Table &/or Graph Publication Name: U.S. Department of Transportation, Federal Highway Administration. 1990 NPTS Databook: Nationwide Personal Transportation Study, Vol. I (Washington, DC: DOT, FHMA, November 1993).
—, 1990 NPTS Report Series: Special Reports on Trip and Vehicle Attributes, Chapter 3. The Demography of the U.S. Vehicle Fleet, Table 1.2, p. 3–16 (Washington, DC: DOT, FHMA, February 1995).
Last Updated by ESID: 07/27/95 CNC
TABLE Aging of the U.S. fleet, 1969–1990
|
|
Characteristic |
1969 |
1977 |
1983 |
1990 |
|
Vehicles, by average age, all |
age, in years |
5.10 |
5.60 |
7.60 |
7.70 |
|
0–2 years |
% |
31.40 |
27.80 |
19.00 |
16.60 |
|
3–5 years |
% |
33.20 |
29.60 |
27.30 |
27.50 |
|
6–9 years |
% |
24.60 |
25.70 |
26.80 |
25.30 |
|
10 or more years |
% |
10.80 |
16.90 |
26.90 |
30.60 |
|
Annual VMT, by vehicle age, average |
1,000 miles |
11.60 |
10.68 |
10.32 |
12.46 |
|
0–2 years |
1,000 miles |
15.70 |
14.46 |
15.29 |
16.81 |
|
3–5 years |
1,000 miles |
11.20 |
11.07 |
11.90 |
13.71 |
|
6–9 years |
1,000 miles |
9.70 |
9.20 |
9.25 |
12.55 |
|
10 or more years |
1,000 miles |
6.50 |
6.76 |
7.02 |
9.18 |
Publication Name(s): U.S. Department of Transportation, Federal Highway Administration. 1990 NPTS Databook: Nationwide Personal Transportation Study, Vol. I, Table 3.24, p. 3–40 and Table 3.26, p. 3–43 (Washington, DC: DOT, FHMA, November 1993).
Technical Notes: The 1969 survey did not include pickups and other light trucks as household vehicles.
Administrative Notes:
Review Contact for Statistics (if different from Contact below):
Last Updated by ESID: 07/27/95 CNC
Contact Information
|
Agency/Department: U.S. Department of Transportation |
Bureau: Federal Highway Administration |
|
|
Division/Office: Office of Highway Information Management |
Branch/Address: 400 Seventh Street, SW |
|
|
City: Washington |
State: DC |
Zip Code: 20590 |
|
Contact's Last Name: |
First Name: |
|
|
Phone #: (202) 366-0180 |
Fax: |
Internet Mail Address: |


