
Can States Make a Market for Environmental Goals?
RICHARD A. MINARD, JR.
Center for Competitive, Sustainable Economies, National Academy of Public Administration
CONTENTS
TWO TRACKS
State governments and communities are experimenting with a wide array of approaches that they hope will improve both their environment and their economies. The advocates for environmental improvement and economic development are rarely one and the same however, and their approaches differ in many important respects. While some of these differences enhance their mutual effectiveness, the overall result appears to leave significant problems unaddressed. It appears that a more explicit connection between society's goals for the environment and for environmental science and technology is in order.
This paper will describe some of the state and local government efforts to make environmental policy and technology more forward-looking, more technically sophisticated, and more in touch with societal goals and expectations. The paper examines the roles of experts, elected officials, and the general public in these efforts. The paper is in four parts: (1) this introduction; (2) a look at efforts to set measurable goals for environmental quality and to define useful benchmarks or indicators of success; (3) a look at state science and technology (S&T) programs as they relate to environmental problems; and (4) a discussion of the relationships between environmental goals and goals for environmental S&T. The appendix includes excerpts from state and local publications on these topics.
A note of caution: this paper is the product of interviews with numerous leaders in the field, but it is not a survey of the 50 states and the numerous institutions within each state that are involved in environmental planning and science and technology development. Thus the paper does not touch on many of the exciting and innovative programs under way around the country.
The Carnegie Commission's report Enabling the Future1 describes one of the nation's social and environmental dilemmas: a kind of massive market failure that inhibits the country from securing the environmental quality Americans want for the future. Individual firms have to focus on the next quarter's bottom line; governors and legislators must respond to today's crisis or political fad and risk the voters' ire if they spend money on problems that do not yield results before the next election. State regulators are slightly insulated from this pressure, but receive their funds from legislatures and many of their marching orders from the U.S. Congress or the U.S. Environmental Protection Agency. Even academic scientists' work is often driven by the availability of research funds, which in turn may reflect today's crisis. Most of society's incentives reward short-term fixes and leave many difficult and obscure long-term problems unaddressed.
Enabling the Future lists three contexts in which explicit goal-setting activities may help the nation: to respond to a crisis, such as a disease, military threat, or failure to remain economically competitive with other nations; to provide a more coherent and efficient direction for particularly complex issues such as energy policy; and "perhaps the most difficult to respond to…situations in which
important needs or problems are clearly seen by some (for example, some part of the S&T community or a public interest group) but are not universally recognized, and there is no consensus on the seriousness of the problem or on how to address it. The current question of how to respond to predictions of global climate change may be an example of this.''
Enabling the Future stresses the importance of linking technology goals to societal goals that go deeper than the pervasive goal of creating new jobs. A companion report, Science, Technology, and the States,2 notes that this is difficult: "Partnership between government, industry and academia requires consensus about broad issues. Few states have a formal process for developing such views." Nevertheless, states and communities are using a variety of planning and goal-setting approaches to move public investments and policies in more thoughtful directions. All of these efforts start with the premise that strategic decisions based on some modicum of data, analysis, and thought will yield better results than would the political system if it were left alone.
STATES' GOALS FOR THE ENVIRONMENT
After more than two decades of federal dominance of the environmental policy agenda, states are beginning to reassert their role in setting goals and priorities for environmental quality within their borders. State environmental agencies have assumed greater responsibilities as they have developed additional technical and legal capacity.3 Three approaches to setting priorities and implementing a strategic agenda are capturing state attention: (a) comparing the risks posed by environmental problems and comparing the efficacy of alternative strategies for risk reduction; (b) tracking environmental "indicators" and publishing them in annual "state-of-the-environment" reports; and (c) setting measurable environmental goals and tracking progress toward them.
Together, these three approaches have the potential to help states and cities focus on serious problems, track the problems and the jurisdiction's effectiveness at dealing with them, and provide the impetus for corrective actions that will keep the state or city moving in the chosen direction. Most of the environmental agencies using these approaches have integrated them into a public education/public involvement strategy. The reports and indicators are designed specifically to give voters the technical information they need to make more informed choices about environmental priorities and policies and to bolster the connection between the public and their agencies. Some states have tried one or two of these approaches; several states have linked all three. The combination of the three approaches could approximate the kind of consensus-building forum envisioned by the Carnegie reports, and could strengthen the incentives for the S&T community to address serious longer-term problems.
Comparative Risk Projects
The U.S. EPA has financed more than 40 state, local, and tribal comparative risk projects. In them, participants collect the best data available about a wide range of environmental problems, then draw conclusions about the problems' relative seriousness. The task builds on EPA's risk assessment methods and technical data bases. People familiar with EPA's Unfinished Business and Reducing Risk4 projects may remember that the act of ranking environmental problems is problematic: the data are typically poor and participants must make difficult value judgments when comparing the seriousness of dissimilar risks, such as the effects of exposure to lead paint, the effects of exposure to ground-level ozone, and the potential effects of global climate change. EPA's original comparative risk projects were conducted largely by technical staff for internal consumption. States and cities have transformed the process into externally focused partnerships engaging scientists and non-scientists alike.
A typical comparative risk project today includes one or more technical committees composed of state or city agency staff people, private-sector scientists, and academics. The technical teams typically do the homework for the projects: collecting data and analyzing the risks posed by specific problems. The technical teams may rank the problems or they may turn their findings over to an executive-level committee to rank. A public advisory committee or steering committee is usually composed of senior government managers and the leaders of essential stakeholder groups: representatives of business and industry, the Farm Bureau, environmental coalitions, other civic organizations, and elected officials. These multi-disciplinary committees are essentially a hard-working, well-read surrogate for the public at large: a diverse group willing to take the time to work through more technical material than public debates usually surface. The committees are designed to strengthen the technical quality of the product, the public legitimacy of the results, and the political impact of the change recommendations.
One product of the comparative risk projects has been a ranked list of environmental problems. In general, the states have tried to turn that list into the basis for strategic plans and budget choices. Some states have developed specific short-term and long-term strategies to address high-risk problems. Others have tried to use the risk information and estimates of the costs of various policy options to select the most cost-effective strategies for reducing risk. The Carnegie Commission, EPA's Science Advisory Board, the National Academy of Public Administration, and others have endorsed this process of priority-setting in a time of scarce resources.
The comparative risk projects have demonstrated that the nation has not yet found or implemented effective tools for addressing serious long-term problems such as climate change, habitat destruction, and indoor air pollution. Perhaps just as significantly, the projects have refocused policy-makers' attention on the external
environment rather than on internal bureaucratic functions. When analysts and agency staff members had to decide which problems were most serious, they discovered how meager their data were, how little most people really knew about environmental quality, and how little the technical staff knew about how the public valued different aspects of the environment. The embarrassing extent of these "data gaps," as practitioners call them, has inspired more rigorous attempts to measure environmental quality and trends.
Environmental Indicators
As government agencies have tried in the last few years to focus on measurable results, the demand has grown for more useful environmental data, particularly data that could help analysts, policy-makers, and the general public assess the quality of their environment. The ideal would be a relative small number of easy to measure conditions that would indicate the overall health of the environment. Although the ideal remains elusive, so many states and municipalities are compiling collections of information they find important that the approach is gaining sophistication and credibility—and possibly more credibility than it yet deserves. EPA has helped sponsor state efforts to establish environmental indicators; 25 states now have a formal environmental indicator project either in the planning stages or under way.5
Two states, Florida and Illinois, explicitly use their indicator data in policy and budget decisions. The Florida Department of Environmental Protection's "Strategic Assessment of Florida's Environment"6 (SAFE) project is now more than four years old and was one of the first state indicator initiatives. Updated in 1994, the SAFE system now has 87 indicators grouped in categories related to the 13 environmental problem areas evaluated in the Florida comparative risk project. (Sample pages from the SAFE report are included in the Appendix.) Illinois's "Critical Trends Assessment Project" is a large ongoing effort to map and track changes in the state's environment. The trends data have been compiled in a seven-volume technical report and made more accessible in a handsome 90-page summary.7
Eleven states have published or are drafting "state-of-the-environment" reports, which present to the public collections of environmental data and analysis, usually focusing on the significance of trends revealed in various indicators. Notable state-of-the-environment reports have came out of Washington, Florida, Maine, Kentucky, and Vermont. These reports are designed to convey information that should help policy-makers and voters understand broad issues and begin to think critically about priorities.
The state-of-the-environment reports are generally products of state pollution-control agencies, though many also include natural resource and habitat information. The process of selecting the indicators to report is usually managed by agency staff and thus rests on the expertise and values of the scientists, engineers,
lawyers, planners, public information specialists, and political appointees who comprise most agencies. The selection process involves many trade-offs and pit-falls because of the limits of technical understanding and data quality, and because of the value-laden aspects involved in deciding what is important enough to measure or report and at what level of aggregation.
Given the ambiguity in defining "environmental quality" and the limited understanding of the relationships among changes in environmental conditions, a vast amount of information is potentially relevant, or potentially misleading. Some state-of-the-environment reports are filled with data tables of significance primarily to experts. To meet an agency's goal of providing an informative document for the lay reader, however, many reports simplify the indicators, focusing either on only a few that are relatively easy to understand, or compressing numerous measures into a few aggregated indexes. The target audience for many of these reports is the state legislature, journalists, and the heads of the constituency groups who influence public opinion.
The state and federal employees working on environmental indicator projects are wrestling with the competing demands for technical integrity, objectivity, simplicity, and impact. Occasionally, a single indicator can meet all of these criteria, as does the famous "Bernie Fowler Sneaker Index," n named for the Maryland senator who annually leads crowds of waders into Chesapeake Bay to measure the clarity of the water, an indicator of its nutrient loading. The illustration below (Figure 1) shows how EPA's Chesapeake Bay Program used that indicator as an educational tool to explain why nutrients are a problem. The illustration also shows how an indicator can be used as the basis for defining a measurable environmental goal: in this case, making it possible for Bernie to see his sneakers in chest-deep water.
Environmental Goals and Benchmarks: Minnesota's "Milestones"
States and EPA are embracing the idea of adding a target or goal to the trend lines featured in the state-of-the-environment reports. These measurable environmental goals are gaining popularity as tools to help guide state policy. The first table in the appendix titled "State Activities: Comparative Risk, Indicators, and Goals," based on a table compiled by the Florida Center for Public Management under cooperative agreement with EPA,8 shows which states have started or completed these initiatives. The appendix also includes several pages from state reports showing indicators and goals at work.
Two state projects in particular have become models for numerous initiatives around the country: Oregon's "Benchmarks," and Minnesota's "Milestones." Minnesota Governor Arne H. Carlson initiated the Milestones project in 1991 with the assertion that "defining a shared vision, setting goals and measuring results will lead to a better future for Minnesota's people."9 According to the project's 1992 report, hundreds of Minnesotans contributed to the project's vision
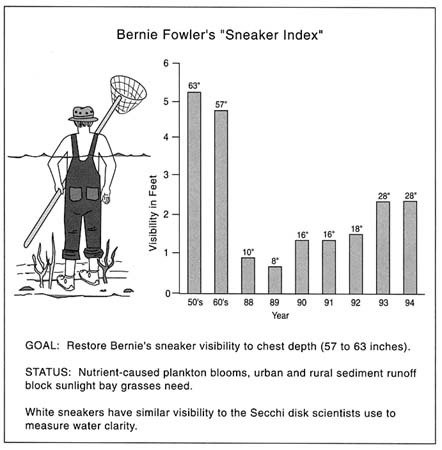
FIGURE 1 Bernie Fowler's Sneaker Index.10
statement and more than 10,000 participated in some aspect of the process. An advisory committee appointed by the governor played a significant role, but the process was essentially a populist one, designed to capture the public's values and ambitions and then provide a framework for motivating progress toward the goals.
The project adopted 20 broad goals on topics ranging from family stability to public participation in government. Each goal was defined in more specific terms by "milestones" or measures of progress toward the goal. There are 79 milestones in all. The goals and milestones that relate to the environment are listed in Figure 2. The text of the Minnesota report explains each of the milestones in a few informative paragraphs and presents specific numbers to show where the milestone had been in 1980 and 1990, and where the commission wants the milestone
FIGURE 2 Minnesota Milestones: Environmental Goals and Measures
|
Goal: Minnesota will have sustained, above-average, strong economic growth that is consistent with environmental protection. |
|
|
Milestone 37: |
Minnesota per capita gross state product as a percentage of U.S. per capita gross national product. |
|
Goal: Minnesotans will act to protect and enhance their environment. |
|
|
Milestone 55: |
Average annual energy use per person |
|
Milestone 56: |
Highway litter (bags collected per mile) |
|
Milestone 57: |
Total water use (billions of gallons per day) |
|
Milestone 58: |
Solid waste produced and recycled (in million tons) |
|
Milestone 59: |
Percentage of students passing an environmental education test |
|
Goal: We will improve the quality of the air, water and earth. |
|
|
Milestone 60: |
Air pollutants emitted from stationary sources (thousands of tons) |
|
Milestone 61: |
Number of days per year that air quality standards are not met |
|
Milestone 62: |
Percentage of river miles and lake acres that meet fishable and swimmable standards |
|
Milestone 63: |
Percentage of monitored wells showing ground-water contamination |
|
Milestone 64: |
Soil erosion per acre of cropland (in tons) |
|
Milestone 65: |
Toxic chemicals released or transferred (millions of pounds per year) |
|
Milestone 66: |
Quantity of hazardous waste generated |
|
Milestone 67: |
Number of Superfund sites identified and cleaned up |
|
Goal: Minnesota's environment will support a rich diversity of plant and animal life |
|
|
Milestone 68: |
Diversity of songbirds |
|
Milestone 69: |
Number of threatened, endangered or special-concern native wildlife and plant species |
|
Milestone 70: |
Acres of natural and restored wetlands |
|
Milestone 71: |
Acres of forest land |
|
Milestone 72: |
Land area in parks and wildlife refuges |
|
SOURCE: Minnesota Planning. Minnesota Milestones: A Report Card for the Future. St. Paul, MN. December 1992. |
|
to be in 1995, 2000, 2010, and 2020. For example, the targets for Milestone 55, average annual energy use per person, decline from 300 BTUs in 1990 to 234 BTUs in 2020.
These milestones reveal a range of scientific or technical bases. Number 61, the number of days that air quality standards are not met (and counterparts in other states, often expressed as a percentage of the population living in EPA-designated non-attainment zones), is based on National Ambient Air Quality Standards set by the EPA and derived from the technical resources available to the federal government. The NAAQS are ostensibly based primarily on the health effects of criteria air pollutants on humans (with no overt consideration given to the cost of attaining the standards), so the milestone comes as close as any to being science based. And the goal that the milestone defines—reducing the number
of days not meeting air quality standards to zero—could be called a risk-based goal derived from a social desire for healthy lives. The volume of litter on the highways, in contrast, defines a social goal that has no technical component, but expresses a desire for beautiful surroundings and shared respect for the environment.
Milestones that fall between these two extremes include energy use per person and diversity of songbirds. The significance of energy use, the Milestones report explains, is its contribution to acid rain, climate change, and nuclear waste. The statement of the indicator in personal terms (energy use per capita) is an implicit reminder that individuals have a role in meeting the targets. Diversity of songbirds, many of which are neotropical migrants, rests not only on habitat protection and chemical uses in the state but also throughout the hemisphere. The selection of songbirds as important indicators of change in biological diversity seems designed to touch a positive emotional chord in the public, and perhaps to illustrate the broader environmental connections between Minnesota and the rest of the continent. Thus each of these indicators attempts to connect the immediate concerns of Minnesota's citizens with scientist' understanding of local and global environmental problems.
The milestones define goals but they are silent on how the state or individuals should go about meeting them. For that, Minnesota has drafted other planning documents.
Soon after the publication of Minnesota Milestones, Governor Carlson and the state's Environmental Quality Board launched a new comprehensive planning process, the Minnesota Sustainable Development Initiative, which, in March 1994, produced Redefining Progress: Working Toward a Sustainable Future.11 Although a product of state government, the project was essentially in the hands of teams of non-government stakeholders and the general public. The initiative drafted reports on each of seven sectors important to Minnesota's economy, including forestry, energy, settlement, and manufacturing. The introduction to the report notes that the vision embraced in the Milestones report "served as a beginning point for the teams," though there are few other references to the milestones in the text. The goals in the report do not relate directly to the milestones. The energy sector report, for example, sets out a variety of strategies for improving energy efficiency and increasing the use of renewable energy supplies, but the text does not mention the Milestone's target for BTUs per capita.
Redefining Progress did something the Milestones report did not, however: it spelled out strategies for achieving its goals. The text called for developing "sustainable manufacturing" in the state, using techniques similar to those in other state science and technology plans. The report called for strategic alliances among government, business, and consumers, and pointed to several research and development needs. For example, the report recommended that government and business should "improve the ability to measure and quantify the cost of environmental effects to appropriately cost products," and "redirect public dollars to conduct
research on sustainable manufacturing processes and products and to identify other opportunities where needs can be met at lower social costs."
Staff members from several state agencies provided technical assistance to each of the sector teams, though neither the executive nor legislative branches was strongly represented on the teams. Some of the agency participants felt underused in the process.
Thus, it is perhaps no surprise that the Minnesota Pollution Control Agency has drafted its own strategic plan, Strategies for Protecting Minnesota's Environment.12 The November 1994 document is an internally produced document that lists four goals for the agency: fishable and swimmable lakes and rivers; clean and clear air; uncontaminated groundwater and land; and sustainable ecosystems.
The plan focuses on eight "strategic directions," including two for immediate action: (1) "developing indicators and risk-based priorities"; and (2) developing a "geographically based approach to environmental management (with emphasis on nonpoint sources of pollution)." The document lays out specific operational plans for achieving these two directions. Although the Pollution Control Agency's plan does not mention the Milestones report or adopt anything like the specific milestones as targets, both of the agency's priorities are designed to strengthen the type of performance-based management approach that Milestones envisioned.
(The agency's strategic directions also include "environmentally sustainable economic development"—an unusual statement in a state regulatory agency publication—and "partnerships and intergovernmental coordination.")
Unlike the Milestones and Redefining Progress reports, the agency's strategic plan faced an immediate test in the legislature, which through the budget process did in fact support the agency's proposals for short-term work, including a proposal to conduct a somewhat abbreviated comparative risk project.
These snapshots of Minnesota's efforts to bring coherence, clarity, and continuity to its public policies would look familiar in many states. Even the multiplicity of reports coming out of Minnesota is familiar: three sets of actors produced three reports—within three years and under a single administration—with three formats, three sets of goals, and three sets of recommendations.
The Minnesota Milestones approach to goals and indicators is being adapted by many states; the attempt to bring stakeholders and experts together in the public eye to draft a consensus document about priorities and plans is now a standard approach employed by executive agencies, non-government organizations, and even some legislative branch institutions. The sponsors hope to overcome partisan conflicts, bring more technical knowledge into public deliberations than legislative hearings typically can, boost government's accountability to the public, motivate bureaucracies, and generate some genuine learning and agreement.
Public managers hope that by engaging the public in goal-setting exercises and then tracking progress toward the goals (through the indicators) the public will feel reconnected to the enterprises of environmental protection and be better
able to send useful signals to legislators about spending and priorities. State agency officials also hope that the goals will encourage more consistency in policy and spending over the years, moderating the typical swings in policy that develop from daily crises and political transitions. Governors seem to like to initiate big goals projects because they appear to offer some hope of leaving a lasting imprint on the state.
EPA's Office of Policy, Planning and Evaluation is trying to do the same thing with the national environmental goals project and for roughly the same reasons. The project has many of the strengths and weaknesses of the state goals and indicator projects.
As Minnesota's experience showed, it is possible for a state to create a thoughtful, dynamic, and expansive forum for reaching consensus on environmental goals. Yet, even when thousands of people participate, many more thousands do not, adding to the difficulty of maintaining sufficient public attachment to the goals for them to influence decisions over time. That challenge is heightened when the forum attacks a broad range of issues and treats each of the resulting goals or milestones with equal importance.
Setting priorities among goals—and acknowledging that some may be mutually exclusive—is difficult, in part because goals are abstract until they are reduced to the specific investments, regulations, or activities that will actually lead to their attainment. In the goals and indicators projects described above, it is only at this last step that the legislatures have become fully involved. When real money is at stake and when decisions get close to home, the strength of the information-based, consensus-building process is put to the test.
Government gets closest to home at the municipal level, and several cities have developed some experience with environmental goal-setting.
Seattle: Environmental Goals at the Community Level
Seattle has had one of the nation's strongest environmental planning programs over the last decade. Its experiences illuminate some of the strengths and limits of the endeavor.
The City Planning Department conducted a ground-breaking comparative risk project in 1991. Technical advisory committees composed of city officials and others from business, nongovernmental organizations, and other government agencies analyzed the city's environmental problems and ranked them in terms of the risk they posed and in terms of the priority the city government ought to place on addressing them. (See the last table in the appendix.) The mayor and city council used these rankings and the underlying data when crafting subsequent budgets. The city incorporated much of this priority-setting work in its current comprehensive plan.
J. Gary Lawrence, who for five years was head of the Seattle Office of Long-Range Planning and who now teaches at the University of Washington, said that
the comparative risk process was extremely valuable because it brought together agencies, citizens, and organizations to focus on the city's problems and to agree on what matters, what goals the city wanted to achieve. The mayor and city council adopted some of the recommendations in subsequent city budgets. The technical committees agreed that the number-one risk and the number-one priority was the automobile's contribution to both air pollution and runoff to surface waters. The people of Seattle took that ranking seriously enough to invest in planning an $8 billion, three-county commuter rail system. After lengthy debates about the technical merits of the proposed system, voters recently rejected the proposal.
The story is a reminder that it is possible for a fairly representative group to agree on the nature of a problem, agree on a general goal, and disagree on specific strategies to achieve the goal, even when the strategies appear perfectly rational and well founded. Public opinion—and hence, public policy—will never be rational, although both can be better informed. The conflicts that arise when a public process frames problems carefully can foster useful public learning, though the line from goal-setting to strategy and implementation will not be straight or simple.
Out of the Seattle comparative risk project flowed an ambitious comprehensive planning process, and more recently, "Sustainable Seattle," an entirely volunteer effort to strengthen the community from the inside. Sustainable Seattle has adopted indicators of success similar to Minnesota's, though with an additional community-building aspect: one indicator of the city's sustainability is how many neighbors each individual knows by name. The participants in Sustainable Seattle include many of the people, companies, and organizations who were involved in the formal city government efforts. Here, as in Minnesota, the personal connections and learning that these processes establish endure beyond the process and probably contribute more to decision-making and the incorporation of technical expertise into policy than do the committees' formal plans and reports.
STATE INITIATIVES IN ENVIRONMENTAL SCIENCE AND TECHNOLOGY
"Green Business"
Across town, as it were, states have been increasingly active in setting goals and policies for the cooperative development of environmental technologies and focused environmental research. As noted in Enabling the Future, solving the nation's long-term environmental problems will require a long-term effort to understand the problems and to develop appropriate technological tools to mitigate, eliminate, or solve them. Several states have responded to that challenge as a market opportunity: a way to create jobs while contributing to the general well-being of the nation and the world. Their efforts have been more opportunistic than goal driven, however. States appear to be setting up processes to identify and
promote technological ''winners," rather than focusing on the problems that most need to be solved.
This environmental focus is a relatively new and small twist to a well-established set of public-private institutions that have attempted to stimulate economic development—more jobs and more income—through partnerships involving universities and research institutions, financial institutions, public agencies, public funding sources, and existing companies. Although relatively few states have specific environmental science and technology programs, every state has some kind of technology program. These are catalogued in some depth in a 641-page volume published in 1995 by Battelle, Partnerships: A Compendium of State and Federal Cooperative Technology Programs. In 1994, the 50 states "reported 390 discrete technology-based development initiatives, with annual expenditures of $385 million."13
The Compendium's criteria for including a program among its pages are significant: "To be included, programs needed to demonstrate that there was an ongoing connection with state government …, that they involved either a government-industry or government-industry-university partnership, and that the programs had as a primary goal the use of technology to enhance economic growth." The last criterion is a reminder that the environmental S&T work has been pursued, in most states, by economic development offices or technology offices, often with little connection to the environmental regulatory agency leaders.
The dual promise of economic prosperity and environmental gains has inspired states to add environmental S&T to their technology programs. The National Governors' Association published a useful report on the topic, Cultivating Green Businesses,14 in 1994, which prominently repeated estimates that by the year 2000 the global market for environmental technology would total between $300 billion and $400 billion. States, particularly those with both a relatively green tradition and a high-technology infrastructure, had already begun to develop strategies for securing a piece of that market.
States have typically used the approaches recommended in the NGA report, and they bear striking differences from the approaches recommended in Enabling the Future. NGA recommends that states start by inventorying their existing environmental technology companies, determining what barriers inhibit their expansion, and identifying barriers to innovation. States then should respond accordingly with programs to help these firms grow. As the cases below illustrate, states typically work with their major traditional industries to promote innovation that may have secondary environmental benefits. In contrast, Enabling the Future recommends starting with a definition of an environmental problem that needs to be solved and then refining and implementing a long-term S&T goal to address it.
Massachusetts, for example, focused its attention on the potential for environmental S&T development in April 1993 when the Executive Office of Environmental Affairs published Green Businesses: A Profile of the Massachusetts
Environmental Industry. The report's recommendations did not suggest that the state effort should focus on any particular environmental problems. Rather, the report recommended steps the state could take to facilitate the expansion of the whole industry and accelerate the transfer of ideas from the state's extraordinary research institutions to the marketplace. These steps were similar to those the state would use in any other aspect of technology promotion: improve access to financing and markets; expedite and simplify the permit process to reduce delays and uncertainty; train the work force and bolster public education more generally; and foster the growth of trade associations to promote common interests. To follow through on the original report, state agencies and the University of Massachusetts established the Strategic Environmental Partnership in the fall of 1993, and Governor William Weld established the Massachusetts Envirotechnology Commission. 15
Meanwhile, the state's Forum for Innovative and Alternative Technologies recommended the adoption of a strategic plan that would, among other things, lead to the establishment of "envirotechnology centers" at universities. Such centers have been major components of state S&T programs for many years. In 1984, New Jersey created the Hazardous Substance Management Research Center, which brings together several universities and some 34 industrial sponsors to research projects in six areas: incineration; biological and chemical treatment; physical treatment; site assessment and remedial action; health-effects assessment; and public policy and education.16
Barriers and Opportunities
The New York State Science and Technology Foundation (established in 1963) has helped to finance numerous university-based Centers for Advanced Technology, but none in fields directly related to environmental protection. The Compendium lists 13 foundation-sponsored centers, including centers for ceramic technology, materials processing, biotechnology, and automation and robots. As befits a rapidly changing economy, the list changes over time. Funding for each center periodically sunsets and must be renewed. In the process, the foundation has canceled those that fail to perform. The foundation invites universities to compete for the funds to establish these centers.
The foundation's former executive director, Graham Jones, said in an interview that he had tried to encourage applications for a center to focus on pollution prevention and environmental mitigation through innovative industrial chemical processes. He found no takers, despite the apparent social need and commercial value of advances in the area. He speculated that a fear of becoming encumbered with government requirements may be particularly strong among the private-sector experts in industrial chemistry. The decades-old divide between the regulated community and its regulators also discourages state agencies from taking mutually beneficial initiatives with firms. Graham said that a New York-based firm
had created an etching process that eliminated the use of CFCs in some manufacturing work. The state's regulatory agency declined to help the foundation promote the firm's accomplishment for environmental technology because of the regulator's reluctance to show favoritism to particular firms.
A current spokesman for the New York S&T Foundation said he wasn't sure why the foundation had made no special focus on environmental S&T, since it had taken on other social problems including technology for the physically disabled. He theorized that the foundation was content to let the state regulatory agency drive environmental policy and technological investments. Graham also noted the foundation's belief that the regulatory agency had more money and the potential to have more of an impact on environmental technology than the foundation could.
The relationship between the foundation and the executive branch became particularly clear following the change of administrations in New York in early 1995. Despite the foundation's relative autonomy from state government, the governor's office remains an important source of goals and direction. As of July, the new administration had not yet set its course for science and technology—except to announce the likelihood of downsizing existing programs. An official in the New York Department of Environmental Conservation said that the new administration had scrapped an effort by the previous administration to have the department work cooperatively with the state's commerce agency on environmental goal-setting. The administration is now trying to establish its own process.
The nation's smaller states are rushing to establish technology programs and several have included environmental technology in their initial plans. Vermont, which only last year formed a formal Technology Council, now has a Science and Technology plan, which calls for the creation of four Centers of Excellence, including an environmental science and analysis center. The plan includes a mission statement for the proposed center, calling on it to focus on issues that might include pollution prevention systems and monitoring technologies; sustainable agriculture; recycling and recycled products; energy conservation; environmental services, including monitoring and analysis; and sustainable forest ecosystem management and forest product manufacturing.17 Other small states, including Maine and Montana have developed similar approaches, often building on the personal and institutional connections established over their years during the state's participation in the National Science Foundation's Experimental Program to Stimulate Competitive Research (EPSCoR).18
California maintains an astonishing array of science and technology programs, partnerships, and research centers, many of which relate to environmental protection. Of them, the most relevant to this discussion may be the California Environmental Technology Partnership (CETP), which Governor Pete Wilson created with an executive order in 1992. The partnership is jointly managed by the California Environmental Protection Agency (Cal/EPA), the California Trade and Commerce Agency, and the Environmental Technology Council, an advisory
committee made up of more than 70 representatives of industry, government laboratories, and government agencies, and academics. The advisory committee prepared a 10-year strategic plan in 1994 and an update in 1995,19 which include the following goals:
-
Provide for consistent testing and demonstration processes for new environmental technologies, and increase the certainty of acceptance in broader markets.
-
Enhance the credibility, status and access to the marketplace of environmental technology companies through establishing strategic partnerships.
-
Increase California's share of the national and international markets for environmental technologies, products, and services by augmenting domestic marketing efforts and expanding export assistance services.
-
Develop and implement a comprehensive, integrated communication strategy for regularly providing California environmental companies with information that is advantageous to their business success.
-
Establish California as the best place in the world to test and demonstrate environmental technologies.
-
Encourage and support research and development of new California environmental technologies.
Again, these goals relate to the process of technology development and diffusion, not to specific societal goals for the environment or specific high-risk environmental problems. Cal/EPA completed the nation's most technically sophisticated statewide comparative risk project in 1994, but the project's findings do not appear to be reflected explicitly in CETP activities. The types of problems addressed in the comparative risk project, however, do feature prominently in the objectives and specific strategies listed in the strategic plan. For example, the plan calls for the completion of studies of new pesticide spray technologies that may reduce health risks to applicators. The plan also recommends that the state commit itself to purchase ultra-low emissions vehicles to help create a strong market for clean cars.
The plan identifies one issue as Cal/EPA's highest priority: implementing a first-in-the-nation technology certification program "to verify and certify performance of specific environmental technologies and to facilitate permitting." The certification program was authorized by legislation passed in 1993.
Cal/EPA's 1995 update of the CETP strategic plan was published in tandem with the 1994 Year-End Report which tracked progress against the objectives published in the 1994 plan.20
CETP is just one of many California initiatives likely to have some impact on the environment. Indeed, CETP is not even mentioned in Battelle's Compendium section on California. The section does, however, describe the California Council on Science and Technology's "Project California," an attempt to "develop globally competitive, high-technology clusters of transportation businesses
in California. Project California's primary mission is to create long-term, high-value-added jobs for Californians while enhancing the state's strong commitment to reducing environmental pollution and urban congestion." The quest for the ultra-clean car is also being motivated by regulatory agencies in the state, most notably the Southern California Air Quality Management District.
Meanwhile, an official in the California Governor's Office is focusing on a very different set of goals for environmental science and technology: natural resource issues and critical habitats. As part of the state's efforts to help regions and communities prevent conflicts between humans and endangered species, the state is developing CERES, the California Environmental Resources Evaluation System, which will put large amounts of place-specific environmental data on the Internet so that anyone can learn about local, regional, and statewide conditions. The information is intended to do what other state indicator programs hope to accomplish: make users more aware of trends and the choices individuals or communities can make to influence the trends.
The state's Natural Communities Conservation Planning effort has also established goals in an entirely different format from those described above. After conducting a biological survey of nearly 6,000 square miles of southern California, scientists have published maps showing critical habitat areas that ought to be managed to maintain the diversity of species. The maps translate the somewhat abstract environmental goal of maintaining biological diversity into a set of maps that can guide land acquisition programs and community growth management plans. Another of the goals of the project is to avoid the kind of rigid restrictions on land uses that may result from triggering the Endangered Species Act's protection.
When Goals Need Updating
The emphasis in virtually all of the technology plans described above is on building processes and networks that will be capable of launching an innovative idea into the marketplace as soon as the marketplace demands it. This capacity for opportunism requires systems that are dynamic and capable of change.
Pennsylvania oversees an environmental technology program in need of change because its original mission has lost its relevance in the market. In 1988, the Northeast was becoming increasingly concerned about a solid waste crisis: landfills were filling up and incinerators were being shut down. The Pennsylvania Legislature responded with a statute that required municipalities to recycle glass, paper, and yard waste. The statute also dedicated part of a solid waste tipping feet to an "Environmental Technology Research and Development Fund," which would provide grants to stimulate the recycling industry through the development of new recycling processes and markets. As part of the Ben Franklin Partnership Program, the grants were administered by the state's Office of Technology Development.
Bill Cook, chief of the research grants division, which manages the fund, said that the effort has produced some successes, but the number of good proposals for grants (up to $ 100,000 apiece for each of three years) has dropped in recent years because the fund can only be used to finance projects dealing with materials collected at curbside. The Department of Commerce wants to expand the list of materials to encourage more innovative proposals with potentially greater environmental and commercial benefits.
ISSUES AND THEMES
State Politics and Policies
States are often called the laboratories of democracy because state governments are generally more responsive to voters and hence more innovative than the federal government. The relative speed with which states have developed indicator programs, benchmarking systems, and environmental technology programs attests to the states' ability to build new systems quickly. Of course, the flip side of responsiveness is volatility: in innovation is instability.
With most changes of a governorship or the parties' control of a legislature comes pressure to throw out or reconstruct the predecessors' initiatives. Before leaving office, Washington Governor Booth Gardner described his administration's "Washington Environment 2010" risk-based priority-setting process as one of his proudest legacies. But his successor dismantled that effort and built something new to achieve similar objectives.21 The new approach appears to be as strong and effective as any of its counterparts, through that is no assurance that it will—or should—last beyond the governor's term.
Because of the vicissitude of public opinion, government programs and priorities are often whipsawed by crisis and fads. Depending on the type of program, managers may use different administrative structures and approaches to achieve some longer-term stability.
Environmental regulatory agencies face the challenge of keeping their resources focused on particular problems, which may go in and out of fashion with the legislators who control their annual appropriations. To foster stability in state environmental protection goals, many administrators have turned to collaborative processes like Minnesota's milestones and sustainable development efforts. Managers may hope to accomplish at least three things by engaging state employees, academics, business representatives, and the general public in a goal-setting process:
-
to build a public constituency for the agency's goals;
-
to effect a lasting change in the public's understanding of the environment; and
-
to effect a lasting change in the agency's understanding of its challenge and of the public's values and goals.
The indicators and benchmarking programs are specifically intended to maintain links among the agency, the public, and the environment itself and thus foster continuity and continuous improvement.
Cooperative technology programs are generally more insulated from direct legislative control. Legislatures must approve investments in technology funds or in the research capacity of state universities, but these funds are then typically managed by committees or trustees with more policy discretion than is available to typical state bureaucrats. This insulation from detailed budget scrutiny ought to make it easier for technology programs to maintain a longer time horizon than a regulatory agency. Graham Jones of the New York Science and Technology Foundation noted the limits of that freedom. The foundation staff tried to do careful planning and to explain its goals to its board and relevant policy-makers, yet the foundation was nonetheless very much constrained by those programs passed and funded by the legislature.
Bill Cook of the Pennsylvania Office of Technology Development observed that other states' technology programs seem to be constantly starting over. It takes at least five years for a research program to show results and few are able to withstand the political pressure to produce quickly, he said. Cook's own dilemma with the recycling program shows another approach to achieving stability: financing a technology program through a special fund (a tipping fee), which can keep on generating cash without much annual review and take the pressure off the program to justify itself each year. (Similarly, the federal Superfund program has acquired much of its stability from its financing insulation from the rest of the Environmental Protection Agency's budget.)
In contrast to Cook's sense that most state S&T programs are politically tenuous, the authors of the Compendium reached a somewhat different conclusion:
Despite the fact that there is no traditional, organized constituency for science and technology at the state level, state programs have nonetheless survived transitions in party control of statehouses and legislatures, state fiscal crises, external performance reviews, and changes in program management. Even in states that have made dramatic cuts in funding, the commitment to cooperative technology has proven tenacious. For example, in the early 1990s Illinois cuts its $20-million-per-year program by 95 percent; today, at the insistence of the business community, it is weighing a plan to restore many of those services. Increasingly, states see their economic future in growth generated internally through higher education and technology, not just in recruitment of industry from outside.22
If legislatures, governors, and the public view the primary function of technology programs as producing jobs, then success depends not only on developing a great idea but also on finding willing buyers in the market. These buyers may not be there. Almost by definition, the underaddressed long-term problems identified in Enabling the Future are those for which markets for solutions may not exist today. The kind of market failures that create environmental problems inhibit
their solution, absent some form of government regulation, intervention in the market, or public commitment. Unless an "environmental goal" or "environmental technology" goal is accompanied by regulatory action, the goal may remain elusive. This is why the apparent division between environmental regulatory agencies and environmental technology programs may be a problem.
Linking Goals, Regulation, and Action
Regulations can create markets. If the cost of disposing of wastes in accord with RCRA rules is high, firms will search for less expensive ways to treat, reduce, or prevent their waste. Cooperative technology programs favor emerging technologies that will fit into niches created by regulatory standards because the markets are well established. State technology programs have capitalized on these regulatory-driven markets even when they did not have technology programs specifically dedicated to environmental problems.
Different regulatory approaches will have different impacts on technological innovation. EPA's traditional regulations have often had the result of establishing a particular technology as the norm for many years while inhibiting further innovation. As many economists have maintained, market incentives of many types could reduce the aggregate costs of environmental controls while encouraging technological innovation. This message has not been lost on the states. Illinois has recently created a market for tradable air pollution permits and expects to save industries millions of dollars while reducing pollution levels. Nevertheless, relatively few states have aggressively pursued market approaches to environmental risk reduction, and the topic rarely surfaces in the numerous technology plans consulted for this paper.
Many policy-makers23 are calling on the federal and state governments to rely more on performance standards than technology design standards to control pollution. In a performance-based system, firms, cities, or even whole states would be told how much they may pollute and then given broader latitude than today in deciding how to achieve the standards.
EPA and state environmental agencies are using the same idea to redefine their oversight relationships. Under the "Performance Partnership" program adopted in the spring of 1995 by the states and EPA, EPA will back away from some of its more prescriptive process-oriented requirements and instead focus on the overall performance of the state in protecting the environment. The approach will require states and EPA to agree on performance measures—including environmental indicators as described above. Each state and the federal government will be negotiating on short-term environmental goals as defined by the indicators and performance measures they select. In these negotiations, the experts within the agencies will clearly dominate the selection process, though the growing reliance on indicators should gradually open the regulatory arrangements to public view.
In addition to these relatively obscure changes in environmental regulation, much of the nation at this writing is expecting the new Congress to pass regulatory reform legislation and to make significant changes in the nation's major environmental statutes. Some see this shift as one reason for significant weakness in the environmental technology industry. One trade paper concluded a story called "Envirotech Firms Can't Sit on Green Laurels" with the assertion:
Another nail in the coffin of environmental technology firms has been the specter of changing environmental regulations, which fuels insecurity in the industry. Federal air pollution laws had called for certain cities with high pollution levels to start enhanced testing of cars' tailpipe emissions. But when local legislators decided they didn't want citizens who elected them to be forced to spend money testing their cars, the Environmental Protection Agency eased the rules and said localities could reduce pollution another way24.
This single paragraph captures the interactions of public opinion at the local and national level, regulation, political action, technological change, and the market. The example illustrates the tenuous nature of environmental goal-setting in America, which sometimes proceeded without sufficient public understanding or commitment to be sustained. In the case of automobile Inspection and Maintenance Programs, EPA has been unable to convince many angry car owners that mandatory tailpipe inspections are an economical way to reduce air pollution in their cities. Without the social commitment to submit to inspections, the technology of tailpipe monitoring was useless.
Experiences of states and communities suggest that setting goals for the environment is useful if it helps people focus on problems and discover a shared commitment to solving them. The very conditions that make explicit goals important—society's tendency to ignore problems and to delay action—make the goals difficult to attain. When the immediate steps required to attain a goal are unpleasant, expensive, or uncertain, individuals, firms, and governments can always find a good reason to avoid taking action. Almost every government effort to set goals will also suffer from the related dilemma of involvement: too few people will set the goals and too many will have to pay in some way to achieve them. The imbalance in that equation is one reason goals are difficult to attain.
The challenge of showing people what they are buying for their investment—what type of progress they are making toward their environmental goals—may be easier at the community and state level than at the federal level because the changes are closer to home. The people who live in the Chesapeake Bay watershed will feel a stronger sense of commitment to the Bay than would people who live elsewhere. Environmental goals and indicators set by collaborative processes at the state and local level thus have a chance of motivating action on the local and state levels. To address the bigger problems, however, the ones that cross boundaries and generations, higher levels of government will have to act.
In virtually all cases, the value of the goal rests not in its minimal potential to
bind unwilling parties to honor a long-term commitment. Few goals have this kind of binding power. Rather, the value of goals appears to arise from the process that creates them. That process requires groups to learn about problems and agree on the desirability of change. As states and communities continue to experiment with benchmarking efforts and environmental performance measures, that learning should expand and deepen, influencing, in turn, the nature of goals for environmental science and technology.
NOTES
APPENDIX
EXAMPLES FROM STATE AND LOCAL PROJECTS AND PUBLICATIONS
-
States engaged in comparative risk projects, environmental indicators projects, and goal-setting or benchmarking projects, from "Information About Using Environmental Indicators in U.S. EPA/State Performance Partnerships," report prepared by the Florida Center for Public Management, Tallahassee, Fla., 1995.
-
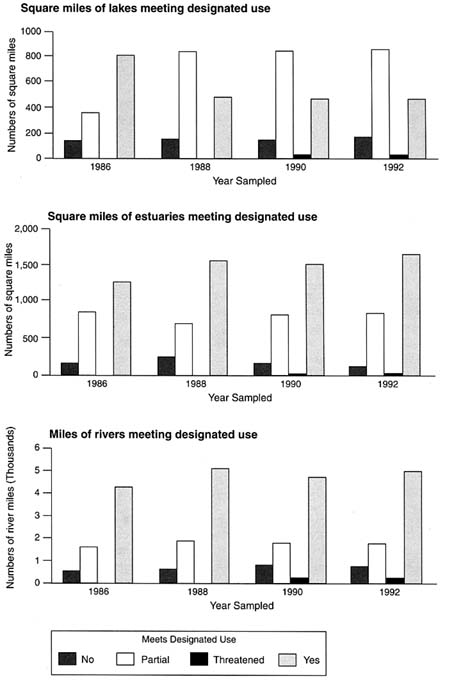
"Miles of Waterbodies Meeting or Exceeding Designated Uses," from Strategic Assessment of Florida's Environment (SAFE) , published by the Florida Department of Environmental Protection, Tallahassee, Florida, November 1994.
-
"Vermont Indicators: Waste," from Environment 1995: An Assessment of the Quality of Vermont's Environment, published by the Vermont Agency of Natural Resources, Waterbury, Vermont, 1995.
-
"Chapter 6: Prairies," from The Changing Illinois Environment: Critical Trends, Summary Report of the Critical Trends Assessment Project, published by the Illinois Department of Energy and Natural Resources and The Nature of Illinois Foundation, Springfield, Illinois, 1994.
-
"Rankings of Air Issues," from Environmental Risks in Seattle, A Comparative Assessment, published by the City of Seattle, Office for Long-range Planning, Seattle, Washington, October 1991. (The report also included rankings for water issues, land issues, and cross-media issues.)
STATE AND LOCAL GOALS: APPENDIX
State Activities: Comparative Risk, Indicators, and Goals
|
State |
Comparative Risk in planning (P) under way (U) or completed (C) |
Indicator Project in planning (P) under way (U) or in action (A) |
State of Environ. under way (U) or completed (C) |
Goals/Benchmarks under way (U) or completed (C) |
|
Alabama |
U |
|
|
|
|
Alaska |
P |
P |
|
|
|
Arizona |
U |
P |
|
|
|
Arkansas |
P |
|
|
|
|
California |
C |
U |
|
|
|
|
|
|
C (1995) |
|
|
Colorado |
C |
U |
|
|
|
Connecticut |
|
U |
|
U |
|
Delaware |
|
|
|
|
|
Florida |
U |
A |
|
U |
|
Georgia |
|
|
|
|
|
Hawaii |
U |
P |
|
U |
|
Idaho |
|
U |
|
|
|
Illinois |
|
A |
C (1994) |
|
|
Indiana |
|
|
|
|
|
Iowa |
P |
|
|
|
|
Kansas |
|
|
U |
|
|
Kentucky |
U |
P |
C (1992, 1994) |
|
|
Louisiana |
C |
U |
|
|
|
Maine |
U |
P |
C (1994) |
|
|
Maryland |
U |
U |
|
U |
|
Massachusetts |
|
P |
U |
|
|
Michigan |
C |
|
|
|
|
Minnesota |
P |
U |
|
C |
|
Mississippi |
U |
P |
|
|
|
Missouri |
P |
P |
|
|
|
Montana |
|
|
|
|
|
Nebraska |
|
|
|
|
|
Nevada |
|
|
|
|
|
New Hampshire |
|
|
|
|
|
New Jersey |
P |
P |
|
|
|
|
P |
P |
|
|
|
New Mexico |
|
|
|
|
|
New York |
P |
|
|
|
|
North Carolina |
|
P |
U |
|
|
North Dakota |
U |
|
|
|
|
Ohio |
U |
|
|
|
|
Oklahoma |
|
|
|
|
|
Oregon |
|
|
|
C |
|
Pennsylvania |
|
|
|
|
|
Rhode Island |
|
|
|
|
|
South Carolina |
|
|
|
|
|
|
|
P |
|
|
|
South Dakota |
|
|
|
|
|
Tennessee |
U |
P |
C (1994) |
|
|
Texas |
U |
|
|
|
|
Utah |
C |
P |
|
|
|
Vermont |
C |
U |
C (1994, 1995) |
|
|
Virginia |
|
|
|
|
|
Washington |
C |
U |
C (1995) |
U |
|
West Virginia |
|
|
|
|
|
Wisconsin |
P |
U |
C (1995) |
|
|
Wyoming |
|
|
|
|
|
SOURCE: "The Comparative Risk Bulletin," Vol.5, No. 5–6, May/June 1995. Northeast Center for Comparative Risk. South Royalton, Vermont; and "Information about Using Environmental Indicators in U.S. EPA/State Performance Partnerships." The State Environmental Goals and Indicator Project. The Florida Center for Public Management, Florida State University. Tallahassee. May 1995. Reprinted with permission. |
||||
MILES OF WATERBODIES MEETING OR EXCEEDING DESIGNATED USE*
Explanation of Indicator
Surface waterbodies are classified for their present and future most beneficial use by the Florida Environmental Regulation Commission under Chapter 62–302, Florida Administrative Code. Surface waters are classified as:
Class I—Potable Water Supplies;
Class II—Shellfish Propagation and Harvesting;
Class III—Recreation, Propagation and Maintenance of a Healthy, Well Balanced Population of Fish and Wildlife;
Class IV—Agricultural Water Supplies; and
Class V—Navigation, Utility and Industrial Use.
Each designated use has minimum criteria (both numeric and narrative) for various water quality parameters. Florida waters are sampled and various parameters tested to determine whether or not hey continue to maintain their designated use.
Source
The identification of waterbodies that meet, partially meet, and do not meet designated uses is in the Florida Water Quality Assessment , prepared to meet the requirements of Section 305(b) of the U.S. Clean Water Act. The data or the source of the data used to prepare the 305(b) report may be obtained by contacting Joe Hand, Florida Department of Environmental Protection, Bureau of Surface Water Management, at 2600 Blair Stone Road, Tallahassee, Florida 32399-2400, or at (904) 487-0505.
Data Characteristics
Data collection is ongoing and takes place at different frequencies, depending on the needs of the sampling program and on the responsible agency. The Florida Water Quality Assessment (CWA 305(b) Report) is produced every two years and provides a summary of waterbodies and maintenance of designate use. In 1994, 11,880 miles of streams were assessed (60 percent of these miles were assessed with recent, quantitative data and 40 percent were assessed with older data or qualitative information). The 5,648 square miles of lakes and estuaries were assessed and 70 percent of the miles were assessed with recent data with the
balance assessed with qualitative data. Water quality data is sorted according to reach areas (USGS hydrologic units) for locations that are sampled and which have water quality analysis data entered into STORET. Generally, data is available for areas near the state's more urban regions. Data becomes less available in more rural areas. This data is available on a computer disk or hard copy format and maps are available in the 305(b) report. There are no additional costs of acquiring these data which are obtained as a result of conducting ambient water quality monitoring activities. However, there may be copy costs associated with data retrieval.
Overall Assessment
The information used to evaluate whether a water body meets its designated use is the most complete and voluminous set of surface water quality data available. It is the same information used to develop trophic state index, trends, and water quality index. With more agencies continuing to participate in entry of data in STORET, the utility of the data base and the quality of future assessments will continue to improve.
This indicator is useful in assessing the general condition of state waters. Although the majority of the information is developed for the state's urban areas, it represents most of the state affected by pollution.
Data may not be collected with sufficient frequency to provide a valid information base for all areas. Much of the information being used is actually an average of reach values gathered at irregular intervals rather than individual sites sampled at comparable time intervals for specific parameters. When insufficient information is available to make a determination, or where recorded values conflict with local knowledge, professional judgment is exercised to adjust the assessment. Therefore, the use of this indicator is limited to STORET and 305(b) data limitations.
Analysis of Indicator
The number of river miles and square miles of lakes and estuaries that meet, are threatened, partially meet and do not meet designated uses is shown below for four two-year intervals corresponding to the periods covered by the Florida Water Quality Assessment. The 1986 data is not totally comparable with the 1988, 1990, and 1992 data. Rivers and estuaries do not show significant changes in meeting their designated uses during the period of record available. Lakes have shown a significant decline during this period. This may partially be attributed to the reclassification of a part of Lake Okeechobee which, when reclassified went from meeting designated use to partially meeting designated use. Threatened is a designated reclassification between "partial" and "yes" and was not used in 1986 or 1988.
WASTE
Waste is an inherent part of human activity. How much we produce and what we do with our waste, however, is very much under our control.
For most of this century, Vermont towns have operated dumps or landfills as centers for disposal of industrial as well as household waste. Over time, growing incidence of contaminated surface water, groundwater supply wells, and soils linked to these and other land disposal sites led to increased concern about waste management practices. In response, there are now stricter controls on the disposal of industrial and household hazardous wastes, and improved landfill design, construction, and operation standards.
While these changes have led to significant improvements in public health and environmental protection for Vermonters, solid and hazardous waste continues to be a serious problem facing the state. Recent increases in recycling and pollution prevention efforts by Vermont industries, governments, and citizens are promising responses to the state's waste problem.
Solid Waste
Over the last three decades, there have been significant changes in the way Vermont handles the solid waste it produces. Before 1968, open dumps and open air burning were common waste disposal practices. Unlined and uncovered, they posed significant public health risks and aesthetic degradation. The move to sanitary landfills in the 1970s reduced the most drastic health and aesthetic effects associated with open dumps, but still allow contamination of surrounding surface and groundwater.
Beginning in 1988, sanitary landfills were replaced with more protective lined landfills. Since 1991, 47 unlined landfills within Vermont have been closed. These closures, coupled with increased regional competition to provide solid waste disposal services for Vermont municipalities, have contributed to an increase in the amount of solid waste going to landfills or incinerators in neighboring states. The net effect has been a reduction in the amount of waste being disposed of in the older, less protective unlined landfills. In 1994, of the approximately 285,000 tons of waste disposed of in state landfills, only 20% (58,000 tons) were disposed of in unlined facilities.
As new landfills are constructed and operated by Solid Waste Management Districts in Vermont, the export trend is likely to reverse while continuing to offer significant improvements in public health and environmental protection to Vermonters.
Recycling continues to play a key role in reducing the amount of solid waste Vermonters send to disposal. Although there has not been a significant increase in the number of recycling facilities statewide, the number of towns adopting local recycling ordinances continues to rise. As a result, there has been a dramatic increase in the number of households and businesses participating in local recycling programs (Figure 1).
Hazardous Waste
In the 1950s, the town of Springfield opened its new landfill. Citizens were proud they had found a safe way to dispose of their industrial wastes. Today, that landfill is one of eight Superfund sites in Vermont on the National Priority List. Cleanup is currently under way with an estimated cost of $20 million.
The discovery of hazardous waste sites in Vermont has occurred steadily over the past 25 years. Many of these sites, such as the Springfield landfill, are the result of past disposal practices which, at the time, were considered safe and acceptable.
It was not until the early 1980s that Vermont become seriously concerned about the effects of hazardous waste releases. Since then, both the discovery and
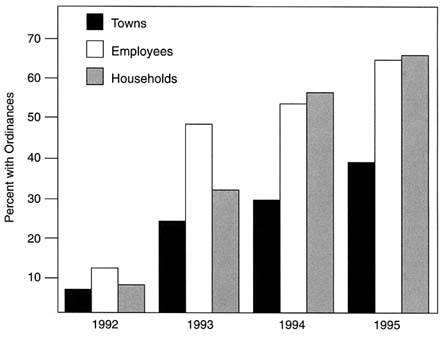
FIGURE 1 More towns have recycling ordinances.
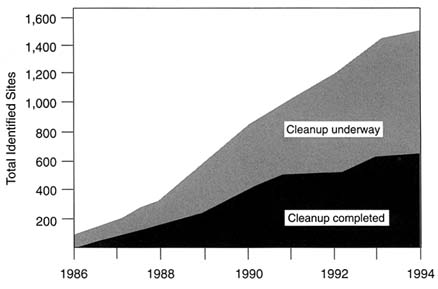
FIGURE 2 Waste sites in Vermont.
cleanup of hazardous waste sites in Vermont has steadily increased (Figure 2). By 1994, 1,499 sites had been identified in the state. Of these sites, 643 had completed cleanups with no further action necessary. An additional 856 sites are in various stages of investigation and cleanup.
Included in this total number of hazardous waste sites are eight sites (including six closed community landfills) that are on the National Priorities List as Superfund sites. Two of these sites have cleanups under way, three have proposed cleanup plans under sate and local review, and two have been found to not require cleanup under Superfund criteria.
A vast majority (74%) of hazardous waste sites in Vermont are from leaking underground storage tanks. The risk of an underground storage tank (UST) leaking is partly a function of its design characteristics. Older, single-walled USTs are more likely to leak and contaminate the surrounding soil and groundwater. The number of single-walled USTs has been steadily declining over the past eight years, dropping from 7,110 in 1986 to 3,367 in 1994-a reduction of over 50% (Figure 3), the number of safer double-walled USTs has increased over this same period from 37 to 1,245 as they replace the older, single-walled tanks. Overall, more than 2,500 USTs have been removed since 1986.
Although progress continues to be made, a number of Vermonters are still affected by contaminated drinking water caused by these hazardous waste sites. Since 1987, contaminated drinking water has been found in 25 public wells and 228 private wells.
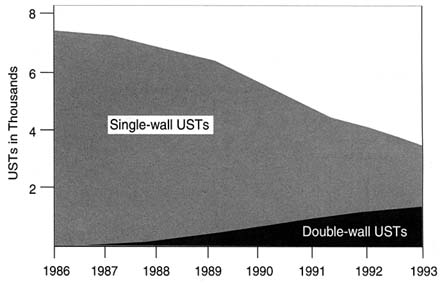
FIGURE 3 Fewer underground tanks.
Pollution Prevention Progress
Pollution prevention continues to be the preferred strategy to reduce the generation of hazardous wastes in Vermont. In Vermont, nearly 250 large and small quantity generators of hazardous waste are required to implement hazardous waste reduction strategies. In addition, beginning in 1995 Vermont companies using 1,000 pounds or more of a toxic substance per year must prepare toxic use reduction plans.
Data collected by the U.S. Environmental Protection Agency shows a significant downward trend in the release of toxic substances by Vermont facilities. The 1992 Toxics Release Inventory (TRI) indicates that since 1988, the 50 Vermont TRI reporters nearly halved the total amount of industrial toxic chemicals they released into the environment (Figure 4). In 1992, reporting facilities in Vermont reduced chemical releases by 13% from 1991 levels (compared with a national average decline of 6.6%). The 1992 TRI total ranks Vermont 52nd in the nation for toxic releases.
While the TRI data indicates that Vermont facilities are decreasing their release to the environment, it remains difficult to develop meaningful estimates of reductions in hazardous waste generation from toxics used and hazardous waste reduction plans submitted to date. The ANR is continuing its effort to encourage pollution prevention and to more accurately measure and monitor resulting toxics use and hazardous waste reduction.
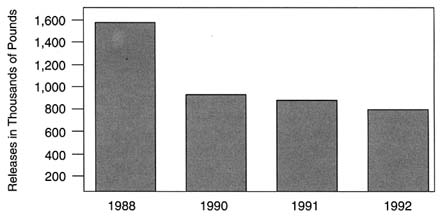
FIGURE 4 Toxic releases are down.
|
Challenges Waste generation can often be influenced by the decisions of individual consumers. To help reduce the volume and negative consequences of both solid and hazardous waste generation, Vermonters may consider the following: Practice Pollution Prevention. Buy durable goods that last longer, buy products with minimal or reusable packaging, give preference to products that are energy efficient and that are made from materials readily recycled in your community, and consider making deliberate choices to do without. Make informed buying decision to reduce toxics. Read product labels to avoid hazardous household products and use less toxic alternatives to commonly available paints, pesticides, automotive products, chemical cleaners, and polishes.] |
PRAIRIES
What wasn't forest or open water in presettlement Illinois was prairie. The exact extent of these grasslands is disputed, but its safe to say that in 1820 at least 60% of Illinois' land area was grasslands of one type or another.
Modern scientists recognize six main subclasses of prairie in Illinois. These are distinguished mainly by differences in soils and topography; further subdivisions based on soil moisture produce a total of 23 distinct prairie types in the Prairie State.
Flat terrain and deep loess soils made most Illinois prairies ideal for agriculture. The breaking of the Illinois prairies began in earnest with the invention in 1837 of a self-scouring steel plow both strong enough to slice through the dense mat of prairie plant roots and slick enough to slip through sticky loam soils. Vast stretches of prairie were destroyed between about 1840 and 1900. According to one account, the 60-square-mile Fox Prairie in Richland County was reduced from more than 38,000 acres to 160 acres of prairie between 1871 and 1883. McLean County once had 669,800 acres of prairie; today it have five of high quality. Champaign County once had 592,300 acres of prairie; today it has one of high quality. (Figure 1) Prairie remnants in such counties probably have escaped natural areas surveyors (especially along railroad rights-of-ways) but including them would still leave Illinois with only a very small number of acres of surviving prairie.
The Illinois Natural Areas Inventory completed in 1978 found that only 1/100 of 1% (2,352 acres) of high-quality original prairie survives. Most sites of relict prairie occur on hilly land along the northern and western edges of the state and other places where plows and bulldozers can't reach, such as wetlands, cemeteries, and railroad rights-of-way. Four out of five of the state's prairie remnants are smaller than ten acres and one in three is smaller than one acre. Of the 253 prairie sites identified by the inventory, four out of five are not protected as dedicated nature preserves.
|
Prairie in the Prairie State Is Disappearing
|
|
Illinois' Remaining Prairies Are Being Fragmented
|
Illinois prairie remnants are often less than one acre in size, and the entire local population of some plant and animal species may by only a few individuals. The smaller such local populations are, the more vulnerable they are. Extremely isolated populations of plants and animals can develop so-called inbreeding depression, or an inability to produce, especially if they are not wind-pollinated species whose widely dispersed seed gives them ample opportunities for cross-breeding with distant populations.
To date Illinois has few examples of inbreeding depression in its prairie preserves, although that may also reflect the lack of appropriate studies looking for it. Many prairie plants are long-lived, producing only a few generations per century, and thus are unlikely to quickly show the effects of inbreeding.
Because they tend to be inaccessible to the plow, hill prairies are among the last ''living windows" into the presettlement Illinois ecology. Illinois hill prairies hold only half the acreage they did 50 years ago. Without periodic fires to check their growth, woody species invade hill prairies from adjacent lands. Comparing aerial photos from 1940 to the present shows that Revis Hill Prairie has decreased in size from 39.2 acres in 1939 to 17.4 acres in 1988.
The tallgrass prairie (where it survives) is a nitrogen-limited system, meaning that the exuberant growth of grasses and other plants consume most of the nitrogenous nutrients in the soil. This chronic nitrogen shortage helps prevent plant species not adapted to it from invading the grasslands. However, supplemental nutrients can enter prairie ecosystems in various ways and in various forms and are likely to alter their species composition.
Nitrate and ammonium compounds are delivered from the air by both wet and dry deposition. Total nitrogen deposition on Illinois soils through most of the 1980s ranged from 17 kilograms per hectare per year to less then ten in the Chicago area; nitrogen pollution from runoff and groundflow is locally even more concentrated than that from the air. Prairie plants have been shown to vary in their ability to capitalize on atmospheric carbon dioxide, another nutrient, which some experts expect to double during the next century.
|
Prairie Ecosystems Face Extirpation in Illinois, although Few Prairie Plants Do
|
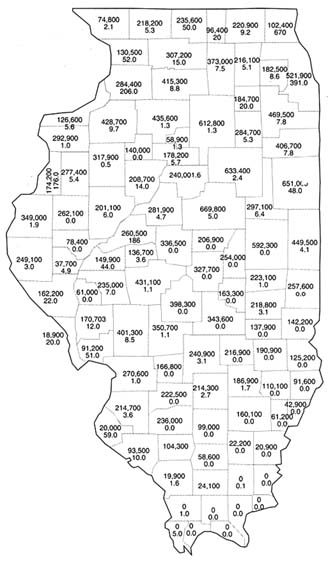
Plants
The number of "prairie species"—those plants capable of living at least part of their life cycle in that habitat—is quite large. The Illinois Plant Information Network counts 851 species of plant native to Illinois prairies. However, by no means do all of these occur in any one site. More than 100 species are seldom found in any one prairie, although (as is true of forest land) the larger patches are host not only to more plants, but to more kinds of plants.
Of the 497 plant and animal species considered endangered or threatened in Illinois as of 1993, 117 occur in prairies. Because nearly all species found in prairie occur in other states, or in habitats other than prairies, there are few species endemic to the Illinois prairie ecosystem.
Because of the peculiar conditions under which many Illinois prairie remnants survive, they are vulnerable to peculiar threats. Plants native to blacksoil prairies of the sort that flourish atop undisturbed country graveyards are being overtaken by non-native species planted by mourners as landscape ornamentals. Many exotic plants are little more than nuisances when they root in prairie patches, but species such as white sweet clover and giant teasel are very aggressive. Some can be eliminated by such approved management techniques as periodic burning.
Wildlife
The conversion of prairie to "secondary grasslands" in the form of hay fields and pastures actually enhanced Illinois' habitat for certain birds such as the dickcissel and the prairie chicken. But more recent changes in agricultural practice led to the decline of even these surrogate prairies. Three species of birds once common on the prairies have been extirpated in Illinois (the sandhill crane, once thought extirpated, recently reappeared in Illinois) and another thirteen species were endangered or threatened in the state as of 1993.
Insects have proven more adaptable, although some species may be struggling in Illinois. Typical is the Karner blue butterfly. A native of the Great Lakes and Northeast, the caterpillar of the Karner blue is uniquely adapted to feeding on the leaves of the wild lupine once common in northern Illinois savannas. Nationwide, populations of the Karner blue have declined by 99%, and in 1992 the U.S. Fish and Wildlife Service added it to the list of endangered species. The insect had not been seen for a century in Illinois until the summer of 1992, when five (perhaps a windblown "tourist" and its progeny) were spotted in Lake County.
The distribution of 255 of 640 prairie insect species surveyed since 1982 is restricted to prairie/savanna remnants. Perhaps one-fifth of these are found in only a very few, usually small, sites and must be considered imperiled. Among these is the loosestrife rootborer, which today is found at fewer than six sites; a handful of other species, such as the Dakota skipper, have not relocated to nonprairie habitat and are assumed to be extirpated in Illinois. Separate surveys of the protected prairie at Illinois Beach State Park have found that two butterfly, one moth, and a dozen leafhopper species that once inhabited it have not been seen there for many years.
RANKING OF AIR ISSUESa
|
ISSUE |
RELATIVE RISKb |
NEED FOR FURTHER ACTIONc |
CITY'S ABILITY TO FURTHER INFLUENCEd |
OVERALL PRIORITYe |
|
Transportation Sources |
High |
High |
High |
1 |
|
Wood Burning |
High |
High |
High |
2 |
|
Environmental Tobacco Smoke (ETS) |
High |
High |
High |
3 |
|
Other Indoor Air Pollution |
Medium-High |
High |
Medium |
4 |
|
Noise Pollution |
Low |
High |
High |
4 |
|
Fugitive Dust |
Medium |
Medium |
High |
4 |
|
Gas Stations |
Medium |
Low |
High |
4 |
|
Industrial Point Sources |
Medium-High |
Medium |
Medium-Low |
8 |
|
Centralia Power Plant |
Medium |
Medium |
Low |
8 |
|
Yard Burning |
Low |
Low |
High |
10 |
|
Other nonpoint Sources |
Low |
Medium-Low |
Medium-Low |
10 |
|
Nonionizing Electromagnetic Radiation |
Not Ranked |
Not Ranked |
Not Ranked |
Not Ranked |
|
SOURCE: "Rankings of Air Issues," from Environmental Risks in Seattle, A Comparative Assessment, published by the City of Seattle, Office for Long-range Planning, Seattle, Washington, October 1991. Reprinted with permission. a Note that the Air Team chose not to rank nonionizing electromagnetic radiation, due to the high degree of scientific uncertainty surrounding the issue. b Relative risks to the issue poses to human health, the environment, and quality of life. c Need for action above and beyond existing efforts to reduce risks. d City's ability to further influence the problem, given jurisdictional constraints and overall practicality. e Overall priority for action, combining relative risk, need for further action, and City's ability to influence. |
||||


