C
Standardized Mortality Ratios
The commonly used standardized mortality ratio (SMR) succinctly compares the rates of death (or other endpoint of interest) of a cohort of interest with a (usually larger) stable, known population. The larger population rates help to stabilize estimates of rare disease or within sparse subject strata. SMRs also help put the relative rates in a perspective somewhat familiar to the reader. They allow comparisons, although informal, with other studies. For example, if group A risk is high relative to group B, SMRs using a population such as the U.S. males in 1950–1985 can shed light on whether that is because group A's rates are high or group B's are low.
We use the Epicure model AMFIT (Preston et al. 1988) and present the data in the same strata and outcome models that we use for the proportional hazard models, also using 95 percent confidence intervals. SMR analyses are multivariate in that they adjust for age and time period, using a weighted average of category-specific effects. A limitation to their use is that other variables are not included. Results are presented as a ratio of observed to expected, with 1 (or 100 if so standardized) representing equal rates, less than 1 if the observed rate is less than the expected rate, and greater than 1 if the expected exceeds the observed.
An oft-raised and truly considerable drawback to SMR use in studies of occupational-type exposures is the healthy worker—or soldier (sailor)—effect described in Chapter 3. In fact, an earlier mortality study of atmospheric nuclear tests and mortality (Robinette 1985) was criticized for using SMRs as its sole
risk comparison. The study we report here was designed to include a military reference cohort to provide a finer comparison. The SMR comparison to the U.S. male population of the period under study adds, as mentioned above, a perspective that is useful as long as one keeps its limitations in mind.
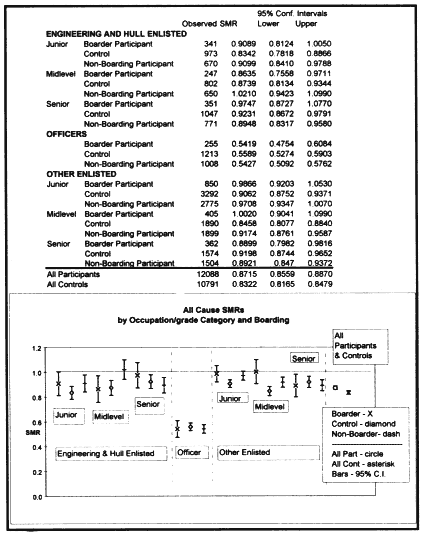
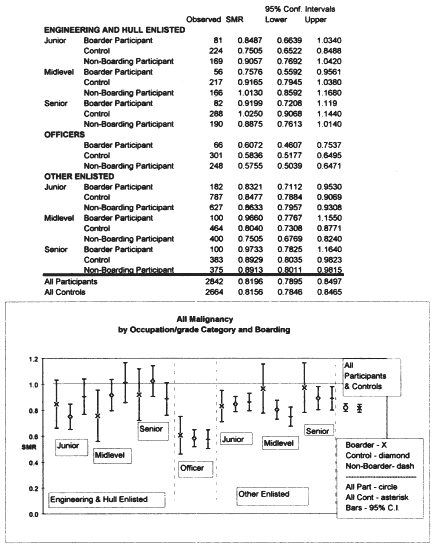
The results of our SMR analysis are presented in the following pages by service and disease category. In the case of the Navy for all-cause and allmalignancy mortality (Tables C-1 to C-2), the cohort is subdivided into the seven analysis levels as described in Chapter 10. For Navy leukemias, there were insufficient numbers of cases to use the seven-level analysis. For leukemias (Table C-3), the SMR data are collapsed over ranks and presented by participant status, boarder status, and Engineering & Hull status. For the Army (Table C-4, including the Air Corps) and the Marines (Table C-5), no occupational information is available; therefore, SMRs are calculated for the service as a whole. The disease categories include:
- all-cause mortality,
- all-malignancy mortality, and
- all leukemia mortality.
The tabulations of mortality rates (U.S. white male) we used as a comparison standard in this SMR analysis included chronic lymphocytic leukemia (CLL), which is not thought to be radiogenic. Of these there were approximately equal numbers in the controls and participants (10 and 11 respectively). Because of its nonradiogenic nature, CLL was excluded in the primary analysis using the proportional hazards model (see Chapters 10 and 11).
TABLE C-3. Standardized Mortality Ratios (SMR) for Leukemia (including CLL) for Navy Enlisted Personnel (n = 66,831)
|
|
Engineering & Hull Status (E&H) |
Boarding Status Nonboarders |
Boarders |
|
Control |
Other enlisted |
1.021 (0.7408–1.301) |
|
|
|
|
[51] |
— |
|
|
E&H enlisted |
1.403 (0.8922–1.913) |
|
|
|
|
[29]* |
— |
|
Participant |
Other enlisted |
0.8208 (0.5527–1.089) |
1.075 (0.4668–1.683) |
|
|
|
[36] |
[12] |
|
|
E&H enlisted |
1.654 (0.9924–2.316) |
0.9001 (0.1799–1.620) |
|
|
|
[24] |
[6] |
|
* Numbers of cases are shown in square brackets. |
|||
TABLE C-4. Standardized Mortality Ratios (SMR) for Army (including Army Air Corps, n = 6,482)
|
Case Definition |
All Participants |
All Controls |
||
|
|
Deaths |
SMR |
Deaths |
SMR |
|
All Causes |
1,192 |
0.6587 (0.6213–0.6961) |
1,250 |
0.8662(0.8182–0.9142) |
|
All Malignancies |
261 |
0.6074 (0.5337–0.6811) |
273 |
0.7789(0.6865–0.8713) |
|
Leukemias |
12 |
1.114(0.4838–1.745) |
8 |
0.9055(0.2780–1.533) |
TABLE C-5. Standardized Mortality Ratios (SMR) for Marines (n = 1,137)
|
Case Definition |
All Participants |
All Controls |
||
|
|
Deaths |
|
Deaths |
SMR |
|
All Causes |
173 |
0.8741 (0.7438–1.004) |
174 |
0.8280 (0.7049–0.9510) |
|
All Malignancies |
47 |
0.9524 (0.6801–1.225) |
31 |
0.5858 (0.3796–0.7921) |
|
Leukemias |
1 |
1.2781 (0*-2.316) |
3 |
1.3599 (0*-4.703) |
|
* Model yielded lower confidence limits of-0.7510 and-0.2903 respectively. |
||||


