4
USERS AND BENEFITS OF GOOS
In some cases, products to be distributed to users will be derived directly from Global Ocean Observing System (GOOS) observations (e.g., maps of sea surface temperature or sea surface winds). In other instances, the observations will be combined with non-GOOS data and interpreted based on our understanding of the ocean and the ocean-land-atmosphere system to produce a forecast product (e.g., a prediction of the time and location of algal blooms) that will be distributed to users. For these cases the integration of data from multiple disciplines is necessary and may generate new hypotheses and increased understanding.
Many of the phenomena that adversely impact society and the environment occur as events. Thus, parts of GOOS must be focused on monitoring events as emergent phenomena and subsequent rapid response using the warning time available.
EXAMPLES OF POTENTIAL GOOS APPLICATIONS
A fully realized GOOS should involve the collection of data, the development of products from those data, and the users of those products and should focus the benefits and beneficiaries. Several end-to-end examples (from data to ultimate users) are given here to facilitate better understanding of the potential for GOOS. For each example the pertinent data to come from GOOS, the initial users, the benefits, and the ultimate users are identified.
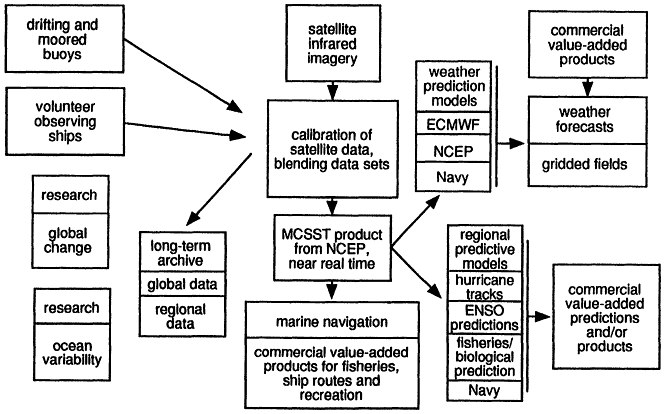
Examples of fundamentally different natures were selected for this discussion. Some examples illustrate the many different products, users, and benefits produced directly from one type of data (e.g., sea surface winds and sea surface temperature; see Figure 5). Others are organized to address specific challenges (e.g., safe navigation or coastal hazards) and to illustrate the use of multiple data sets (GOOS with non-GOOS) within existing operational systems to produce multiple benefits. Consequently, the organization of the examples provided below is slightly different for these two groups.
Before predictive capability is proven and operational, researchers will be the users of GOOS data—working to develop models, predictive capabilities,
and operational products. For example, the capability to predict pollock populations in the northeast Pacific based on ocean temperature, salinities, currents, and predation has been under development and will soon provide fisheries managers with an operational product (Traynor et al., 1990: Traynor and Williams, 1983). In some cases, the research is not yet complete, and the immediate product sought from the use of GOOS data is increased understanding. GOOS data will be used by researchers to develop the analysis methods and models that would add new products and benefits in the future. An example is provided by the need to monitor algal blooms. Improved forecasts of where hurricanes make landfall or alerts of high probability of cholera outbreaks linked to the El Niño/Southern Oscillation phenomenon (ENSO) variability are other examples of products that could be anticipated.
Surface Winds Over the Ocean
Although this first in the series of end-to-end (data-to-user) examples of GOOS products and benefits may be the most straightforward, sea surface wind (SSW) data represent a very important component of many climate applications. The following example may be the simplest as it describes the development of important products derived directly from GOOS observations.
Data Users, Products, and Benefits
Examples of the benefits that result from an ocean observing system that provides maps of surface wind speed are provided in Table 1. Each row illustrates an example of the immediate user of SSW data, the nature of the SSW product, the benefits that arise from using the product, and the ultimate beneficiaries.
Strategy for Improving System
The Volunteer Observing Ship system (VOS) and a limited subset of the moored and drifting buoys provide direct observations of wind. These in situ observations can be blended with global observations of wind by satellites, using either active microwave sensors known as scatterometers that look at radiation scattered back from the sea surface or passive microwave sensors.
Commitment to operational continuity of coverage by satellite wind sensors, such as that provided for sea surface temperature by the continuing series of polar orbiting satellites, is needed to ensure ongoing global coverage.
Research will continue to ensure that remotely sensed wind speed is being properly interpreted and accurately converted from the raw observable to wind speed. This requires more accurate direct observations of wind speed. Attention
TABLE 1 - Surface Winds Over the Ocean: Data Users, Benefits, and Ultimate Users
|
DATA USERS |
PRODUCTS |
BENEFITS |
ULTIMATE USERS |
|
Forecast meteorologists |
Regional and global, near real-time reports of direct observations of surface winds by ships and buoys |
In situ surface wind observations assimilated into numerical weather models, improving their accuracy. Also, they serve as a check on the accuracy of the models, which may miss or underestimate the severity of localized wind events, and provide the basis for warnings to mariners |
Users of weather forecasts, particularly those using the sea for transport, fishing, and recreation. |
|
Forecast oceanographers |
Regional and global, near real-time surface wind fields |
Used in conjunction with ocean models and surface wave models, tropical Pacific wind data provide forecasts of surface wave heights, directions, and periods and of surface currents; used in El Niño-Southern Oscillation (ENSO) forecasts. Local winds used for prediction of storm surges, surface currents, and wind waves |
Those involved in navigation, fishing, recreation at sea. Those producing maritime safety warnings, alerts of coastal erosion and flooding, maps of surface currents for search and rescue or mitigation of environmental disasters at sea |
|
Research meteorologists |
Global, near real-time reports of surface winds from ships, buoys, and satellites |
Assimilated into global numerical weather models, improving their accuracy |
Users of weather forecasts and those using the gridded fields of surface variables and air-sea fluxes produced by weather models |
|
Research oceanographers |
Many years of sequential, daily tropical Pacific surface wind speed maps available in a data base |
Used as the basis for research on the development of improved El Nine-Southern Oscillation (ENSO) predictions and study of how anomalous winds trigger such events, these maps thus lead to improved regional forecasts of weather and climates anomalies, such as those in air temperature and rainfall |
Farmers, governments, investors, and managers whose planning would benefit from accurate prediction of temperature and rainfall anomalies up to one year in advance |
|
Research oceanographers |
Regional and global maps of surface wind, available from a data base, gridded in space and evenly spaced in time |
Allows research oceanographers to investigate how the upper ocean is forced by the wind, to compute the wind stress and wind speed dependent heat fluxes (latent and sensible), and work toward modeling and prediction of how the vertical profiles of temperature, velocity, and other properties in the ocean evolve with time |
Better understanding of the coupling of the atmosphere and ocean will lead to improved models of atmospheric variability on time scales from days to centuries, benefiting a broad range of users of weather and climate forecasts |
|
Research climatologists |
Data base of sequential, over tens to hundreds of years, regional and global maps of surface wind speed based on careful analyses of the raw data to remove biases and errors and produce the best possible accuracy and precision |
With the ocean covering 70% of the earth's surface and some spatial variability in the global signature of climate change, these maps are needed to look for change in the atmospheric forcing of the ocean and in the air-sea exchanges of beat and moisture in order to understand the ocean's role in global change |
Government and private sector planners and managers who need to be aware of long-term change in climate |
should be paid to the quality of VOS wind observations and to developing a broader capability of making wind speed measurements from drifting buoys. One possibility for the latter is through the use of hydrophones to measure ambient noise and the development of algorithms to parameterize wind speed in terms of ambient noise.
Sea Surface Temperature
One of the most fundamental and useful ocean observations is sea surface temperature (SST). This variable is presently being measured and used in many products for a variety of purposes. Such measurements must be continued and improved as part of GOOS. Following this discussion, other examples that build on SST and SSW (e.g., fish stock assessments, algal bloom predictions, climate-related human health warnings) are discussed to help demonstrate the importance of SST observations as pan of GOOS.
Data Users, Products, and Benefits
Examples of the benefits that result from an ocean observing system that provides maps of sea surface temperature are provided in Table 2. Each row provides an example of the immediate user of SST data, the nature of the specific SST product, the benefits that arise from using the product, and the ultimate beneficiaries.
Strategy for Improving System
The present system relies on a mix of direct and remote measurements. Drifting and moored buoys together with volunteer observing ships provide ocean temperatures at or near the sea surface. Polar orbiting satellites collect infrared images (Advanced Very High Resolution Radiometer or AIR) of the temperature of the sea surface, sampling the globe twice a day. The direct buoy and ship observations are used to provide calibration points for the satellite SST measurements, which can be erroneous due to aerosols (e.g., dust from forest fires or ash from volcanic eruptions). In addition, infrared sensors cannot see the ocean surface through clouds, and direct observations become critical in cloudy regions. The present operational SST product uses nighttime satellite data together with direct measurements. Polar orbiting satellites cannot, by sampling only twice a day, adequately sample the diurnal cycle in SST that results from heating of the upper several meters of the ocean by sunlight.
These SST products can be improved by upgrading the accuracy of the direct measurements and by having more such measurements reported from regions that at present are sparsely sampled by ships and buoys. The present
VOS sea surface temperature sensors are less accurate than those on buoys. Upgrades, in the form of the more accurate hull-contact sensors, should be fitted to the VOS. More buoys should be deployed in data-sparse regions. Efforts should also be made to ensure that all platforms (ships and buoys) report their observations. In addition, improvements to the data telemetry hardware and systems are needed.
A major advance over the present observing system would be the development of a system that would sample the SST field many times a day (e.g., every 3 hours). Not only would this resolve the diurnal cycle, but the more frequent views of each location would greatly improve the ability to minimize blockage associated with cloud cover. This could be done by bringing in data from geostationary satellites. Two GOES satellites and GMS5, for example, provide almost global coverage (missing the Indian Ocean) of sea surface temperature every 3 hours, reported to 0.1 deuce C, accurate to approximately 0.5 degree C, at 10 or 30 km spatial resolution.
Further refinements to satellite sensors and methods (e.g., improved ability to deal with atmospheric effects and combination of infrared data with data from microwave sensors that can see through clouds) also are possible. However, because of the potential importance of the diurnal cycle in SST to atmosphere-ocean coupling, improvements to the temporal sampling of SST by the operational system should come first.
Examples in the following sections involve multiple data sets, including SSW or SST, described above. The following discussions are organized to include (1) an overview of the challenge or issue to be addressed with GOOS data and products; (2) a table of related data, data users, and products; (3) the ultimate users and benefits to be derived from GOOS products; and (4) ways to improve or implement the system.
Coastal Hazard Prediction and Warnings
The population of U.S. coastal zones in 2010 is expected to approach 127 million, a projected increase of 15 million since 1990 (Department of Commerce, 1990). Although recent improvements in hurricane and severe coastal storm forecasting have sharply reduced loss of life, this ongoing shift in U.S. population toward the coastlines will result in increased in risk to property from coastal storms and other geological and marine processes characteristic of coastal settings. Estimates of the present total value of insured property at risk range from $2 trillion (National Research Council, 1994a) to $3.15 trillion (Lewis and Murdock, in press; Institute for Property Loss Reduction and Insurance Research Council, 1995). In addition, millions of people worldwide will remain at risk from rapid-onset events, such as tsunami, where present and future forecasting capabilities may be less effective.
TABLE 2 - Sea Surface Temperature: Data Users, Products, Benefits and Ultimate Users
|
DATA USERS |
PRODUCTS |
BENEFITS |
ULTIMATE USERS |
|
Forecast meteorologists |
Global gridded, 6-hourly sea surface temperature maps available in near real time |
Used to initialize numerical weather prediction models, these maps improve the predictions made by these models |
Users of weather forecasts |
|
Forecast oceanographers |
Regional and global, near real-time maps of sea surface temperature |
Forecast oceanographers interpret the maps to infer tile location of strong currents, eddies, ocean fronts, and other features and to provide guidance to the fishing industry |
Marine transportation users that seek tile most economical ship routes, fisherman, recreational users |
|
Research meteorologists and oceanographers |
Many years of sequential, daily tropical and mid-latitude Pacific sea surface temperature maps available in a data base |
Used as the basis for research on the development of improved El Niño-Southern Oscillation (ENSO) predictions, these maps thus lead to improved regional forecasts of weather and climates anomalies, such as those in air temperature and rainfall |
Farmers, governments, investors, and managers whose planning would benefit from accurate prediction of temperature and rainfall anomalies up to one year in advance |
|
Research oceanographers |
Several months of daily maps of local and regional sea surface temperature fields with sufficient spatial resolution to reveal oceanic features such as coastal currents, eddies, and sea surface temperature fronts, available in near real time and later as a data base |
These maps allow research oceanographers to describe, identify, and track the evolution of oceanic features and processes. Of interest are not only physical features such as boundary currents and eddies, but also biological features, such as algal blooms, coral reefs, and biodiversity that depend on upper ocean temperatures |
Oceanographers and other scientists interested in the impact of oceanic variability; those studying biological and chemical processes that are impacted by shifts in tile location of currents and regional changes in sea surface temperatures |
|
Research climatologists |
Data base of sequential, over tens to hundreds of years, regional and global maps of sea surface temperature based on careful analyses of the raw data to remove biases and errors and produce the best possible accuracy and precision |
With the ocean covering 70% of the earth's surface and some spatial variability in the global signature of climate change, these maps are needed for assessments of global and regional warming and cooling with improved confidence. In addition, they are used to look for links or teleconnections between sea surface temperature variability and weather arid climate variability at remote locations on land |
Government and private sector planners and managers who need to be aware of long-term change in climate. Those interested in predictors of weather and climate variability due to ocean variability other than ENSO |
|
Severe storm forecasters |
Near real-lime regional maps of sea surface temperature |
These maps are needed as the surface boundary condition for atmospheric models used in efforts to improve predictions of cyclogenesis and of cyclone and hurricane tracks |
Inhabitants and property owners at risk due to storms and hurricanes, especially those in or near the storm tracks |
Due in part to the costs associated with storm and wave damage, and in pan to the question of who pays and who benefits, the pressure to reduce financial losses caused by natural processes that operate in coastal settings is mounting. The U.S. government is concerned about growing expenditures associated with relief and recovery from coastal disasters (e.g., hurricanes, tsunami, long-term coastal erosion). Momentum is gaining to implement measures that reduce the impact of these processes and that shift a greater amount of the costs of recovery to those individuals and communities who most benefit from development of high-risk coastal areas (e.g., via a restructuring of insurance or other mechanisms).
Data, Users, and Products
The data needed for effective coastal hazard prediction are diverse. GOOS observations such as wind and sea-level data (for storm surge prediction) will be combined with seismic information (for tsunami prediction) and accurate shoreline characterization to develop accurate predictions and coastal warnings. Historical data will be required for model verification and improvement. Finally, information on land usage (e.g., buildings, roads, power lines, population distributions) will be required to make risk assessments and damage predictions. Depending on the location or problem, data concerning stream flow, sea ice, or ocean currents, for example, also could be required.
|
DATA |
USERS |
PRODUCTS |
|
• Gridded fields and point measurements of SSW (from GOOS) • Sea level measurements (from GOOS) • Sesmic information • Shoreline sediment characteristics • Land usage information |
• Forecasters • Coastal and architectural engineers • Modelers |
• Costal erosion risk maps • Storm surge susceptibility maps • Coastal flooding risk maps • Public health alerts (e.g., impact of storm surge on local water supplies) |
Ultimate Users and Benefits
The SSW and sea-level data give near-real-time information on sea state (elevation and wave characteristics). When these data are used in a forward model, they provide forecasts of sea state. If combined with non-GOOS data (e.g., distribution of community infrastructure, topographic and bathymetric data) and modeled, a number of valuable derivative products could be made available to a range of user communities:
-
state and local officials could receive and broadcast advance and real-time warnings of dangers (e.g., flooding, tsunami, severe erosion)
-
coastal managers, through the use of improved hazard maps derived from modeling GOOS data, could help reduce risk exposure for coastal development
-
The insurance industry could create more realistic actuarial models by incorporating realistic hazard index maps
-
financial institutions could encourage sensible coastal development by, for example, basing mortgage rates on risk exposure
-
residents and business owners could enjoy improved quality of life and long-term financial stability by avoiding high-risk coastal areas.
Implementation Strategy
First, existing historical knowledge (e.g., surf zone conditions, hurricane probabilities, seismic data, ice data) should be used to assess the sorts of coastal hazards likely to occur along given coastal segments. For each segment, bathymetric charts and land topographic charts should be reviewed, made consistent, digitized, and improved. Further, land-usage patterns should be characterized and ocean and atmospheric data requirements assessed, both in terms of sufficiency for local characterization and adequacy for modeling. Coastal hazards (e.g., flooding, ice damage, erosion) models then must be tested, improved, and made operational. The model predictions and observations must then be made readily available and easy to interpret. Finally, continued system performance evaluation and system improvements are essential.
Improved Navigational Systems
In 1991 the National Oceanic and Atmospheric Administration (NOAA) introduced its first physical oceanographic real-time system (PORTS) applied to a U.S. seaport. This system is intended to acquire data, make analyses and predictions, and disseminate information regarding water level, currents, and other selected oceanographic and meteorological data in real tune to maritime
users. Expanding these systems would provide important navigational data and forecasts, greatly reducing transportation costs and improving safety.
Data, Users, and Products
Unlike some other GOOS data sets, data for improving navigational systems would be tied to specific coastal, harbor, or marine installations.
|
DATA |
USERS |
PRODUCTS |
|
• SSW fields • Tide gauge heights • Current velocities |
• Operational ocean forecasters |
• Real-time water level and currents • Forecasts of water level and currents |
These data and derived products are combined with highly accurate electronic navigation charts (where available) to develop the overall navigation system.
Ultimate Users and Benefits
Providing easy access to these products could result in a number of benefits for ship captains and owners, harbor pilots, and port authorities:
-
increased access to more precise bathymetric and water-level data
-
decreased likelihood of grounding
-
decreased need for unnecessary lightering, increased competitiveness of deep draft vessels, and increased transportation efficiency
By decreasing the likelihood of ship grounding, deep draft vessels can take on greater loads and become more competitive. Transportation brokers can schedule ship time more effectively. By increasing the pool of competitive cargo vessels, transportation costs can be lowered, resulting in decreased costs to consumers. In addition, resource extraction and manufacturing in some areas is limited by access to worldwide trade by lack of adequate ports. Improved tide information may make marginal ports more accessible.
Strategies for Improving the System
PORTS has been successful in the limited number of harbors in which it has been installed. This experience suggests that the system could be improved and its capabilities expanded by including (1) widely distributed acoustic Doppler profilers and anemometers (coupled with packet radio transmitters), (2) a data acquisition system, (3) improved models, and (4) an information dissemination system. To obtain the maximum benefit from this system, similar systems would need to be installed worldwide in shipping centers with limited harbor access.
Improved Fish Stock Assessments
The techniques of fishery stock assessment are well developed (e.g., Hilborn and Walters, 1992). One can conceptually summarize the procedure as following a cohort of newly spawned larval fish as they mature, taking into account the losses that such a cohort experiences through predation and advection away from areas conducive to maturation. GOOS activities should be expected to collect the hydrographic and biological abundance data.
Data, Users, and Products
Although these techniques would not be truly new or unique to GOOS, the collation of data collected over relatively short time periods from around the world would provide a useful data set for improving global stock assessments.
|
DATA |
USERS |
PRODUCTS |
|
• Standard hydrographic data (e.g., SST, current velocities) • Biological information regarding the abundance of the larval stages of the fish populations • Biological information regarding abundance of the predators on these same larval stages |
• Fishery scientists and managers |
• Indices of advective losses from the population • Expected range of fish abundance |
Benefits and Ultimate Users
Using validated circulation models, hydrographic information collected in spawning areas can be assimilated into the models, and indices of advective losses from the population can be obtained. Once such indices are available, they can be used with standard stock assessment techniques plus estimates of mortality due to predation on the larval stages to determine the expected range of fish abundance from the newly spawned larvae. Such a system could have specific benefits:
-
better knowledge of year-class abundance will allow fishery managers to make better-informed stock management decisions—an important and necessary step in sustaining most fish populations
-
by improving the management of fish stocks, consumers will benefit directly by gaining access to better quality and a great variety of seafood
-
greater variety and product quality should lead to increased market competition and savings for consumers
Strategy for Improving System
Though space does not permit a complete enumeration of the details of stock assessment techniques, the general notions cited above are now used operationally to manage the important wail-eyed pollock stock found in the western Gulf of Alaska (Traynor et al., 1990; Traynor and Williams, 1983). Currently, the indices of advection are only qualitative (e.g., ''large,'' "medium," or "small"). Longer data series, coupled with more thoroughly tested transport models, will allow the incorporation of quantitative estimates of advection and, accordingly, better abundance estimates. Equally important are measurements of the larval-stage abundance. A thoughtfully focused LMR module will aim to collect such larval data. Long and reliable data series of larval stage abundance—hopefully a product from GOOS activities—could prove invaluable to many fishery stock assessments.
Prediction of Algal Blooms in Coastal Regions
Several locations in the coastal United States are subject to sporadic blooms of harmful or "nuisance" algae. These blooms can (a) introduce toxins into the marine food chain, (b) overwhelm "normal" ecosystem structures through hypoxic conditions, and (c) form a reservoir for bacteria such as cholera (Colwell, 1991; Epstein, 1993). There are indications that the frequency of such events is increasing globally in response to increased coastal development and changes in nutrient supply and climate. However, in most cases our
understanding of the factors that initiate such blooms is limited and insufficient to allow prediction or the rational design of mitigation strategies. Remote sensing of ocean color as part of GOOS could help target sampling for noxious species, red tides, and other algal blooms.
One case study is the brown tide bloom that occurs in the bays of Eastern Long Island, which has had major impacts on seagrass beds and the scallop industry on Long Island. In this case a 10-year time series of water quality observations coupled with other long time-series data sets is now revealing the factors leading to bloom initiation. On the basis of these data, it appears that brown tide blooms may be predicted with lead times of several months—sufficient time to guide the decisionmaking management process.
Data, Users, and Products
Many of these parameters important for algal bloom prediction can be measured routinely by in situ automated systems and are appropriate for immediate implementation. Others require labor-intensive sampling and analyses (for these cases, improved technology should be sought). Data requirements for bloom prediction will vary somewhat from region to region. Note that the requirements are site specific; other regions and algal blooms may require a different set of measurements (e.g., remote sensing and information on coastal advection).
|
DATA |
USERS |
PRODUCTS |
|
• S ST (from GOOS) • Salinity (from GOOS) • Dissolved oxygen (from GOOS) • Chlorophyll fluorescence (from GOOS) • Inorganic nutrients (N, P, Si) (from GOOS) • Organic nutrients (N, P) (from GOOS) • Algal species composition • Cell counts • Meteorological parameters • Groundwater flow and associated nutrient loading • Point-source nutrient inputs |
• State and local government officials • Academic community |
• Improved understanding • Predictions of algal blooms |
Related non-GOOS parameters are normally collected and archived under existing federal and local programs, separate from GOOS. As in the case discussing the role of GOOS data in coastal hazard predictions, they must be integrated with GOOS data to derive the desired products and maximum benefit.
The initial product of time-series monitoring will normally be the establishment of scientific understanding concerning the factors associated with algal bloom initiation. Such information will usually need to be supplemented by non-GOOS research aimed at providing mechanistic understanding. Bloom initiation as a result of environmental factors should be predictable in many cases, and such predictions are an ultimate "product" of a coastal GOOS observing system.
Ultimate Users and Benefits
In the Long Island bays, significant cost and effort are expended on reseeding of juvenile scallops. Such effort has been rendered ineffective on several occasions as a result of subsequent brown tide occurrences. Predictive ability would permit decisions to be made concerning the likely success of such efforts. In addition, such a complex use of GOOS data would have other benefits to ultimate users:
-
improved local community water quality
-
enhanced tourism and recreation industry
-
enhanced commercial and recreational fishing
Climate Forecasts and Health Warnings
Dengue ("breakbone") fever (DF) is caused by a virus (in the yellow fever family) transmitted by the mosquito Aedes aegypti. The illness is severe and can last up to 2 weeks; most eases are not fatal. Two severe and potentially fatal forms, dengue hemmoragic fever (DHF) and dengue shock syndrome (DSS), may result when individuals are infected sequentially by more than one of the few virus strains.
Dengue fever occurs in poor, periurban populations (i.e., populations in and adjacent to cities) with inadequate sanitation and ubiquitous small receptacles where mosquitoes can breed. Large epidemics are often precipitated by extreme weather events, especially involving warm, wet, overcast conditions. However, in some situations, drought is a precipitating factor when streams cease to flow and form pools.
Dengue fever epidemics can involve large health costs but can also affect productivity and tourism. Early warning of meteorological conditions conducive to outbreaks can permit timely intervention of preventive public health measures.
El Niño/Southern Oscillation phenomenon (ENSO) conditions are closely correlated with DF outbreaks in Central America, the Caribbean, Brazil, and Southeast Asia.
Data, Users, and Products
|
DATA |
USERS |
PRODUCTS |
|
• SST • Water column temperature • SSW • Sea-level data |
• Forecasters • Modelers (dynamic and statistical) |
• Long-term weather predictions (seasonal) • Early warning of weather conditions favoring increased mosquito breeding and reproduction |
Ultimate Users and Benefits
Understanding of ENSO has reached the level of maturity at which prediction of El Niño or La Niña some 6 months in advance is possible with some skill. Improvements in that predictive skill and in the ability to forecast resulting long-term weather patterns globally are needed. The GOOS observing system has this as a specific objective.
Products would be used by public health authorities and services; the ultimate beneficiaries are populations. Public health warnings may be issued centrally and distributed to national ministries of health through the preventive health divisions of the U.S. Centers for Disease Control and Prevention (CDC), the World Health Organization (WHO), and the Pan American Health Organization (PAHO).
In addition, international relief, development, agricultural and health organizations could benefit from climate forecasts and function as partners (e.g., the International Red Cross, United Nations High Commission on Refugees, World Bank, Global Environmental Faculty, and the Food and Agriculture Organizations).
Improved forecasting of seasonal or interannual climate variations would greatly benefit local health and government officials in preparation for potential outbreaks of dengue fever. Specifically, improved predictions would facilitate timely efforts to:
-
clean up of peridomestic breeding sites (nonbiodegradable containers)
-
introduce carnivorous fish to ponds
-
apply larvicidal bacteria (Bacillus thuringiensis isrealiensis—BTI), innocuous to humans, to breeding sites
-
target use of chemical larvicides and pesticides
-
By enabling government officials to take the timely efforts listed above, GOOS will result in a number of ultimate benefits, including:
-
improved health warnings that allow time for mitigation of negative effects
-
improved public health and decreased mortality
-
enhanced quality of life
-
decreased costs for relief efforts
-
enhanced productivity due to reduced incidences of illness
COST-BENEFIT STUDIES
Implementation of GOOS will be expensive. As discussed earlier in this chapter, its aim is to provide products that benefit society. If society is to be convinced that GOOS is a worthwhile endeavor, efforts must be made to estimate the economic and societal benefits to be had from the eventual system. Cost-benefit analyses can provide guidance as to which efforts are worth pursuing, with what priority, with what objectives, and at what level. Furthermore, careful cost-benefit studies are important tools for convincing decisionmakers that GOOS efforts should be funded.
Funding was not provided to allow the committee to undertake cost-benefit studies on its own. Below are some examples of human and economic costs that could be mitigated with the kind of information GOOS could provide.
Enso Effects On Agribusiness
Climate and decisions based on expectations about climate, affect the economies of the world (Sassone, 1997). Understanding the ways in which climate affects agribusiness, and subsequently the economy, should be a priority. Agriculture in the United States is becoming an increasingly sophisticated industry, relying heavily on technology. Though they differ from more traditional types of agricultural technologies, climate research and forecasting programs are becoming socially and economically beneficial.
The occurrence of the ENSO phenomenon can result in substantial economic and social losses for agricultural businesses in the United States and worldwide. Through the Tropical Oceans and Global Atmosphere (TOGA) program, a 10-year international study established to understand ENSO, scientists have learned
to predict ENSO events as much as a year in advance with modest success. Climate prediction of this sort relies on models based on scientific understanding of atmosphere and ocean dynamics and interactions and on an extensive data-gathering system. These models are developed through research involving detailed and long-term in situ measurements of climate variables (e.g., sea surface temperature, sea surface winds, subsurface temperature and currents, sea-level measurement) and through modeling. The data-gathering system involves air, water, and land-based instruments, reaching across much of the globe. Both the development of the climate module and their subsequent operation involve significant costs (Sassone, 1997).
The economic and social value of this type of climate forecasting depends on the accuracy of predictions and the rate of forecast acceptance by farmers and other business owners. Cost-benefit analyses (Adams et al., 1995) of TOGA and the ENSO forecasting system predicted an annual economic return on investment (commonly referred to as the Internal Rate of Return [IRR]) for agribusiness that ranged from 13 to 26 percent of the annual cost (in 1995 U.S. dollars, this translates to an annual estimated return of $96 to $145 million for the southeastern United States, and $240 to $266 million for the entire U.S. agricultural sector). Based on a farmer acceptance of 50 percent that grows to 95 percent over a six-year period, these rates are substantially higher than the federal government's recommended internal rate of return of 7 percent (the Office of Management and Budget recommends that projects demonstrate an IRR greater than 7 percent to be considered cost-effective (oral communication, R. Weiher, Chief Economist, NOAA). If the cost-benefit analysis is modified to reflect a lower rate of acceptance than those of the scenarios presented above, the actual annual return is about 7 percent. This analysis suggests that improving ENSO forecasts is economically worthwhile, though greater participation (i.e., acceptance) by farmers translates into greater savings.
This example also points out that evaluation of the benefits of GOOS observations and derivative products must take into account both the quality of the observations or products and the acceptance and rate of use of those products. To realize full benefit, society would need to incorporate GOOS products/results into decisionmaking processes. By using GOOS products to determine whether the next growing season will be wetter or drier or warmer or cooler than average, farmers will be able to adjust their planting strategy to take advantage of this information (Sassone, 1997). In return, consistently accurate forecasts will encourage widespread societal implementation of GOOS products.
Amnesiac Shellfish Poisoning: Prince Edward Island, Canada, 1987
The year 1987 was an El Niño year, and there was an associated series of adverse events in marine fauna and flora along the U.S. Atlantic Coast, including
(1) extensive coral bleaching in the Caribbean; (2) a large die-off of seagrass off Florida; (3) movement of Gymnodinium breve (causing Neurological Shellfish Poisoning) from the Gulf of Mexico to Cape Hatteras, North Carolina; (4) dolphin and whale die-offs off Cape Cod and in the North Sea in 1988; and (5) the appearance of amnesiac shellfish poisoning (a "new disease") in Prince Edward Island.
The outbreak in Prince Edward Island was the first outbreak of shellfish poisoning due to a diatom-related biotoxin recorded in Canada, The episodes of amnesiac shellfish poisoning were attributed to consumption of cultured mussels from Prince Edward Island. Domoic acid originating from Nitschia pungens f. mutiseries was responsible for at least 145 cases of short-term amnesia, and some permanent amnesia, and three deaths. Prior to this event, warm Gulf Stream rings were found close to shore (resulting in elevated sea surface temperatures), and intense rains increased runoff, which elevated nutrient levels near Prince Edward Island.
|
Box 4
|
||||||||||||||||||||||||||||||||||||||||||
Although the precise role that extreme weather and elevated sea surface temperatures played in generating this series of adverse events is unclear and costs for initial outbreaks tend to be unusually high, forecasting of similar changes could help target surveillance and improve readiness. In addition, such observations could address questions regarding the overall role of ocean warming and its potential consequences in terms of adverse events related to the marine environment. An observing system for adverse events could better inform policymakers on (a) choosing sentinel coastal sites to monitor, (b) evaluating the ecological and global contributions to impacts and consequences, and (c) determining measures with which to better analyze costs of global change.
Coastal Forecasts
Kite-Powell et al. (1994) examined the potential benefits of improved coastal forecasts. As envisioned in their study, an improved system would make better use of wind, current, sea level, and remote sensing information (of the type expected from GOOS) to derive real-time and forecast models of winds and currents over the continental shelf. The system would include a physical oceanographic real-time system (PORTS) as implemented by NOAA (discussed earlier in this chapter). A number of potential beneficiaries were identified, ranging from small, localized organizations in the recreational boating and fishing industry to large commercial shipping and offshore drilling companies. The commercial fishing industry also was identified as a major beneficiary of coastal forecast dam, as were the military and local marine search and rescue operations.
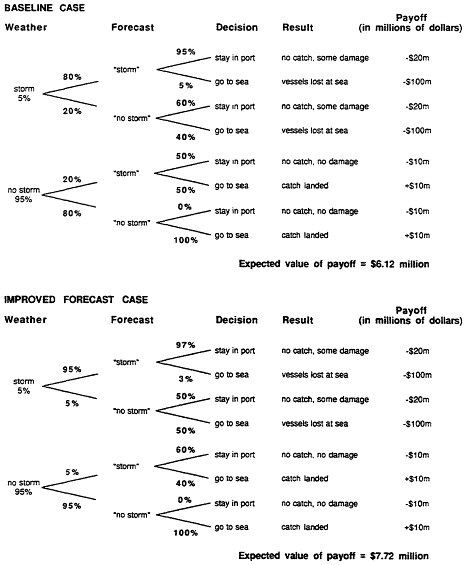
Kite-Powell, et al. also reviewed the potential value of improved coastal forecasts to this range of possible beneficiaries. A series of cases was examined in which each case represented an alternate outcome associated with a particular decision. The calculations were made to reflect likely outcomes based on decisions made in response to coastal forecasts. These potential responses and their likely outcomes were then aggregated to determine the overall value of coastal forecasts.
For example, the Kite-Powell, et al. study suggests that the value of improved coastal forecasts to the commercial fishing fleet (just one subset of possible beneficiaries) would be considerable. Figure 6 illustrates the approach used to estimate the value of more accurate forecasts to a subset of the fishing fleet by comparing the value of payoff determined for a baseline scenario to one in which the accuracy of forecasts was improved. Comparison of the two cases suggested chat improved coastal forecasts could result in an increased payoff of $1.6 million a year. By aggregating similar estimates for many beneficiary groups, the report indicates that improving the coastal forecast system could result in a savings of tens of millions of dollars a year as the result of an