
This paper was presented at a colloquium entitled “Science, Technology, and the Economy,” organized by Ariel Pakes and Kenneth L.Sokoloff, held October 20–22, 1995, at the National Academy of Sciences in Irvine, CA.
Measuring science: An exploration
JAMES ADAMS* AND ZVI GRILICHES†
*Department of Economics, University of Florida, Gainesville, FL 32611–7140; and †Department of Economics, Harvard University, National Bureau of Economic Research, Cambridge, MA 02138
ABSTRACT This paper examines the available United States data on academic research and development (R&D) expenditures and the number of papers published and the number of citations to these papers as possible measures of “output” of this enterprise. We look at these numbers for science and engineering as a whole, for five selected major fields, and at the individual university field level. The published data in Science and Engineering Indicators imply sharply diminishing returns to academic R&D using published papers as an “output” measure. These data are quite problematic. Using a newer set of data on papers and citations, based on an “expanding” set of journals and the newly released Bureau of Economic Analysis R&D deflators, changes the picture drastically, eliminating the appearance of diminishing returns but raising the question of why the input prices of academic R&D are rising so much faster than either the gross domestic product deflator or the implicit R&D deflator in industry. A production function analysis of such data at the individual field level follows. It indicates significant diminishing returns to “own” R&D, with the R&D coefficients hovering around 0.5 for estimates with paper numbers as the dependent variable and around 0.6 if total citations are used as the dependent variable. When we substitute scientists and engineers in place of R&D as the right-hand side variables, the coefficient on papers rises from 0.5 to 0.8, and the coefficient on citations rises from 0.6 to 0.9, indicating systematic measurement problems with R&D as the sole input into the production of scientific output. But allowing for individual university field effects drives these numbers down significantly below unity. Because in the aggregate both paper numbers and citations are growing as fast or faster than R&D, this finding can be interpreted as leaving a major, yet unmeasured, role for the contribution of spillovers from other fields, other universities, and other countries.
While the definition of science and of its borders is ambiguous, it is clearly a major sector of our economy and the source of much past and future economic growth. In this paper we look primarily at “academic” research [as defined by the National Science Foundation (NSF)] and its locus, the research universities. It is a major sector of the total United States “research” enterprise, accounting (in terms of performance) for only 13% of the total research and development (R&D) dollars spent in the United States in 1993 but 51% of all basic research expenditures and 36% of all doctoral scientists and engineers (S&Es) primarily employed in R&D (1). Other major R&D performing sectors, such as industry, have been studied rather extensively in recent years, but quantitative studies of science by economists are relatively few and far between. [See J. Adams for an earlier attempt (2) and P.E.Stephan for a recent survey and additional citations (3)].
The limited question, which we would like to address in this exploratory paper, is posed by the numbers that appear in the latest issue of Science and Engineering Indicators (S&EI) (1993; ref. 1): during 1981–1991 total R&D performed in the United States academic sector grew at 5.5% per year in “real” terms, whereas the total number of scientific articles attributable to this sector grew by only 1.0% per year (1). Is this discrepancy in growth rates an indication of sharply diminishing returns to investments in science? Or is there something wrong with the basic data or with our interpretation of them? [For a discussion of similar issues in the analysis of industrial R&D data, see Griliches (4).] These official measures of “activity” in United States science are plotted in Fig. 1 on a logarithmic scale. We shall try to examine this puzzle by using detailed recent (1981–1993) data on R&D expenditures, papers published, and citations to these papers, by major fields of science, for more than 50 of the major research universities. But before we turn to these calculations, a more general discussion of the measurement issues involved may be in order.
The two major outputs of academic science are new ideas and new scientists. The latter is relatively easy to count, and its private value can be computed by capitalizing the lifetime income differentials that result from such training (5). Ideas are much more elusive (6). As far as direct (internal) measures of scientific output are concerned, the best that can be done at the moment is to count papers and patents and adjust them for the wide dispersion in their quality by using measures of citation frequency. That is what we will be doing below. [For an analysis of university patenting see Henderson et al. (7). For an analysis of citations in industrial patents to the scientific literature see F.Narin (unpublished work)‡ and Katz et al. (8).]
Indirect measures of the impact of science on industrial invention and productivity are based either on survey data (9–11) asking firms about the importance of academic science to their success, case studies of individual inventions (12–15), or various regression analyses where a measure of field or regional productivity (primarily in agriculture) is taken to be a function of past public R&D expenditures or the number of relevant scientific papers (2, 16–18). All of these studies are subject to a variety of methodological-econometric problems, some of which are discussed by Griliches (4, 19). Moreover, none of them can capture the full externalities of science and thus provide only lower-bound estimates for its contributions.
Direct measures of scientific output such as papers and the associated citation measures have generated a whole research field of bibliometrics in which economists have been only minor participants. [See Van Raan (20) and Elkana et al. (21) for surveys and additional references.] Most of this work has
The publication costs of this article were defrayed in part by page charge payment. This article must therefore be hereby marked “advertisement” in accordance with 18 U.S.C. §1734 solely to indicate this fact.
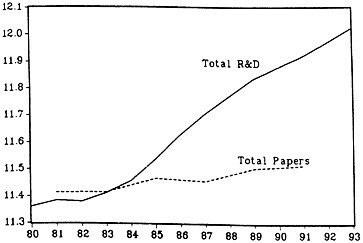
FIG. 1. Research input and output indicators I. All United States academic institutions (1980–93, log scale) (1). R&D is given in 1987 dollars. Paper numbers are based on more than 3500 journals, interpolated for even years.
focused on the measurement of the contribution of individual scientists or departments within specific fields [see Stigler (22) and Stephan (3) in economics and Cole and Cole (23) in science more generally]. Very few have ventured to use bibliometrics as a measure of output for a field as a whole. [Price (24) and Adams (25) at the world level and Pardey (26) for agricultural research are some of the exceptions.] The latter is bedeviled by changing patterns of scientific production and field boundaries and the substantive problems of interpretation implied by the growing size of scientific literature, some of which we will discuss below.
The Aggregate Story
Returning to the aggregate story depicted in Fig. 1, we note that the number of scientific papers originating in United States universities given in (S&EI) grew significantly more slowly during 1981–1991 than the associated R&D numbers. But reading the footnote in (S&EI) raises a clear warning signal. The paper numbers given in this source are for a constant set of journals! If science expands but the number of journals is kept constant, the total number of papers cannot really change much (unless they get shorter). United States academic papers could also expand in numbers if they “crowded out” other paper sources, such as industry and foreign research establishments. But in fact the quality and quantity of foreign science was rising over time, leading to another source of downward pressure on the visible tip of the science output iceberg, the number of published papers. If this is true then the average published paper has gotten better, or at least more expensive, in the sense that the resources required to achieve a certain threshold of results must have been rising in the face of the increase in competition for scarce journal space. Another response has been to expand the set of relevant journals, a process that has been happening in most fields of science but is not directly reflected in the published numbers. (The published numbers do have the virtue of keeping a dimension of the average paper quality constant, by holding constant the base period set of journals. This issue of the unknown and changing quality of papers will continue to haunt us throughout this exercise.)
We have been fortunate in being able to acquire a new set of data (INST100) assembled by ISI (Institute for Scientific Information), the producers of the Science Citations Index, based on a more or less “complete” and growing number of journals, though the number of indexed journals did not grow as fast as one might think (Fig. 2). The INST100 data set gives the number of papers published by researchers from 110 major
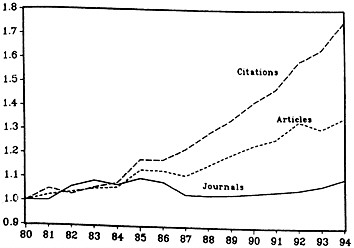
FIG. 2. Publications and Citations, Growth of Components, 1980– 1994, all “science” fields; 1980=1.0 (30).
United States research universities, by major field of science and by university, for the years 1981–1993. (See Appendix A for a somewhat more detailed description of these and related data.) It also gives total citation numbers to these papers for the period as a whole and for a moving 5-year window (i.e., total citations during 1981–1985 to all papers published during this same period). This is not exactly the measure we would want, especially since there may have been inflation in their numbers over time due to improvements in the technology of citing and expansion in the numbers of those doing the citing; but it is the best we have.
There are also a number of other problems with these data. In particular, papers are double counted if authors are in different universities and the number of journals is not kept constant, raising questions about the changing quality of citations as measures of paper quality. The first problem we can adjust for at the aggregate and field level (but not university); the second will be discussed further below. Table 2 shows that when we use the new, “expanding journals set” numbers, they grow at about 2.2% per year faster, in the aggregate. Hence, if one accepts these numbers as relevant, they dispose of about one-half of the puzzle.
Another major unknown is the price index that should be used in deflating academic R&D expenditures. NSF has used the gross domestic product implicit deflator in the Science and Engineering Indicators and its other publications. Recently, the Bureau of Economic Analysis (BEA) produced a new set of “satellite accounts” for R&D (27), and a new implicit deflator (actually deflators) for academic R&D (separately for private and state and local universities).§ This deflator grew significantly faster than the implicit gross domestic product deflator during 1981–1991, 6.6% per year versus 4.1%. It grew even faster relative to the BEA implicit deflator for R&D performed in industry, which is only growing at 3.6% per year during this period. It implies that doing R&D in universities rather than in industry became more expensive at the rate of 3% per year! This is a very large discrepancy, presumably produced by rising fringe benefits and overhead rates, but it is not fully believable, especially since one’s impression is that there has been only modest growth in real compensation per researcher in the academy during the last 2 decades. But that is what the published numbers say! They imply that if we switch to counting papers in the “expanding set” of journals and allow for the rising relative cost of doing R&D in universities, there is no puzzle left. The two series grow roughly in parallel. But
|
§ |
See also National Institutes of Health Biomedical Research and Development Price Index (1993) (unpublished report) and Jankowski (28). |
Table 1. United States academic science by major field in 1989
|
Field |
Total R&D, millions of dollars |
No. of papers S&EI |
No. of papers (UD) INST100 |
Citations 5 years (DU) |
Citations per paper 5 years* |
|
Biology |
2,638 |
29,862 |
28,271 |
536,453 |
16.4 |
|
Chemistry |
608 |
9,025 |
10,276 |
117,403 |
10.6 |
|
Mathematics |
214 |
3,367 |
3,013 |
11,231 |
3.1 |
|
Medicine |
3,828 |
34,938 |
25,885 |
399,983 |
13.4 |
|
Physics |
775 |
11,392 |
12,447 |
150,927 |
9.8 |
|
Subtotal |
8,063 |
88,584 |
79,892 |
1,215,997 |
|
|
All sciences and engineering |
15,016 |
99,215 |
107,674 |
1,404,993 |
|
|
UD, unduplicated; DU, duplicated paper and citation counts. *Duplicated citations per duplicated paper. |
|||||
it does leave the question, to be pursued further on another occasion, why are the costs of doing academic R&D rising this fast? Is that a different manifestation of diminishing returns (rising costs) to it?
Fig. 3 adds these new measures to Fig. 1 and shows that the concern about diminishing returns at the aggregate level was an artifact of the “fixed journals” aspect of the official data and the use of the implicit gross domestic product deflator to deflate academic R&D. In the aggregate, the new measure of the total number of papers still grows more slowly than the NSF-deflator-based “real” R&D expenditures but is now close to the growth rate of the BEA-deflator-based R&D numbers. On the other hand, total citations, which one is tempted to interpret as “quality” weighted paper numbers, grow at about the same rate as appropriately lagged and weighted NSF-based R&D numbers and significantly faster than the similar BEA-based numbers. (The citation numbers were adjusted for the growing double-counting of multi-authored papers across universities.)
Of course, these new numbers must also be interpreted with care. There are both factual and conceptual questions that need further investigation. To what extent does the time profile in the growth of papers and citations in the INST100 data set represent actual growth in the size of the relevant scientific literatures or does it just reflect the “coverage” expansion by ISI of an already existing body of literature? A more difficult question, given the public-good nature of scientific papers, is raised by the growing number of citations that come from an expansion in the size of the interconnecting literatures and also from changes in citation practices. If Russians are suddenly allowed to read Western science and publish in Western
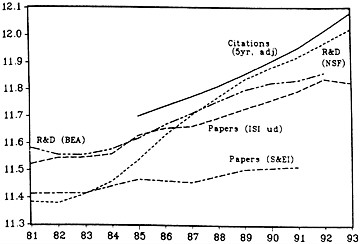
FIG. 3. United States Academic Science: Alternative Views, 1981– 1993, log scale. Citations: 5-year moving sum to papers in t to t-4, adjusted for duplication in interuniversity paper counts. See text for more detail. Authors’ calculations from data bases and sources described in Appendix.
journals, and if their journals are now indexed by ISI, should that be counted as an increase in the output of United States science? Is science in 1990 better than in 1980 just because it reaches more scientists today? Yes, in its public-good effect. Not necessarily so, if we want a pure production concept. But before we continue this discussion we shall first turn to consider some of these issues at the more “micro” field-by-university level.
Fields
Table 1 shows the levels of our major variables in 1989, for five different fields of science: biology, chemistry, mathematics, medicine, and physics (we have excluded the more amorphous field of engineering and technology, the social sciences, and several other smaller fields, such as astronomy). The first two columns are based on data from (S&EI) for all United States academic institutions (1). The second half of this table is based on a new unpublished data set from ISI and refers to the top 110 research universities. (See the Data Appendix for more detail.) The five fields that we shall examine accounted for about 54% of total academic R&D in 1989 and 74% of all scientific papers (in the INST100 data set). Within these fields biology and medicine clearly dominate, accounting for 80% of total R&D in this subset of fields and 50% of all papers.
Table 2 gives similar detail by major field of science. If one uses the NSF-(S&EI)-based R&D and paper numbers, all of the examined fields have done badly. Switching to the INST100 population, BEA implicit indexes deflated R&D, and the unduplicated number of papers in the ISI “expanding journals” set, biology, chemistry, and physics, are now doing fine, but medicine and especially mathematics still seem to be subject to diminishing returns. The numbers look better if one uses total citations as one’s “output” measure, but after adjusting them for growing duplication (we can make this adjustment only at the total field level) the story of mathematics is still a puzzle, and adding computer sciences does not solve it.¶
Fields by Universities
To try and get a better understanding of what is happening to research productivity we turn to the less aggregated and more relevant level of fields in individual universities. We say more relevant because with more disaggregated data we are likely to match better research outputs with research inputs. In principle, data on the individual research project would improve the match, but these data are not available.
We have reasonable data on approximately 50 universities, 5 science fields, and 21 years (see Appendix). In reality we have two distinct time series on numbers of scientific papers attrib-
|
¶ |
The parallel numbers (in Table 2) for mathematics and computer sciences combined are: 7.8, 5.6, NA (not available), 1.7, 1.4, 1.2, (0.9). |
Table 2. United States academic science annual growth rates by selected field and total (all fields)
|
|
Total R&D 1979–91 |
Papers S&EI 1981–91, % |
Papers, INST100 1981–91 |
Citations 1981–85 to 1989–93 |
|||
|
Field |
SE&I,* % |
BEA,† % |
DU, % |
UD, % |
DU, % |
UDA, % |
|
|
Biology |
5.3 |
3.1 |
–1.0 |
3.7 |
3.2 |
7.2 |
(6.7) |
|
Chemistry |
5.0 |
2.8 |
2.1 |
3.6 |
3.5 |
4.4 |
(4.3) |
|
Mathematics |
4.2 |
2.0 |
–2.3 |
0.6 |
0.2 |
0.5 |
(0.1) |
|
Medicine |
6.1 |
3.9 |
1.0 |
3.2 |
2.4 |
5.3 |
(4.7) |
|
Physics |
4.3 |
2.2 |
3.9 |
6.4 |
5.6 |
5.9 |
(5.1) |
|
Total |
5.1 |
2.9 |
1.0 |
3.6 |
2.8 |
5.7 |
(4.9) |
|
UD, unduplicated; DU, duplicated counts; UDA, duplicate counts adjusted by the estimated rate of duplication in paper counts. *From S&EI, deflated by the gross domestic product deflator. †Deflated by the BEA R&D deflator. |
|||||||
uted to a particular university, one from Computer Horizons (CHI) covering 1973–1984, the other from ISI covering 1981– 1993. In addition we have citation data from ISI for the second period only, which appear in the form of five-year moving sums or “windows,” and are thus overlapping from year to year. Therefore, for the analysis of citations we use just three effectively non-overlapping windows ending in 1985, 1989, and 1993, but appropriately recentered on 1982, 1986, and 1990 because of the timing of citations, which are concentrated on the earlier years of any window.
Table 3 shows that the universities in our sample accounted for about two-thirds of the R&D, papers, and citations in the full INST100 data from ISI covering the top 110 research universities in the year 1989.
We estimate several versions of a “production function,” of the form
γ=α+βW(r)+γX+λt+u,
where y is the logarithm of one of our measures of output (papers or citations), W(r) is the logarithm of a distributed lag function of past R&D expenditures, or the number of S&Es, or both, X is a set of other “control” variables such as type of school, and t is a time trend or a set of year or period dummy variables, whereas u represents all other unaccounted forces determining this particular measure of output. Our primary interest centers on the parameters β and λ. The first would measure the returns to the scale of the individual (or rather, university) research effort level, if everything else were correctly specified in this equation, while the second, will indicate the changing general level of “technology” used to convert research dollars into papers or citations.
Table 4 summarizes our estimates of this relationship. The first two columns report the estimated coefficients of the logarithm of lagged R&D with weights 0.25, 0.5, and 0.25, respectively, for R&D lagged one, two, and three years, and the coefficients of a linear time trend, based on two different paper series and different time periods. The estimated R&D coefficients hover around 0.5, indicating rather sharply diminishing returns to the individual university effort, with medicine having a somewhat higher coefficient and mathematics an even lower one.|| Again, except for mathematics, the trend coefficients are positive and significant, indicating that this tendency to diminishing returns at the individual university level is counteracted to a significant extent by the external contribution of the advances in knowledge in the field (and in science) as a whole, arising both from the R&D efforts in other universities, other institutions (such as the National Institutes of Health), and other countries. Other variables included in the list of Xs, such as indicators whether a university was listed among the top 10 research universities, whether it was private, and the size of its doctoral program, were significant and contributed positively to research “productivity” but did not change the estimated β and λ coefficients significantly.
Columns 3 and 4 of Table 4 use 5-year sums of papers and citations centered on 1982, 1986, and 1990 as their dependent variables. They pool the three non-overlapping cross-sections, allowing for different year constants and including the above mentioned “type of school” control variables. For the citation regressions we redefine our R&D variable to reflect the fact that the dependent variable includes citations to 5 years worth of papers, but in different proportions. We assume, and it is consistent with the available evidence, that each of the 5-year windows of citations refers only to 4 years of lagged papers in 1, 2, 3, and 4 proportions.** Combined with our assumed 3-year lag of papers behind R&D, this gives a relatively long lag structure for the 5-year citations relevant distributed lag of R&D (CWRD: 0.025, 0.100, 0.200, 0.300, 0.275, 0.100).
The results of using 5-year sums of papers (column 3) are essentially the same as those using annual numbers (columns 1 and 2). The estimated R&D coefficients in the citations regressions (column 4) are significantly higher, however, in all fields, by about 0.1+. Since these are basically cross-sectional results, they are not an artifact of the expanding journal universe and indicate that additional R&D investments pro-
Table 3. Regression sample as a fraction of total INST100 population in 1989 and growth rates of major variables
|
|
|||||||
|
Growth rates |
|||||||
|
Field |
No. of universities |
Total R&D |
Papers |
Citations |
Total R&D* 1979–91 |
Papers 1981–91 DU |
5-year citations (81–85)–(89–93) DU |
|
Biology |
54 |
0.78 |
0.69 |
0.58 |
2.5 |
3.7 |
7.0 |
|
Chemistry |
55 |
0.83 |
0.67 |
0.68 |
2.0 |
3.7 |
4.7 |
|
Mathematics |
53 |
0.66 |
0.69 |
0.73 |
2.3 |
0.6 |
0.5 |
|
Medicine |
47 |
0.69 |
0.58 |
0.58 |
2.4 |
3.2 |
5.1 |
|
Physics |
52 |
0.69 |
0.63 |
0.63 |
0.9 |
5.5 |
5.8 |
|
DU, duplicated counts. *BEA deflator. |
|||||||
Table 4. “Output” regressions: Coefficient of lagged 3-year average R&D and trend
|
|
Papers (annual) |
Pooled cross-sections centered on 1982, 1986, 1990 |
Eight-year difference 1982–1990 |
|||||
|
Field |
CHI 1976–1984 |
INST100 1981–1993 |
Papers (5 year) |
Citations (5 year) |
Papers |
Citations |
||
|
Biology |
0.625 |
0.517 |
0.553 |
0.682 |
0.063 |
0.170 |
||
|
Chemistry |
0.434 |
0.510 |
0.475 |
0.687 |
0.187 |
0.318 |
||
|
Mathematics |
0.365 |
0.419 |
0.408 |
0.543 |
0.171 |
0.179 |
||
|
Medicine |
0.717 |
0.582 |
0.625 |
0.711 |
0.015* |
–0.058* |
||
|
Physics |
0.478 |
0.511 |
0.511 |
0.643 |
0.173 |
0.263 |
||
|
Trend |
|
1989 |
1993 |
1989 |
1993 |
1985–1993 |
1985–1993 |
|
|
Biology |
0.024 |
0.025 |
0.09* |
0.21 |
0.17 |
0.41 |
0.04 |
0.06 |
|
Chemistry |
0.015 |
0.022 |
0.07* |
0.17 |
0.06* |
0.20 |
0.03 |
0.04 |
|
Mathematics |
–0.023 |
–0.002* |
–0.00 |
–0.01* |
–0.03* |
–0.11* |
0.01* |
0.00* |
|
Medicine |
0.032 |
0.024 |
0.15 |
0.23 |
0.19 |
0.42 |
0.03 |
0.06 |
|
Physics |
0.025 |
0.050* |
0.23 |
0.41 |
0.21 |
0.39 |
0.07 |
0.06 |
|
*Not “significantly” different from zero at conventional statistical test levels. |
||||||||
duce not only more papers but also higher quality papers (at least as measured by the average number of citations that they receive). When we run regressions of citation numbers on both paper numbers and R&D, both variables are “significant,” with the papers coefficient at about 1.1, indicating some increasing returns in terms of citations to the size of the research output unit (perhaps a larger opportunity for self-citation?), and a consistently significant R&D coefficient of about 0.1+ . Still, the “total” R&D coefficients in column 4 are far below unity.
Formal R&D expenditures may not measure correctly the total research resource input, especially in smaller institutions. The only other resource measure available to us is total S&Es (within the field and university). Table 5 looks at the effect of varying the measure of science input on the estimated elasticities of science output. We compare the distributed lag function of real R&D of Table 4 with a similar distributed lag function of S&Es, and for good measure we report a third specification that includes both S&Es and real R&D per S&E. The output measures are 5-year windows of papers and citations. However, data on scientists and engineers by field and university were not collected after 1985 so that we can use only two cross sections of papers and citations centered on 1982 and 1986, not the three reported in Table 4. All variables are in logarithms.
The results of this switch are interesting. The elasticities reported in Table 5 are all highly significant by conventional standards, but the elasticities calculated using S&Es are on average 0.26 higher: the paper elasticity clusters around 0.8 rather than 0.5, whereas the citation elasticity is 0.9 on average rather than 0.6. When we add R&D per S&E as a separate variable the main effect of S&Es is about the same but there is an additional effect, generally somewhat smaller yet still significant, of per capita R&D. These findings suggest that not all research is financed by grants, but that departments with more generous support per researcher are more productive. More of the research in the smaller programs is being supported by teaching funds, because the S&E input measure is larger in these programs relative to real R&D. This interpretation is borne out by the comparison between biology, medicine, and chemistry, where a larger fraction of researchers earn grants, with mathematics and physics, where grants are less common. The jump in the elasticity when S&Es are substituted for R&D is only 0.1 for chemistry, biology, and medicine but it is 0.5 for mathematics and physics. Of course, in all of the fields we are counting total S&Es, not research S&Es. Fewer of these are researchers in the smaller programs, so that to some extent the human resources used in research are being overstated, more so in the smaller programs than in the larger ones.
The last column of Table 4 reports parallel results using an 8-year difference in these moving average variables, allowing thereby for the possible influence of unmeasured individual university effects on research productivity. (The same is also true for the 4-year difference-based results, not shown, using the S&E variables reported in Table 5.) The estimated R&D coefficients are now much smaller, though still “significant,” except for medicine, where they effectively vanish, indicating that there is a large university effect that dominates this result and that there is little information in the changes in R&D or S&E numbers during this period.
There may also be problems arising from the differential truncation caused by the 5-year window in the ISI data. If larger R&D programs are directed to more basic questions they could be producing a smaller number of more and longer cited papers. Thus, cutting off the citation count at 5 years
Table 5. “Output” regressions: Coefficient of lagged 3-year average R&D or S&Es
|
|
Coefficients of R&D or S&Es* |
|||||
|
|
Papers† (5 year) |
Citations† (5 year) |
||||
|
Field |
R&D* |
S&Es* |
S&Es, R&D per S&E‡ |
R&D‡ |
S&Es‡ |
S&Es, R&D per S&E‡ |
|
Biology |
0.64 |
0.85 |
0.91, 0.27 |
0.80 |
0.96 |
1.04, 0.45 |
|
Chemistry |
0.48 |
0.67 |
0.68, 0.38 |
0.71 |
0.85 |
0.88, 0.63 |
|
Mathematics |
0.41 |
0.88 |
0.75, 0.26 |
0.57 |
1.07 |
0.86, 0.44 |
|
Medicine |
0.68 |
0.67 |
0.73, 0.55 |
0.82 |
0.78 |
0.86, 0.67 |
|
Physics |
0.51 |
0.93 |
0.85, 0.22 |
0.65 |
1.11 |
0.96, 0.38 |
|
Biology and medicine combined |
0.75 |
0.68 |
0.81, 0.59 |
0.99 |
0.82 |
1.03, 0.89 |
|
All reported coefficients are statistically “significantly” different from zero at conventional significance levels. *Two-year pooled cross-sections, 1982 and 1986. †Output variables. ‡Input variables. |
||||||
would differentially underestimate their contribution. That something like that may be happening can be seen in Table 6, where we report parallel results for a cross-section based on 13 years of citations (in 1981) and compare it to another single-year cross-section of papers (in 1989) with only 5 years worth of citations. The longer window does yield higher coefficients, but only in the life sciences (biology and medicine) is the difference substantively significant. Moreover, there is no indication that if the window were lengthened even further, the estimated coefficients would approach unity. In parallel intermediate different window-length regressions (not shown here), the estimated coefficients peak around the 9–11-year window and do not rise significantly thereafter.
Looking at the estimated year constants in the lower half of Table 4 we see that they are all substantial in size and statistically “significant” by 1993, except for mathematics. Allowing for the growth in multi-university papers (based on the numbers in Table 2) would reduce these numbers somewhat, but not substantially (to 0.37 for biology, 0.19 chemistry, 0.36 medicine, and 0.33 physics in the 1993 citations column). Dividing these numbers by 8 (the difference in years between 1993 and 1985) would give another estimate of the contribution of “external” science, per year, to research productivity.
An alternative interpretation for an estimated β < 1 would focus on the possibility of errors in allocating both R&D expenditures and papers within universities to particular fields. If papers in universities are created both by research expenditures in the designated fields and by research expenditures in other relevant or misclassified fields within the university, then an aggregate regression, aggregating over all fields of interest, may yield higher R&D coefficients. That is what may be implied by the last row in Table 6, where the coefficients based on aggregated data are significantly higher and now approach unity. Note that this measures either errors or within university across fields of science spillovers. It does not reflect possible contributions of new knowledge eminating from other universities and countries. (This finding requires additional analysis to check its robustness against other unmeasured university effects and different field aggregations.)
It is especially difficult to separate biology from medicine. In the final line of Table 5 we collapse biology and medicine into a biomedical composite. The results suggest that there is indeed some difficulty in distinguishing R&D in biology from R&D in medicine, since the composite R&D elasticity is higher than the R&D elasticities computed separately for biology and medicine. The results of the aggregation for the S&E measure are more mixed and appear to be an average of the separate estimates.
At this time there are many loose ends in the analysis. As indicated above, we have only started exploring the data available to us and the range of possible topics it could throw some light on. In the intermediate run we could do more with the panel structure of the data and with other indications of university quality. We could also explore directly within-university spillovers from neighboring fields of science and the role of Ph.D. training in the research productivity nexus. In the
Table 6. Impact of window length: Citations as a function of lagged R&D
|
|
Coefficients of |
||
|
Field |
13-year total 1981 papers |
5-year total 1989 papers |
Difference |
|
Biology |
0.841 |
0.546 |
0.295 |
|
Chemistry |
0.727 |
0.687 |
0.040 |
|
Mathematics |
0.620 |
0.562 |
0.058 |
|
Medicine |
0.881 |
0.574 |
0.307 |
|
Physics |
0.658 |
0.661 |
–0.003 |
|
Five fields combined |
0.970 |
0.889 |
0.081 |
longer run and with more resources, better data could be assembled, allowing us to analyze citations to single year papers and to more finely defined fields. All of this, however, will still leave us looking “within” science, at its internal output, without being able to say much about its overall, external societal impact.
An Inconclusive Conclusion
From the numbers we have one could conclude that United States academic science has been facing diminishing returns in terms of papers produced per R&D dollar, both because of the rising cost of achieving new results within specific scientific fields and because of rising competition due to the expanding overall size of the scientific enterprise, both within the United States and worldwide, impinging on a relatively slowly growing publication outlets universe. In terms of total citations achieved per R&D dollar, the picture is somewhat brighter, indicating a rising quality of United States science in the face of such difficulties, though this interpretation is clouded by the question whether the actual science is better or is it just being evaluated on a larger and changing stage (the growing number of journals and papers in the world as a whole and changing citation practices).
Even though the within-science costs of new knowledge may be rising, its social value may also be rising as our economy grows and also as it continues to contribute to a growing worldwide economy. But to measure this will require different data and different modes of analysis. Just trying to connect it to the growth of the gross national product will not do, since most of the output of science goes into sectors where its contribution is currently not counted.†† Measuring the true societal gains from medical advances or from the vast improvements in information technology is in principle possible but far from implementable with the current state of economic and other data. That is a most important task that we should all turn to. But right now, unfortunately (or is it fortunately?), we have to leave it for another day.
Data Appendix
The data at the field and university level used in this paper derive from NSF Surveys and two bibliometric sources. We took total R&D expenditures from the CASPAR data base of universities created for the NSF (Quantum Research Corporation, 1994; ref. 31). The underlying source for university R&D is the NSF’s annual Survey of Scientific Expenditures at Universities and Colleges, which collects R&D by science and engineering discipline, source of funds, and functional category of expenditures. R&D is available for the entire period 1973–1992 with the exception of a few disciplines. Our R&D deflators are the BEA’s newly available sectoral R&D price indexes, which convert current dollar R&D expenditures into constant 1987 dollars separately for private and public universities.
The data on papers and citations come from two distinct sources. The earlier data were produced for NSF by CHI and cover the period 1973–1984, based on the original ISI tapes. These earlier data report numbers of papers by university and field published in an expanding set of the most influential journals in science, rising in number from about 2100 journals in 1973 to about 3300 in 1984. The later data were constructed by the ISI itself for the 1981–1993 period. Thus, we have an overlapping period in the two data sets for comparative purposes. The journal selection criteria are slightly different in the ISI data than for CHI and the number of journals is somewhat larger. At this time the ISI journal set includes
roughly 4000 journals in the sciences and 1500 journals in the social sciences. A second difference from the CHI data is that ISI counts multiple authored papers in different universities as whole papers up to 15 times, whereas CHI assigns equal shares of the papers to different universities based on the number of authors in different universities.
A final difference is that the CHI data follow the CASPAR fields to the letter, whereas the ISI data on papers and citations by university and field appear originally in a more disaggregated form than the biological and medical fields of our regressions. We combined “biology and biochemistry” and “molecular biology and genetics” to form biology. We combined “clinical medicine,” “immunology,” “neuroscience,” and “pharmacology” to form medicine.
The later ISI data contain more measures of scientific output in the universities and fields than the CHI data. There are two measures of numbers of papers: the number published in a particular year, and the number published over a 5-year moving window. Added to this are two measures of citations to the papers: cumulative total citations to papers published in a particular year through 1993 and total citations to papers published over a 5-year moving window over the course of that window. Each of these output measures has some limitations that stem from the concept and interval of time involved in the measurement. Numbers of papers do not take into account the importance of papers, whereas total citations do. Especially in the larger research programs it is the total impact that matters, not the number of papers, however small. Turning to citations, cumulative cites through 1993 suffer from truncation bias in comparing papers from different years. A paper published in 1991 has only a small part of the citations it will ever get by 1993, whereas a paper published in 1981 has most of them intact. The time series profile of cites will show a general decline in citations, especially in short panels, merely because earlier vintages of papers have decreasing periods in which to draw cites. The second measure available to us—the 5-year moving window of cites to papers published in the same window—is free of this trended truncation bias. However, there is still a truncation bias in the cross-section owing to the fact that better papers are cited over a longer period. Thus, total cites are to some extent understated in the better programs over the 5 years in comparison to weaker programs. This problem could be gotten around by using a 10–12-year window on the cites, but then we are stuck with one year’s worth of data and we would be unable to study trends.
Another point about the data used in the regressions, as opposed to the descriptive statistics, is that they cover an elite sample of top United States universities that perform a lot of R&D. The number of universities is 54 in biology, 55 in chemistry, 53 in mathematics, 47 in medicine, and 52 in physics. These universities are generally the more successful programs in their fields among all universities. Their expenditures constitute roughly one-half of all academic R&D in each of these areas of research. It turns out that, for the much larger set of universities that we do not include, the data are often missing or else the fields are not represented in these smaller schools in any substantive way. The majority of high-impact academic research in the United States is in fact represented by schools that are in our samples. Remarkably, and as if to underscore the skewness of the distribution of academic R&D, it is still true that the research programs in our sample display an enormous size range.
We are indebted to JianMao Wang for excellent research assistance and to the Mellon Foundation for financial support. We are also indebted to Lawrence W.Kenny for encouraging us to investigate the role of S&Es, as well as real R&D.
1. National Science Board (1993) Science and Engineering Indicators: 1993 (GPO, Washington, DC).
2. Adams, J.D. (1990) J. Political Econ. 98, 673–702.
3. Stephan, P.E. (1996) J. Econ. Lit., in press.
4. Griliches, Z. (1994) Am. Econ. Rev. 84 (1), 1–23.
5. Jorgenson, D.W. & Fraumeni, B.M. (1992) in Output Measurement in the Service Sectors, NBER Studies in Income and Wealth, ed. Griliches, Z. (Univ. Chicago Press, Chicago), Vol. 55, pp. 303–338.
6. Rosenberg, N. & Nelson, R.R. (1993) American Universities and Technical Advance in Industry, CEPR Publication No. 342 (Center for Economic Policy Research, Stanford, CA).
7. Henderson, R., Jaffe, A.B. & Trajtenberg, M. (1995) Universities as a Source of Commercial Technology: A Detailed Analysis of University Patenting 1965–1988, NBER Working Paper 5068, (Natl. Bureau of Econ. Res., Cambridge, MA).
8. Katz, S., Hicks, D., Sharp, M. & Martin, B. (1995) The Changing Shape of British Science (Science Policy Research Unit, Univ. of Sussex, Brighton, England).
9. Levin, R., Klevorick, A., Nelson, R. & Winter, S. (1987) in Brookings Papers on Economic Activity, Special Issue on Microeconomics, eds. Baily, M. & Winston, C. (0), Brookings Inst., Washington, DC. 783–820.
10. Mansfield, E. (1991) Res. Policy 20, 1–12.
11. Mansfield, E. (1995) Rev. Econ. Stat. 77 (1), 55–65.
12. Griliches, Z. (1958) J. Political Econ. 64 (5), 419–431.
13. Nelson, R.R. (1962) in The Rate and Direction of Economic Activity, ed. Nelson, R.R. (Princeton Univ. Press, Princeton), pp. 549–583.
14. Weisbrod, B.A. (1971) J. Political Econ. 79 (3), 527–544.
15. Mushkin, S.J. (1979) Biomedical Research: Costs and Benefits (Ballinger, Cambridge, MA).
16. Griliches, Z. (1964) Am. Econ. Rev. 54 (6), 961–974.
17. Evenson, R.E. & Kislev, Y. (1975) Agricultural Research and Productivity (Yale Univ. Press, New Haven, CT).
18. Huffman, W.E. & Evenson, R.E. (1994) Science for Agriculture (Iowa State Univ. Press, Ames, IA).
19. Griliches, Z. (1979) Bell J. Econ. 10 (1), 92–116.
20. Van Raan, A.F.J. (1988) Handbook of Quantitative Studies of Science and Technology (North-Holland, Amsterdam).
21. Elkana, Y., Lederberg, J., Merton, R.K., Thackray, A. & Zuckerman, H. (1978) Toward a Metric of Science: The Advent of Science Indicators (Wiley, New York).
22. Stigler, G.J. (1979) Hist. Political Econ. II, 1–20.
23. Cole, J.R. & Cole, S. (1973) Social Stratification in Science (Univ. Chicago Press, Chicago).
24. Price, D.J. de S. (1963) Little Science, Big Science (Columbia Univ. Press, New York).
25. Adams, J.D. (1993) Am. Econ. Rev. Papers Proc. 83 (2), 458–462.
26. Pardey, P.G. (1989) Rev. Econ. Stat. 71 (3), 453–461.
27. Bureau of Economic Analysis, U.S. Department of Commerce (1994) Surv. Curr. Bus. 74 (11), 37–71.
28. Jankowski, J. (1993) Res. Policy 22 (3), 195–205.
29. Griliches, Z. (1987) Science 237, 31–35.
30. ISI (1995) Science Citation Index (ISI, Phildelphia).
31. Quantum Research Corp. (1994) CASPAR, CD Rom version 4.4 (Quantum Res., Bethesda).


