
This paper was presented at a colloquium entitled “Science, Technology, and the Economy,” organized by Ariel Pakes and Kenneth L.Sokoloff, held October 20–22, 1995, at the National Academy of Sciences in Irvine, CA.
Flows of knowledge from universities and federal laboratories: Modeling the flow of patent citations over time and across institutional and geographic boundaries
ADAM B.JAFFEabAND MANUEL TRAJTENBERGc
aBrandeis University and National Bureau of Economic Research, Department of Economics, Waltham, MA 02254–9110; and cTel Aviv University and National Bureau of Economic Research, Department of Economics, Tel Aviv 69978, Israel
ABSTRACT The extent to which new technological knowledge flows across institutional and national boundaries is a question of great importance for public policy and the modeling of economic growth. In this paper we develop a model of the process generating subsequent citations to patents as a lens for viewing knowledge diffusion. We find that the probability of patent citation over time after a patent is granted fits well to a double-exponential function that can be interpreted as the mixture of diffusion and obsolescense functions. The results indicate that diffusion is geographically localized. Controlling for other factors, within-country citations are more numerous and come more quickly than those that cross country boundaries.
The rate at which knowledge diffuses outward from the institutional setting and geographic location in which it is created has important implications for the modeling of technological change and economic growth and for science and technology policy. Models of endogenous economic growth, such as Romer (1) or Grossman and Helpman (2), typically treat knowledge as completely diffused within an economy, but implicitly or explicitly assume that knowledge does not diffuse across economies. In the policy arena, ultimate economic benefits are increasingly seen as the primary policy motivation for public support of scientific research. Obviously, the economic benefits to the United States economy of domestic research depend on the fruits of that research being more easily or more quickly harvested by domestic firms than by foreign firms. Thus, for both modeling and policy-making purposes it is crucial to understand the institutional, geographic, and temporal dimensions of the spread of newly created knowledge.
In a previous paper Henderson et al. (3) we explored the extent to which citations by patents to previous patents are geographically localized, relative to a baseline likelihood of localization based on the predetermined pattern of technological activity. This paper extends that work in several important dimensions. (i) We use a much larger number of patents over a much longer period of time. This allows us to explicitly introduce time, and hence diffusion, into the citation process, (ii) We enrich the institutional comparisons we can make by looking at three distinct sources of potentially cited patents: United States corporations, United States universities, and the United States government. (iii) The larger number of patents allows us to enrich the geographic portrait by examining separately the diffusion of knowledge from United States institutions to inventors in Canada, Europe, Japan, and the rest of the world, (iv) Our earlier work took the act of citation as exogenous, and simply measured how often that citation came from nearby. In this paper we develop a modeling framework that allows the generation of citations from multiple distinct locations to be generated by a random process whose parameters we estimate.
The Data
We are in the process of collecting from commercial sources a complete data base on all United States patentsd granted since 1963 (≈2.5 million patents), including data for each indicating the nature of the organization, if any, to which the patent property right was assigned; the names of the inventors and the organization, if any, to which the patent right was assigned; the residence of each inventore; the dates of the patent application and the patent grant; and a detailed technological classification for the patent. The data on individual patents are complemented by a file indicating all of the citations made by United States patents since 1977 to previous United States patents (≈9 million citations). Using the citation information in conjunction with the detailed information about each patent itself, we have an extremely rich mine of information about individual inventive acts and the links among them as indicated by citations made by a given patent to a previous one.
We and others have discussed elsewhere at great length the advantages and disadvantages of using patents and patent citations to indicate inventions and knowledge links among inventions (3–5). Patent citations perform the legal function of delimiting the patent right by identifying previous patents whose technological scope is explicitly placed outside the bounds of the citing patent. Hence, the appearance of a citation indicates that the cited patent is, in some sense, a technological antecedent of the citing patent. Patent applicants bear a legal obligation to disclose any knowledge that they might have of relevant prior inventions, and the patent examiner may also add citations not identified by the applicant.
Our basic goal in this paper is to explore the process by which citations to a given patent arrive over time, how this process is affected by characteristics of the cited patent, and how differ-
The publication costs of this article were defrayed in part by page charge payment. This article must therefore be hereby marked “advertisement” in accordance with 18 U.S.C. §1734 solely to indicate this fact.
|
b |
To whom reprint requests should be addressed, e-mail: jaffe@binah.cc.brandeis.edu. |
|
d |
By “United States patents,” we mean in this context patents granted by the United States Patent Office. All of our research relies on United States patents in this sense. Currently, about one-half of United States patents are granted to foreigners. Hence, later in the paper, we will use the phrase United States patents to mean patents granted to residents of the United States, as opposed to those granted to foreigners. |
|
e |
The city and state are reported for United States inventors, the country for inventors outside the United States. |
Table 1. Simple statistics for patent subsamples
|
|
United States corporations |
United States universities |
United States government |
|
Range of cited patents |
1963–1990 |
1965–1990 |
1963–1990 |
|
Range of citing patents |
1977–1993 |
1977–1993 |
1977–1993 |
|
Total potentially cited patents |
88,257 (1 in 10) |
10,761 (Universe) |
38,254 (Universe) |
|
Total citations |
321,326 |
48,806 |
109,729 |
|
Mean citations |
3.6 |
4.5 |
2.9 |
|
Mean cited year |
1973 |
1979 |
1973 |
|
Mean citing year |
1986 |
1987 |
1986 |
|
Cited patents by field, % |
|||
|
Drugs and medical |
4.89 |
29.12 |
3.36 |
|
Chemicals excluding drugs |
30.37 |
28.71 |
20.73 |
|
Electronics, optics, and nuclear |
26.16 |
27.39 |
45.40 |
|
Mechanical |
28.18 |
9.51 |
17.09 |
|
Other |
10.39 |
5.28 |
13.42 |
|
Citations by region, % |
|||
|
United States |
70.6 |
71.8 |
70.8 |
|
Canada |
1.6 |
1.7 |
1.7 |
|
European Economic Community |
14.5 |
13.2 |
16.8 |
|
Japan |
11.3 |
11.0 |
8.6 |
|
Rest of world |
1.9 |
2.4 |
2.1 |
ent potentially citing locations differ in the speed and extent to which they “pick up” existing knowledge, as evidenced by their acknowledgment of such existing knowledge through citation. Because of the policy context mentioned above, we are particularly interested in citations to university and government patents. We recognize that much of the research that goes on at both universities and government laboratories never results in patents, and presumably has impacts that cannot be traced via our patent citations-based research. We believe, however, that at least with respect to relatively near-term economic impacts, patents and their citations are at least a useful window into the otherwise “black box” of the spread of scientific and technical knowledge.
The analysis in this paper is based on the citations made to three distinct sets of “potentially cited” patents. The first set is a 1-in-10 random sample of all patents granted between 1963 and 1990 and assigned to United States corporations (88,257 patents). The second set is the universe of all patents granted between 1965 and 1990 to United States universities, based on a set of assignees identified by the Patent Office as being universities or related entities such as teaching hospitals (10,761 patents).f The third set is the universe of patents granted between 1963 and 1990 to the United States government (38,254 patents). Based on comparisons with numbers published by the National Science Foundation, these patents are overwhelmingly coming from federal laboratories, and the bulk come from the large federal laboratories. The United States government set also includes, however, small numbers of patents from diverse parts of the federal government. We have identified all patents granted between 1977 and 1993, which cite any of the patents in these three sets (479,861 citing patents). Thus we are using temporal, institutional, geographic, and technological information on over 600,000 patents over about 30 years.
Some simple statistics from these data are presented in Table 1. On average, university patents are more highly cited, despite the fact that more of them are recent.g Federal patents are less highly cited than corporate patents. But it is difficult to know how to interpret these averages, because many different effects all contribute to these means. First, the differences in timing are important because we know from other work that the overall rate of citation has been rising over time (7), so more recent patents will tend to be more highly cited than older ones. Second, there are significant differences in the composition of the different groups by technical field. Most dramatically, university patents are much more highly concentrated in Drugs and Medical Technology and less concentrated in Mechanical Technology, than the other groups. Conversely, the federal patents are much more concentrated in Electronics, Optics, and Nuclear Technology than either of the other groups, with less focus on Chemicals. To the extent that citation practices vary across fields, differences in citation intensities by type of institution could be due to field effects. Finally, different potentially citing locations have different field focuses of their own, with Japan more likely to cite Electronics patents and less likely to cite Drug and Medical patents. The main contribution of this paper is the exploration of an empirical framework in which all of these different effects can be sorted out, at least in principle.
The Model
We seek a flexible descriptive model of the random processes underlying the generation of citations, which will allow us to estimate parameters of the diffusion process while controlling for variations over time and technological fields in the “propensity to cite.” For this purpose we adapt the formulation of Caballero and Jaffe (7), in which the likelihood that any particular patent K granted in year T will cite some particular patent k granted in year t is assumed to be determined by the combination of an exponential process by which knowledge diffuses and a second exponential process by which knowledge becomes obsolete. That is:
p(k, K)=α(k, K) exp[–β1(k, K)(T – t)]
× [1–exp(–β2 (T–t))],
[1]
where β1 determines the rate of obsolescence and β2 determines the rate of diffusion. We refer to the likelihood determined by Eq. 1 as the “citation frequency,” and the citation frequency as a function of the citation lag (T—t) as a citation
|
f |
There are, presumably, university patents before 1965, but we do not have the ability to identify them as such. |
|
g |
In previous work (6), we showed that university patents applied for up until about 1982 were more highly cited than corporate patents, but that the difference has since disappeared. |
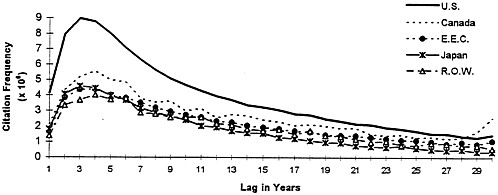
FIG. 1. Plot of the average citation functions for each of five geographic regions (citation frequency as a function of time elapsed from each potentially cited patent).
function. The dependence of the parameters α. and β1 on k and K is meant to indicate that these could be functions of certain attributes of both the cited and citing patents. In this paper, we consider the following as attributes of the cited patent k that might affect its citation frequency: t, the grant year of the potentially cited patent; i = 1..3, the institutional nature of the assignee of the potentially cited patent (corporate, university, or government); and g=1..5, the technological field of the potentially cited patent. As attributes of the potentially citing patent K that might affect the citation likelihood we consider: T, the grant year of the potentially citing patent, and L=1..5, the location of the potentially citing patent.
To illustrate the plausibility of this formulation, we plot the average citation functions (citation frequency as a function of time elapsed from the potentially cited patent), for each of the five geographic regions in Fig. 1. This figure shows that citations display a pattern of gradual diffusion and ultimate obsolescence, with maximal citation frequency occurring after about 5 years. The contrasts across countries in these raw averages are striking: United States patents are much more likely to cite our three groups of United States patents than are any other locations, with an apparent ranking among other regions of Canada, Rest of World (R.O.W.), European Economic Community (E.E.C.), and then Japan. Although many of these contrasts will survive more careful scrutiny, it is important at this point to note that these comparisons do not control for time or technical field effects.
Additional insight into this parameterization of the diffusion process can be gained by determining the lag at which the citation function is maximized (“the modal lag”), and the maximum value of the citation frequency achieved. A little calculus shows that the modal lag is approximately equal to 1/β1; increases in β1 shift the citation function to the left. The maximum value of the citation frequency is approximately determined by β2/β1; increases in β2 holding β1 constant increase the overall citation intensity.h Indeed, increases in β2, holding β1 constant, are very close to equivalent to increasing the citation frequency proportionately at every value of (T—t). That is, variations in β2 holding β1 constant are not separately identified from variations in α. Hence, because the model is somewhat easier to estimate and interpret with variations in α, we do not allow variations in β2.
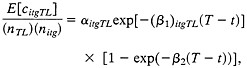
Consider now a potentially cited patent with particular i, t, g attributes, e.g., a university patent in the Drug and Medical area granted in 1985. The expected number of citations that this patent will receive from a particular T, L combination likelihood, as a function of i, t, g, T, and L, times the number of patents in the particular T, L group that are thereby potential citing patents. Even aggregating in this way over T and L, this is still a very small expected value, and so it is not efficient to carry out estimation at the level of the individual potentially cited patent. Instead we aggregate across all patents in a particular i, t, g cell, counting all of the citations received by, e.g., university drug patents granted in 1985, given by, e.g., Japanese patents in 1993. The expected value of this total is just the expected value for any one potentially cited patent, times the number of potentially cited patents in the i, t, g cell. In symbols
[2]
or
[3]
implying that the equation
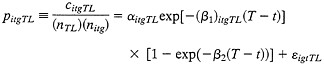
[4]
can be estimated by non-linear least squares if the error εigtTL is well behaved. The data set consists of one observation for each feasible combination of values of i, t, g, T, and L. The corporate and federal data each contribute 9,275 observations (5 values of g times 5 values of L times 28 values of t times either 17 (for years before 1977) or 1993 —t (for years beginning in 1977) values of T.i Because the university patents start only in 1965, there are only 8,425 university cells, for a total number of observations of 26,975. Of these, about 25% have zero citations;j the mean number of citations is about 18 and the maximum is 737. The mean value of pitgTL is 3.3 × 10⁻⁶.
Model Specification and Interpretation
The first specification issue to consider is the difficulty of estimating effects associated with cited year, citing year, and lag. This is analogous to estimating “vintage,” time and age effects in a wage model or a hedonic price model. If lag (our “age” effect) entered the model linearly, then it would be impossible to estimate all three effects. Given that lag enters our model non-linearly, all three effects are identified in principle. In practice, we found that we could not get the model to converge with the double-exponential lag function and separate α parameters for each cited year and each citing year. We were, however, able to estimate a model in which cited years are grouped into 5-year intervals. Hence, we assume that α(t) is constant over t for these intervals, but allow the intervals to differ from each other.
All of the estimation is carried out including a “base” value for β1 and β2, with all other effects estimated relative to a base value of unity.k The various different effects are included by entering multiplicative parameters, so that the estimating equation looks like:
pitgTL= αiαtpαgαTαLexp[–(β1)β1iβIgβIL(T–t)]
× [1– exp(–β2(T–t))] + εigtTL, [5]
where i=c, u, f (cited institution type); t = 1963–1990 (cited year) tp= 1…. 6 (5-year intervals for cited year, except the first interval is 1963–1965); g = 1….5 (technological field of cited patent); T = 1977…1993 (citing year); and L = 1….5 (citing region). In this model, unlike the linear case, the null hypothesis of no effect corresponds to parameter values of unity rather than zero. For each effect, one group is omitted from estimation, i.e., its multiplicative parameter is constrained to unity. Thus, the parameter values are interpreted as relative to that base group.l
The estimate of any particular α(k), say α(g=Drugs and Medical), is a proportionality factor measuring the extent to which the patents in the field “Drugs and Medical” are more or less likely to be cited over time vis à vis patents in the base category “All Other.” Thus, an estimate of α(k=Drugs)=1.4 means that the likelihood that a patent in the field of Drugs and Medical will receive a citation is 40% higher than the likelihood of a patent in the base category, controlling of course for a wide range of factors. Notice that this is true across all lags; we can think of an α. greater than unity as meaning that the citation function is shifted upward proportionately, relative to the base group. Hence the integral over time (i.e., the total number of citations per patent) will also be 40% larger.
We can think of the overall rate of citation intensity measured by variations in α to be composed of two parts. Citation intensity is the product of the “fertility” (7) or “importance” (4) of the underlying ideas in spawning future technological developments, and the average “size” of a patent, i.e., how much of the unobservable advance of knowledge is packaged in a typical patent. Within the formulation of this paper, it is not possible to decompose the α-effects into these two components.m
In the case of α(K), that is, when the multiplicative factor varies with attributes of the citing patents, variations in it should be interpreted as differences in the “propensity to cite” (or in the probability of making a citation) of patents in a particular category vis à vis the base category of the citing patents. If, for example, α(K=Europe) is 0.5, this means that the average patent granted to European inventors is one-half as likely as a patent granted to inventors residing in the United States to cite any given United States patent.
Variations in β1 (again, by attributes of either the cited or the citing patents) imply differences in the rate of decay or “obsolescence” across categories of patents. Higher values of β1 mean higher rates of decay, which pull the citations function downwards and leftward. In other words, the likelihood of citations would be lower everywhere for higher β1 and would peak earlier on. Thus, a higher α means more citations at all lags; a lower β1 means more citations at later lags.
When both α(k, K) and β1(k, K) vary, the citation function can shift upward at some lags while shifting downward at others. For example, if α(g=Electronics)=2.00, but β1(g = Electronics)=1.29, then patents in electronics have a very high likelihood of citations relative to the base category, but they also become obsolete faster. Because obsolescence is compounded over time, differences in β1 eventually result in large differences in the citation frequency. If we compute the ratio of the likelihood of citations for patents in electronics relative to those in “all other” using these parameters, we find that 1 year after being granted patents in electronics are 89% more likely to be cited, but 12 years later the frequencies for the two groups are about the same, and at a lag of 20 years Electronics patents are actually 36% less likely to be cited than patents in the base category.
Results
Table 2 shows the results from the estimation of Eq. 5, using a weighted non-linear least-squares procedure. We weight each observation by nn=(ntgi*nTL)**0.5, where ntgi is the number of potentially cited patents and nTL the number of potentially citing patents corresponding to a given cell. This weighting scheme should take care of possible heteroskedasticity, since the observations correspond essentially to “grouped data,” that is, each observation is an average (in the corresponding cell), computed by dividing the number of citations by (ntgi*nTL).
Time Effects. The first set of coefficients, those for the citing years (αT), and for the cited period (αtp), serve primarily as controls. The αT show a steep upward trend, reaching a plateau in 1989. This reflects a well-known institutional phenomenon, namely, the increasing propensity to make citations at the patent office, due largely to the computerization of the patent file and of the operations of patent examiners. By contrast, the coefficients for the cited period decline steadily relative to the base (1963–1965=1), to 0.65 in 1981–1985, recovering somewhat in 1986–1990 to 0.73. This downward trend may be taken to reflect a decline in the “fertility” of corporate patents from the 1960s until the mid-1980s, with a mild recovery thereafter. The timing of such decline coincides, with a short lag, with the slowdown in productivity growth experienced throughout the industrialized world in the 1970s and early 1980s. This suggests a possible causal nexus between these two phenomena, but further work would be required to substantiate this conjecture.
Technological Fields. We allow both for variations in the multiplicative factor αg and in the β1 of each technological field of the cited patents. Thus, fields with α larger than one are likely to get more citations than the base field at any point in time. On the other hand, the rate of citations to patents in fields with larger β1 decays faster than for others. For example, we see in Table 2 that α(Electronics, etc.) = 2.00, meaning that patents in this field get on average twice as many citations as those in the base field. However, β1 (Electronics, etc.) = 1.29,
|
k |
As noted above, α is not separately identified from β1 and β2..Hence, we do not estimate a “base” value for the parameter α; it is implicitly unity. |
|
l |
The base group for each effect is: Cited time period (tp), 1963–1965; Cited field (g), “All Other”; Type of Cited Institution (i), Corporate; Citing year (T), 1977; Citing region (L), United States. |
|
m |
Caballero and Jaffe (7) attempt to identify the size of patents by allowing exponential obsolescence to be a function of accumulated patents rather than elapsed calendar time. We intend to explore this possibility in future work. |
Table 2. Non-linear least-squares regression results
|
|
Parameter |
Asymptotic standard error |
t-statistic for H0 (Parameter=1) |
|
Citing year effects (Base=1977) |
|
||
|
1978 |
1.115 |
0.03449 |
3.32 |
|
1979 |
1.223 |
0.03795 |
5.88 |
|
1980 |
1.308 |
0.03943 |
7.80 |
|
1981 |
1.400 |
0.04217 |
9.48 |
|
1982 |
1.511 |
0.04637 |
11.01 |
|
1983 |
1.523 |
0.04842 |
10.80 |
|
1984 |
1.606 |
0.05209 |
11.64 |
|
1985 |
1.682 |
0.05627 |
12.12 |
|
1986 |
1.753 |
0.06073 |
12.40 |
|
1987 |
1.891 |
0.06729 |
13.24 |
|
1988 |
1.904 |
0.07085 |
12.76 |
|
1989 |
2.045 |
0.07868 |
13.29 |
|
1990 |
1.933 |
0.07795 |
11.97 |
|
1991 |
1.905 |
0.07971 |
11.36 |
|
1992 |
1.994 |
0.08627 |
11.52 |
|
1993 |
1.956 |
0.08918 |
10.73 |
|
Cited year effects (Base=1963–1965) |
|
||
|
1966–1970 |
0.747 |
0.02871 |
–8.82 |
|
1971–1975 |
0.691 |
0.02820 |
–10.97 |
|
1976–1980 |
0.709 |
0.03375 |
–8.62 |
|
1981–1985 |
0.647 |
0.03647 |
–9.69 |
|
1986–1990 |
0.728 |
0.04752 |
–5.72 |
|
Technological field effects (Base=all other) |
|
||
|
Drugs and medical |
1.409 |
0.01798 |
22.73 |
|
Chemicals excluding drugs |
1.049 |
0.01331 |
3.65 |
|
Electronics, optics, and nuclear |
1.360 |
0.01601 |
22.51 |
|
Mechanical |
1.037 |
0.01370 |
2.69 |
|
Citing country effects (Base=United States) |
|
||
|
Canada |
0.647 |
0.00938 |
–37.59 |
|
European Economic Community |
0.506 |
0.00534 |
–92.49 |
|
Japan |
0.442 |
0.00542 |
–102.99 |
|
Rest of world |
0.506 |
0.00824 |
–59.93 |
|
University/corporate differential by cited time period |
|
||
|
1965 |
1.191 |
0.12838 |
1.49 |
|
1966–1970 |
0.930 |
0.04148 |
–1.70 |
|
1971–1975 |
1.169 |
0.02419 |
7.00 |
|
1976–1980 |
1.216 |
0.01765 |
12.26 |
|
1981–1985 |
1.250 |
0.01718 |
14.55 |
|
1986–1990 |
1.062 |
0.01746 |
3.57 |
|
Federal government/corporate differential by cited time period |
|
||
|
1963–1965 |
0.720 |
0.04592 |
–6.11 |
|
1966–1970 |
0.739 |
0.02498 |
–10.45 |
|
1971–1975 |
0.744 |
0.01531 |
–16.71 |
|
1976–1980 |
0.759 |
0.01235 |
–19.51 |
|
1981–1985 |
0.754 |
0.01284 |
–19.15 |
|
1986–1990 |
0.709 |
0.01551 |
–18.78 |
|
β1* |
0.213 |
0.00247 |
86.28 |
|
β2* |
3.86E-06 |
1.97E-07 |
19.61 |
|
Total observations, 26,975; R-square=0.5161. *t-statistic is for H0, parameter = 0. |
|||
and hence the large initial “citation advantage” of this field fades rather quickly over time. This is clearly seen in Fig. 2, where we plot the predicted citation function for patents in Electronics, Optics, and Nuclear, versus patents in the base field (“All Other”). Patents in electronics are much more highly cited during the first few years after grant; however, due to their faster obsolescence, in later years they are actually less cited than those in the base group.
To grasp the meaning of these estimates, we present in Table 3 the ratio of the citation probability of each of the technological fields, to the citation probability of the base field, at different lags (1, 5, 10, 20, and 30 years after the grant date of the cited patent). Looking again at Electronics, we see that the ratio starts very high at 1.89, but after 12 years it is the same as the base field, after 20 years it declines to 0.64, and declines further to 0.36 after 30 years. This implies that this field is
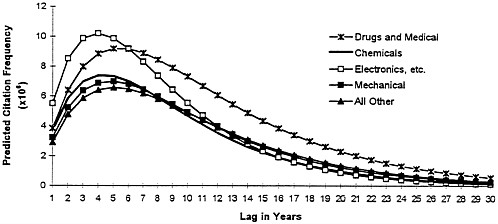
FIG. 2. Plot of the predicted citation function for patents in Electronics, Optics, and Nuclear versus patents in the base field (All Other).
extremely dynamic, with a great deal of “action” in the form of follow-up developments taking place during the first few years after an innovation is patented, but also with a very high obsolescence rate. Thus, a decade later the wave of further advances subsides, and 30 years later citations have virtually ceased. Commonly held perceptions about the technological dynamism of this field are thus amply confirmed by these results, and given a precise quantitative expression.
For other fields the results are perhaps less striking but still interesting. Drugs and Medical begins at 133% of the base citation frequency, but due to the low obsolescence rate it actually grows over time (at a slow pace), so that 20 years later it stands at 170% relative to the base field. Again, this is shown graphically in Fig. 2 and numerically in Table 3. The conjecture here is that due to the long lead times in pharmaceutical research, including the process of getting approval from the Federal Drug Administration, follow-up developments are slow in coming. Thus, whereas in Electronics a given innovation has very little impact 10–20 years later because the field is evolving so fast, in pharmaceuticals a new drug may still prompt follow-up innovations much later, after its medical and commercial viability have been well established.
As to the Chemical field, we see that it starts off at 127% of the base field, but due to a high obsolescence rate the advantage fades over time (though not as fast as in Electronics), falling behind the base field in less than a decade. The Mechanical field is similar to the base field, slowly losing ground over time. Note that after 20 years the ranking of fields changes dramatically compared with the ranking at the beginning, suggesting that allowing for variations in both α and β1 is essential to understand the behavior of fields over time.
Institutional Type. To capture the various dimensions of institutional variations we interact the a of each institutional type with the cited period (except for corporate, which serves as the base), and allow also for differences across institutions in the rate of decay β1. The results show that the estimates of β1 for universities and for Government are less than 1, but only
Table 3. Citation probability ratio by technological field
|
|
Lag, yr |
|||||
|
Technological field |
β1 |
1 |
5 |
10 |
20 |
30 |
|
Drugs and medical |
0.932 |
1.33 |
1.40 |
1.50 |
1.71 |
1.96 |
|
Chemical |
1.158 |
1.27 |
1.12 |
0.96 |
0.70 |
0.51 |
|
Electronics, etc. |
1.288 |
1.89 |
1.50 |
1.13 |
0.64 |
0.36 |
|
Mechanical |
1.054 |
1.11 |
1.06 |
1.01 |
0.91 |
0.81 |
|
Other |
1.000 |
1.00 |
1.00 |
1.00 |
1.00 |
1.00 |
slightly so, and hence we limit the discussion to variations in α (see Table 4 for the effects of the variations in β1.)
Ignoring 1965, we see that university patents became increasingly more “fertile” than corporate ones in the 1970s and early 1980s, but their relative citation intensity declined in the late 1980s. This confirms and extends similar results that we obtained in previous work (6). Government patents, on the other hand, are significantly less fertile than corporate patents, with a moderate upward trend over time (from 0.59 in 1963– 1966 to 0.68 in 1981–1985), except for a decline in the last period. Their overall lower fertility level may be due to the fact that these laboratories had been traditionally quite isolated from mainstream commercial innovations and, thus, those innovations that they did choose to patent were in some sense marginal. By the same token, one might conjecture that the upward trend in the fertility ratio may be due to the increasing “openness” of federal laboratories, and their efforts to reach out and make their innovations more commercially oriented.
Location. The regional multiplicative coefficients show very significant “localization” effects. That is, patents granted to United States inventors are much more likely to cite previous United States patents than are patents granted to inventors of other countries: α for the different foreign regions/countries is in the 0.43–0.57 range, as opposed to the (normalized) value of 1 for the United States. At the same time, though, all foreign Thus, the propensity to cite (i.e., to “absorb spillovers”) for countries except Japan have lower β1 than the United States. Canada and Europe increases over time relative to patents in the base category. This means that the localization effect fades over time. This can be seen clearly in Table 5 and in Fig. 3: the probability that a foreign inventor would cite a patent of a United States inventor is 42–56% lower than that of a United States resident inventor 1 year after grant, but 20 years later the difference has shrunk to 20–36%. The puzzling exception is Japan; the estimates imply that the “receptiveness” of Japanese inventors to United States inventions remains low, since β1 (Japan) does not differ significantly from unity.
Table 4. Citation probability ratio by institution
|
|
Lag, yr |
|||||
|
Research institution |
β1 |
1 |
5 |
10 |
20 |
30 |
|
Universities 1981–1985 |
0.978 |
1.23 |
1.25 |
1.28 |
1.34 |
1.40 |
|
Universities 1986–1990 |
0.978 |
1.08 |
1.10 |
1.12 |
1.18 |
1.23 |
|
Federal Labs 1981–1985 |
0.932 |
0.69 |
0.73 |
0.78 |
0.90 |
1.03 |
|
Federal Labs 1986–1990 |
0.932 |
0.67 |
0.70 |
0.75 |
0.86 |
0.99 |
|
Corporate |
1.000 |
1.00 |
1.00 |
1.00 |
1.00 |
1.00 |
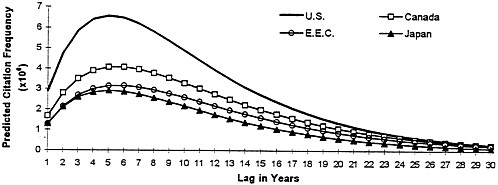
FIG. 3. Frequency of citations to U.S. patents, from patents originating in the United States, the European Economic Community, Canada, and Japan. The localization effect fades over time.
The “fading” effect in the geographic dimension corresponds to the intuitive notion that knowledge eventually diffuses evenly across geographic and other boundaries, and that any initial “local” advantage in that sense will eventually dissipate. Once again, these results offer a quantitative idea of the extent of the initial localization and the speed of fading. Notice also that starting a few years after grant, the differences across regions seem to depend upon a metric of geographic, and perhaps also cultural, proximity: at lag 10, for example, Canada is highest with a coefficient of 0.67, followed by Europe with 0.53, and Japan with 0.44.
Further Results. Finally, the overall estimate of β1=0.2 means that the citation function reaches its maximum at about 5 years, which is consistent with the empirical citation distribution shown in Fig. 1. The R2 of 0.52 is fairly high for models of this kind, suggesting that the postulated double exponential combined with the effects that we have identified fit the data reasonably well.
Conclusion
The computerization of patent citations data provides an exciting opportunity to examine the links among inventions and inventors, over time, space, technology, and institutions. The ability to look at very large numbers of patents and citations allows us to begin to interpret overall citation flows in ways that better reflect reality. This paper represents an initial exploration of these data. Many variations that we have not explored are possible, but this initial foray provides some intriguing results. First, we confirm our earlier results on the geographic localization of citations, but now provide a much more compelling picture of the process of diffusion of citations around the world over time. Second, we find that federal government patents are cited significantly less than corporate patents, although they do have somewhat greater “staying power” over time. Third, we confirm our earlier findings regarding the importance or fertility of university patents.
Table 5. Citation probability ratio by citing geographic area
|
|
Lag, yr |
|||||
|
Location |
β1 |
1 |
5 |
10 |
20 |
30 |
|
Canada |
0.914 |
0.58 |
0.62 |
0.67 |
0.80 |
0.95 |
|
Europe |
0.899 |
0.44 |
0.48 |
0.53 |
0.65 |
0.79 |
|
Japan |
1.002 |
0.44 |
0.44 |
0.44 |
0.44 |
0.44 |
|
Rest of World |
0.900 |
0.44 |
0.48 |
0.53 |
0.64 |
0.78 |
|
United States |
1.000 |
1.00 |
1.00 |
1.00 |
1.00 |
1.00 |
Interestingly, we do not find that university patents are, to any significant extent, more likely to be cited after long periods of time. Finally, we show that citation patterns across technological fields conform to prior beliefs about the pace of innovation and the significance of “gestation” lags in different areas, with Electronics, Optics, and Nuclear Technology showing very high early citation but rapid obsolescence, whereas Drugs and Medical Technology generate significant citations for a very long time.
The list of additional questions that could be examined with these data and this kind of model is even longer. (i) It would be interesting to examine if the geographic localization differs across the corporate, university, and federal cited samples. (ii) The interpretation that we give to the geographic results could be strengthened by examining patents granted in the United States to foreign corporations. Our interpretation suggests that the lower citation rate for foreign inventors should not hold for this group of cited patents. (iii) We could apply a similar model to geographic regions within the United States, although some experimentation will be necessary to determine how small such regions can be and still yield reasonably large numbers of citations in each cell while controlling for other effects, (iv) It would be useful to confirm the robustness of these results to finer technological distinctions, although our previous work with citations data lead us to believe that this will not make a big difference, (v) We would like to investigate the feasibility of modeling obsolescence as a function of accumulated patents. Caballero and Jaffe (7) implemented this approach, but in that analysis patents were not distinguished by location or technological field.
We acknowledge research support from National Science Foundation Grants SBR-9320973 and SBR-9413099.
1. Romer, P.M. (1990) J. Pol Econ. 98, S71-S102.
2. Grossman, G.M. & Helpman, E. (1991) Q.J. Econ. 106, 557–586.
3. Jaffe, A.B., Henderson, R. & Trajtenberg, M. (1993) Q.J. Econ. 108, 577–598.
4. Trajtenberg, M., Henderson, R. & Jaffe, A.B. (1996) University Versus Corporate Patents: A Window on the Basicness of Invention, Economics of Innovation and New Technology, in press.
5. Griliches, Z. (1990) J. Econ. Lit. 92, 630–653.
6. Henderson, R., Jaffe, A.B. & Trajtenberg, M. (1996) in A Productive Tension: University-Industry Research Collaboration in the Era of Knowledge-Based Economic Growth, eds. David P. & Steinmueller, E. (Stanford Univ. Press, Stanford, CA).
7. Caballero, R.J. & Jaffe, A.B. (1993) in NBER Macroeconomics Annual 1993, eds. Blanchard, O.J. & Fischer, S.M. (MIT Press, Cambridge, MA), pp. 15–74.


