
This paper was presented at a colloquium entitled “Earthquake Prediction: The Scientific Challenge,” organized by Leon Knopoff (Chair), Keiiti Aki, Clarence R.Allen, James R.Rice, and Lynn R.Sykes, held February 10 and 11, 1995, at the National Academy of Sciences in Irvine, CA.
Intermediate- and long-term earthquake prediction
(earthquake precursors/California tectonics/earthquake statistics/seismology)
LYNN R.SYKES
Lamont-Doherty Earth Observatory and Department of Geological Sciences, Columbia University, Palisades, NY 10964
ABSTRACT Progress in long- and intermediate-term earthquake prediction is reviewed emphasizing results from California. Earthquake prediction as a scientific discipline is still in its infancy. Probabilistic estimates that segments of several faults in California will be the sites of large shocks in the next 30 years are now generally accepted and widely used. Several examples are presented of changes in rates of moderate-size earthquakes and seismic moment release on time scales of a few to 30 years that occurred prior to large shocks. A distinction is made between large earthquakes that rupture the entire downdip width of the outer brittle part of the earth’s crust and small shocks that do not. Large events occur quasi-periodically in time along a fault segment and happen much more often than predicted from the rates of small shocks along that segment. I am moderately optimistic about improving predictions of large events for time scales of a few to 30 years although little work of that type is currently underway in the United States. Precursory effects, like the changes in stress they reflect, should be examined from a tensorial rather than a scalar perspective. A broad pattern of increased numbers of moderate-size shocks in southern California since 1986 resembles the pattern in the 25 years before the great 1906 earthquake. Since it may be a long-term precursor to a great event on the southern San Andreas fault, that area deserves detailed intensified study.
In the mid 1960s, earthquake prediction emerged as a respectable scientific problem in the United States. Although a major effort to monitor the San Andreas fault in California and the Alaska-Aleutian seismic zone was recommended after the great Alaskan earthquake of 1964, the war in Vietnam diverted funds that might have been used for prediction. While the U.S.S.R., Japan, and China had started major programs in prediction by 1966, very little work on the subject commenced in the United States until the mid to late 1970s. I have been involved in work on earthquake prediction and its plate tectonic basis and on studies of the space-time properties of large earthquakes for about 25 years. From 1984 to 1988, I was Chairman of the U.S. National Earthquake Prediction Evaluation Council (NEPEC). This paper draws upon those experiences and tries to summarize progress made in earthquake prediction on an intermediate term (months to 10 years) and long term (10–30 years). I assess what appear to be fruitful lines of research and monitoring in the United States during the next 20 years.
Rather than discussing earthquakes on a global basis, I emphasize mainly the plate boundary in California where study and monitoring have been underway for many decades and accurate locations of seismic events are available. I focus on those large shocks that break the entire downdip width (W) of the seismogenic zone, i.e., the shallow part of the lithosphere that undergoes brittle deformation (Fig. 1). Large earthquakes are sometimes called delocalize, bounded, characteristic, or plate-rupturing events. Small (i.e., unbounded or localized shocks) rupture only a portion of W.
Large California earthquakes include the 1906 San Francisco, 1989 Loma Prieta, 1992 Landers, and 1966 Parkfield shocks. The latter is among the smallest earthquakes that rupture the entire width W and, hence, is regarded as large in my terminology. The recent Kobe earthquake in Japan also ruptured the entire width of a major strike-slip fault (2). The terms large and small are not synonymous with damaging or lack of damage. A number of small earthquakes have resulted in considerable damage and loss of life when they are located close to population centers, occur at shallow depth, and shake structures with little or no earthquake resistance. Large earthquakes in remote regions often result in little damage.
The frequency-size relationship differs for small and large earthquakes (1). The transition from small to large events occurs at about moment magnitude (Mw) 7.5 for earthquakes along plate boundaries of the subduction type but at only Mw 5.9 for transform faults like the San Andreas (1). This difference is mainly accounted for by the shallow dip of the plate interface at subduction zones, the very steep dip of transform (strike-slip) faults, and the cooling effect of the downgoing plate at subduction zones. W typically extends from at or near the surface to depths of only 10–20 km for strike-slip faults in California and from depths of 10–50 km for interplate thrust events at subduction zones.
In terms of phenomena that change prior to large earthquakes, I emphasize seismic precursors. In California, seismic monitoring is more extensive than other types of geophysical or geochemical measurements, and the record of instrumentally recorded shocks extends back nearly 100 years. Higher stresses and larger changes in stress probably occur along fault zones at depths greater than several kilometers where in situ monitoring is either impossible or prohibitively expensive. Earthquakes of a variety of sizes at depths where premonitory changes are most likely to occur, however, can be studied by using data from local seismic networks.
It is my view that many large earthquakes will turn out to be more predictable on intermediate and long time scales than small events. If so, this is fortunate since many very damaging shocks are large by my terminology. I devote considerable attention to the quasi-periodic nature of large events that rerupture specific fault segments since that property bears strongly upon whether prediction of some kind is likely to be
The publication costs of this article were defrayed in part by page charge payment. This article must therefore be hereby marked “advertisement” in accordance with 18 U.S.C. §1734 solely to indicate this fact.
Abbreviations: M, earthquake magnitude; Mo, seismic moment; Mw, moment magnitude; CFF, Coulomb failure function; NEPEC, National Earthquake Prediction Evaluation Council; W, downdip width; L, rupture length; N, cumulative number of events.
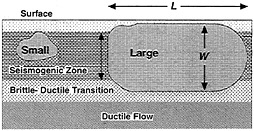
FIG. 1. Two types of earthquakes—small and large. L is rupture length along strike of fault; W is its downdip width (1).
feasible. I criticize the view (3–5) that large shocks, like small, are strongly clustered, not quasi-periodic. Clearly, large shocks are not strictly periodic. I think the important questions are how predictable and how chaotic are large shocks and on what time-space scales? In this review I exclude short-term prediction (time scales of hours to months) since very little progress has been made in that area. For lack of space I also exclude the Parkfield prediction experiment and failure of predictions made for that area.
Earthquakes in the San Francisco Bay Area
Several large earthquakes according to the terminology used herein have occurred in the San Francisco Bay area (Fig. 2) since 1836. Of those events, the greatest amount of information is available (6–10) for the great (Mw 7.7) 1906 earthquake that ruptured a 430-km portion of the San Andreas fault (Fig. 2A), the 1989 Loma Prieta shock of Mw 6.9 that broke a 40-km segment of that fault (Figs. 2C and 3), and the 1868 event (Fig 2D).
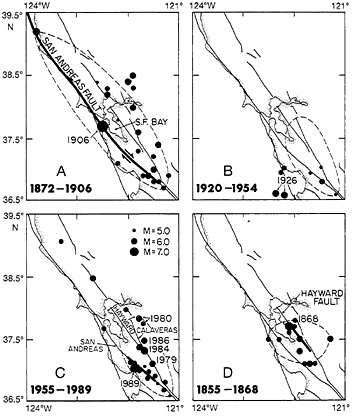
FIG. 2. Distribution of earthquakes of magnitude (M) 5 or larger in San Francisco Bay area for four time intervals (6). Major active faults are shown. Solid circles, epicenters of 1906, 1989, and 1868 earthquakes; heavy solid lines, rupture zones of those three large shocks; dashed lines enclose events taken to be within their precursory areas. Arrows in A denote sense of strike-slip motion along San Andreas fault. Note very low activity near most of 1906 rupture zone from 1920 to 1954 and higher activity in periods before large three events.
on the Hayward fault of Mw 6.8. Not as much is known about the shock of Mw ≥7.2 of 1838 that ruptured the San Andreas fault from just south of San Francisco to opposite San Jose but also is inferred to have ruptured the adjacent Loma Prieta segment to the southeast based on a comparison of shaking at Monterey in 1838 and 1906 (7, 8). Intensity reports (i.e., qualitative descriptions of seismic shaking) become more reliable after 1850.
Changes in Rates of Moderate-Size Earthquakes. The frequency of moderate-size shocks, herein taken to be events of 5 ≤ M < 7, where M is earthquake magnitude, has varied by as much as a factor of 20 in the Bay area during the past 150 years (6, 12, 13). From 1882 until the great 1906 shock, activity was very high along faults in the area out to about 75 km from those segments of the San Andreas fault that ruptured subsequently in 1906 (Fig. 2A). Those moderate-size events are well enough located based on intensity reports that most, and perhaps all, occurred on faults other than the San Andreas. The northernmost event in Fig. 2A, however, is not well enough located to ascertain on which fault it occurred. Moderate activity dropped off dramatically after 1906 and remained low until about 1955 (Fig. 2B).
Sykes and Nishenko (8) remarked in 1984 that moderate activity increased to the southeast of San Francisco from 1955 to 1982 but in a smaller region than in the 25 years preceding the 1906 earthquake. They concluded that that pattern might represent a long-term precursor to a future event of M=7.0 along the southern 75 km of the San Andreas fault of Fig. 3. That pattern became better developed from 1982 to 1989 (Fig. 2C). The 1989 earthquake, the first large event to occur on the San Andreas fault in the San Francisco Bay area since 1906, was centered along that fault segment (Figs. 2C and 3). A similar pattern of moderate activity occurred from 1855 to 1868 in the area surrounding the coming 1868 shock on the Hayward fault (Fig. 2D). Moderate-sized events shut off in the region after 1868 and did not resume for 13 years.
The patterns of activity that stand out strongly in Fig. 2 are increased rates of moderate-size shocks in the 20–30 years preceding the three large events. The size of the region of increased activity appears to scale with the length of the rupture zone of the coming large event (Fig. 2), being much longer for the 1906 earthquake. Moderate activity decreased greatly after the 1868 and 1906 shocks. It is reasonable to ask if these changes are an artifact of either differing methods of determining M or the completeness of catalogs. The record is complete for M≥5 since 1910 and, except in the far northern part of Fig. 2, for M≥5.5 since 1850 (6, 14, 15). The values of M prior to 1906, which are based mainly on the sizes of the felt areas of shocks, are probably underestimated with respect to more recent instrumental values (13). Thus, the large number of events in Fig. 2A prior to the 1906 shock is not an artifact of overestimating M. Most of the changes in frequency of occurrence of earthquakes in the Bay area are confined to moderate-size events. The rate of smaller earthquakes in the entire area has remained nearly constant (13).
Changes in Rate of Release of Seismic Moment. Looking for changes in the cumulative number (N) of events ≥M, as in the previous section, suffers from the fact that small changes in the determination of M near the lower cutoff used can affect N at about a factor of 1.5. Since the number of small earthquakes in a large region follows the relationship
log N=A−bM [1]
and b is close to 1.0, about half of the cumulative numbers of events are found between M and M+0.3. Most of the seismic moment (Mo) released in a region, however, is contained in the few largest earthquakes. The cumulative moment release as a function of time, ΣMo, is not very sensitive to the lower cutoff
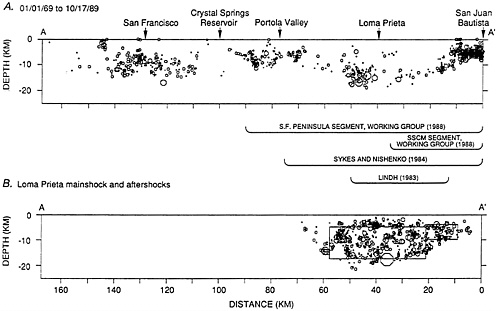
FIG. 3. Seismicity along the San Andreas fault, 1969–1989, from north of San Francisco at left to San Juan Bautista at right (10). The size of symbols increases with magnitude. (A) Brackets indicate fault segments forecast by various authors as discussed in text. SSCM is Southern Santa Cruz Mountains segment of fault. (B) Rectangles give location of 1989 rupture zone as inferred from geodetic data (11). Distance is measured to northwest along fault from San Juan Bautista.
in M but is to the values of Mo for the largest few events sampled.
ΣMo was computed for shocks of M≥5 prior to the three large events in Fig. 2 and before the Mw 6.0 earthquake of 1948 in southern California (6). ΣMo was calculated only for shocks within the precursory areas outlined in Fig. 2. Those areas were chosen qualitatively to include most of the region in which major changes in activity occur with time. They extend out to about the same distance in Fig. 2C where the rate of small shocks was found to differ significantly before and after the 1989 earthquake (16, 17). ΣMo increases nearly exponentially with time prior to each of those four large earthquakes with a time constant τ of 4–11 years.
Thus, the release of Mo, like the frequency of moderate-size events, is concentrated in the latter part of the time interval between large shocks along a given fault segment. Several other examples of high rates of moderate activity preceding large earthquakes are given in ref. 6. Thus, changes in N and Mo qualify as intermediate- to long-term seismic precursors.
Probabilities of Large Shocks Along Segments of San Andreas Fault. During the last 15 years, a consensus has developed among workers studying the San Andreas fault that stresses are built up as a result of the relative motion of the Pacific and North American plates and that fault segments that ruptured a relatively small amount in their last large earthquake are more likely to rerupture sooner than segments that experienced relatively large displacement (8–10, 15, 18). For example, the Parkfield segment of the San Andreas fault has ruptured historically about every 22 years in shocks of about Mw 6 with an average displacement of 0.5–1.0 m. Some other segments of the San Andreas rupture in shocks of Mw≈7.5 with displacements of several meters and repeat times of 100–400 years. Changes in fault strike, presence of a major compressive (transpressive) fault step, relatively low fluid pressures at depth, and unusually large W probably contribute to a fault segment being a so-called asperity (i.e., a difficult place to rupture) and hence to its being a segment with a long repeat time and particularly large M. Nevertheless, a quantitative understanding of why a segment ruptures with a certain Mw is lacking. This is an area in which considerable progress could be made in understanding fault mechanics during the next 20 years.
The term “characteristic earthquake” has been used in various ways in the literature to describe the slip behavior of large shocks. One view based on detection of prehistoric earthquakes in trenches was that large events are nearly exact duplicates of previous prehistoric events in terms of displacement as a function of distance (L) along a fault (19). Such models suffer, however, from cumulative displacement over many cycles of large shocks being nonuniform along a major fault, a violation of the idea that long-term plate motion is nearly uniform along strike. One of the common features of large earthquakes along plate boundaries is that a fault segment may break by itself one time but in conjunction with one or more adjacent segments another time. The Loma Prieta segment of the San Andreas fault ruptured by itself in 1989, with the adjacent Peninsular segment in 1838, and with yet several additional segments to the north in 1906 (7, 8). This type of behavior is also common for large thrust earthquakes at subduction zones. This undoubtedly contributes to variations in individual repeat times of large events. Thus, the idea that large shocks are like preceding ones in rupturing the same fault segment and in having the same displacement as a function of L is clearly not correct.
Another hypothesis is that a given fault segment ruptures in a large event with a certain “characteristic displacement” that differs from one fault segment to another but remains the same for that segment regardless of whether it breaks alone or in conjunction with another segment (20). This model permits repeat times to differ among segments but for the cumulative
displacement along a fault to be the same when averaged over many cycles of large earthquakes. A variation of this hypothesis is the time-predictable model, wherein the displacement in successive events varies by as much as 1.5–2 and the time interval between large shocks is proportional to the slip in the event that precedes it. Laboratory studies of frictional sliding on precut rock surfaces lend support to this model in that the stress level just before large slip events is a constant and the time interval to the next shock is proportional to the stress drop (or displacement) in the preceding event.
Lindh (18) and Sykes and Nishenko (8) performed the first time-varying probabilistic estimates that segments of four active faults in California would be sites of large earthquakes during 30- and 20-year periods, respectively. For large earthquakes along each segment, their methodology involved identifying the date of the last event, the average and SD of recurrence times, and an estimate of M for each segment. In both papers, wide use was made of the time-predictable model and of time intervals between large historic and prehistoric earthquakes.
Long-Term Forecasts of 1989 Earthquake. In the few years preceding the 1989 shock, a consensus had developed that the southern 75–90 km of the 1906 rupture zone, which had experienced smaller slip than that to the north of San Francisco in 1906, was more likely to rupture sooner than other segments and in an earthquake of smaller M than that of 1906. While most workers focused upon approximately the region that ruptured in 1989, estimates of its size and probability of rupture varied substantially.
Lindh (18) estimated a 30-year probability of 47–83% for a 45-km segment of Fig. 3 rupturing in an event of M 6.5. In talking to him and other U.S. Geological Survey scientists prior to the 1989 earthquake, it was clear to me that they believed that segment had ruptured in an event of M 6.5 in 1865 and the 1838 shock had not broken the southernmost 50 km or so of the 1906 rupture zone. Sykes and Nishenko (8) argued, however, that the 1838 shock ruptured that segment and used both the time interval 1906–1838 and estimates of slip along that segment in 1906 to calculate a high probability of rupture in an event of Mw 7.0 for the period 1983–2003. They indicated a large uncertainty, however, in their probability estimates. A subsequent comparison of felt areas for the 1865 and 1989 shocks indicates that the former did not occur along the San Andreas fault (7).
Considerable debate ensued from 1984 until the Loma Prieta earthquake in October 1989 about the amount of displacement in 1906 along the southernmost 75 km of the 1906 rupture zone. The likelihood of a large event was debated at meetings of NEPEC and in the literature (21, 22). Scholz (21) argued that the segment had a more east-west trend (i.e., was a transpressional feature) and slipped only 1–1.4 m in 1906 compared to the 2.5–4 m typical of rupture on the Peninsular segment to the northwest. By using geodetic data from before and after the 1906 shock, Thatcher and Lisowski (22) argued that slip in 1906 along the entire southernmost 90-km segment of Fig. 3 was 2.6±0.3 m and its 30-year probability of rupture, while high compared to fault segments north of San Francisco, was low for the remainder of the 20th century.
During my chairmanship, NEPEC reviewed the long-term potential of major faults in California. In 1987 I asked members of NEPEC to rate fault segments and areas considered to have a relatively high potential of being sites of large earthquakes in terms of priority for further instrumentation and study (23). I and other members of NEPEC were concerned that a dense monitoring network consisting of a variety of instruments was deployed in the United States only at Parkfield and that such monitoring need to be carried out in several areas to have a reasonable chance of observing precursors to a large earthquake within a few decades. NEPEC reports its findings about the scientific validity of earthquake predictions made by others to the director of the U.S. Geological Survey. He appointed a “working group” of scientists to assess the probabilities of large and damaging earthquakes in California and asked NEPEC to review its report prior to publication in 1988 (9). That study was updated for the Bay area in 1990 (10) and for southern California in 1995 (17). Each study assigned 30-year probabilities to each fault segment considered.
For the southernmost 90 km of the 1906 fault break, the 1988 Working Group adopted a compromise position between the results obtained from surface displacements and geodetic data. Relatively little attention was paid to the question of whether either the 1838 or 1865 shocks broke the southern part of that zone. They assigned a probability of 0.2 for the entire 90-km segment breaking in an M 7 event. They made a separate calculation, however, for the southernmost 35-km segment of that zone (denoted SSCM in Fig. 3) for which they assigned a 0.3 probability of its being the site of an M 6.5 earthquake.
Evaluation of predictions. Of the various long-term predictions, the prediction of Lindh (18) comes closest to forecasting the length of rupture L for the 1989 earthquake and its location (Fig. 3) and in assigning a relative high 30-year probability. His predicted magnitude of 6.5, however, was significantly smaller than the Mw 6.9 of the event itself. The predicted Mw of 7.0 of Sykes and Nishenko (8) was more accurate; their average 20-year probability was relatively large but their predicted L, 75 km, was too large. The latter discrepancy is reduced somewhat if the 12-km rupture zone of the 1990 Chittenden earthquake (Fig. 3), which extended the 1989 rupture to the southeast, is added to that of 40 km for the 1989 shock, as determined from geodetic data and the distribution of early aftershocks.
While refs. 9 and 22 forecast an event of M 7, their 30-year probabilities were low and their forecast of 90 km for L was too large. I take those forecasts to be incorrect. Likewise, the rupture zone predicted by the 1988 Working Group (9) for the SSCM segment only overlaps half of that of the 1989 shock; its predicted M was too small, and the 30-year probability was only 0.3. I agree with Savage (24) that the latter prediction is of doubtful validity in terms of forecasting the 1989 event. He is incorrect, however, in calling his own paper “Criticisms of Some Forecasts of the National Earthquake Prediction Council” (24). NEPEC did review the report of the working group (9) in terms of its general scientific validity but NEPEC itself does not make predictions.
While the title of the summary article in Science on the 1989 earthquake by staff of the U.S. Geological Survey (25) refers to it as “an anticipated event,” the predictions of the two earliest papers (8, 18) were more accurate than the consensus estimates of the 1988 Working Group. Prior to the event responsible agencies of the federal and state governments installed little additional monitoring equipment and took few measures to mitigate the effects of a large earthquake.
Improvements in understanding in hindsight. All of the long-term predictions made prior to the 1989 event assumed the same value of W (Fig. 1) for various parts of the San Andreas fault in the Bay area. It is clear that the 1989 shock ruptured to a greater depth and hence a greater W than was assumed in those calculations. That could, in fact, have been anticipated from the greater depths of small earthquakes close to the Loma Prieta rupture from 1969 to 1989 (Fig. 3). Likewise, it should be expected that large future earthquakes along sections of the San Andreas fault with deeper than normal activity, such as near San Francisco (Fig. 3) and in southern California near San Gorgonio Pass, will release greater than normal Mo per unit length along strike.
Likewise, the 1990 report (10) increased the slip rate assigned to the Peninsular and Loma Prieta sections of the San Andreas fault, leading to smaller calculated repeat times for large shocks by using the time-predictable model. The potential slip accumulated as strain between 1906 and 1989 [i.e., 83.5
years×(19±4 mm/year)=1.6±0.3 m]. A reexamination of the amount of displacement in 1906 across the fault in Wright tunnel (km 51 in Fig. 3), the only place where slip was measured at depth along the southern 75 km of the 1906 rupture zone, gives 1.7–1.8 m (26). Assuming the Loma Prieta segment ruptured in large earthquakes in 1838, 1906, and 1989 gives a mean repeat time of 76 ± 11 years.
Inferences from geodetic data. The Loma Prieta benchmark is the only one that was remeasured in the 1880s after the 1865 and 1868 earthquakes and again soon after the 1906 shock that was close to the fault segment that broke in 1989 (27). While its average displacement in 1906 was 1.2 m, the 95% confidence limits are 0.35 and 2.0 m (27). Simple dislocation models assuming slip on a vertical San Andreas fault about 3 km from that benchmark give about 2.5 m of slip on that fault segment when rupture is assumed to extend from 0 to 10 km (27) and about 2.3 m when it extends to 18 km, the maximum depth of rupture in 1989. Slip deduced in 1906 depends critically upon what fault(s) is (are) assumed to have ruptured, uncertainties in the sparse geodetic data and W. Dislocation models using data from the much denser horizontal geodetic network that existed in 1989 (28) yield a displacement for the Loma Prieta benchmark that differs from the observed (7) by a factor of 1.4. Thus, it is clear in retrospect that not as much weight should have been given to geodetic data in estimating long-term probabilities.
Was the 1989 earthquake the event predicted? Many geoscientists were surprised that the 1989 shock did not produce a clear primary break at the earth’s surface. That expectation arose from widely published photographs of fences and roads that were offset in 1906 along those portions of the fault that traverse more level ground farther north and evidence of offset at the surface in several other large California earthquakes. The southern portion of the 1906 rupture zone, however, traverses mountainous terrain and is the site of a major sinistral (i.e., transpressional) fault offset. Since surface area is not conserved as fault displacement accumulates in many large events, it is the site of considerably tectonic complexity and vertical deformation. Primary faulting at the surface along that segment appears to have been as rare in 1906 as in 1989 (29).
Inversion of various seismological data sets for the 1989 earthquake led to models that differ in the amount and sense of slip as a function of L and W (Fig. 1). Most authors assumed, however, the same best-fitting planar rupture surface that was deduced from geodetic data soon after the earthquake (11) and varied only the rake and slip as a function of L and W, not the strike and dip. All four probably vary in the transpressional offset, and slip probably occurred on more than one fault as judged from aftershocks and vertical displacements in 1989 (14, 30, 31). While one of the inversions of seismic data indicates slip was negligible at depths shallower than 8 km, others do not. I put greater reliance on the loci of aftershocks and the inversion of geodetic data (14, 28, 30–32), which indicate that significant slip in 1989 extended to a shallow depth of 2–5 km and was spatially complex.
One extreme model is that the 1906 and 1989 shocks ruptured different faults—the former, a vertical fault from 0 to 10 km, and the latter, a nearby steeply dipping fault from 10 to 18 km (14, 27). Evidence that rupture in 1989 was as shallow as 2–5 km indicates that a small to negligible W is still available for generating a sizable event at a shallower depth on a steeply dipping fault. An event of Mw 6.5 still could take place in the upper 5 km along a shallow-dipping thrust fault to the northeast of the San Andreas fault (7, 31).
Shaw et al. (32) used the distribution of aftershocks of the 1989 event, focal mechanisms, evidence of geological deformation in the last few million years, and balanced cross sections to derive models of fault and fold structure at depth in the Loma Prieta zone. They conclude that fault strike and dip change from southeast to northwest as the restraining (transpressional) part of the Loma Prieta zone is encountered. They suggest that the orientation of the slip vector in the 1989 event, parallel to the line of intersection of the two fault segments, was not fortuitous and that it permits slip to occur on the two faults without opening subsurface voids. When isostacy is taken into account, they conclude that observed uplift rates are consistent with long-term slip on this section of the San Andreas fault occurring in 1989-type events. Thus, the displacement field of the 1989 earthquake does not appear to be anomalous for the geometry of the restraining bend.
Large Events as a Quasi-Periodic Process
Deficit of Small Shocks Along San Andreas Fault. It has become increasingly clear in the last decade that an extrapolation of Eq. 1 as determined from small earthquakes along a given fault segment seriously underestimates the rate of occurrence of large events along the same feature (19, 33, 34). Thus, large events account for nearly all of the strain energy and seismic moment release along that fault segment. This is demonstrated very clearly for earthquakes along most segments of the San Andreas fault. For the several decades for which a complete record is available, the rate of seismic activity at the M≥3 level has been at a very low level for those segments that ruptured in the great historic earthquakes of 1812 and 1857 in southern California and for its southernmost segment (Fig. 4), which last broke in a great event about 1690
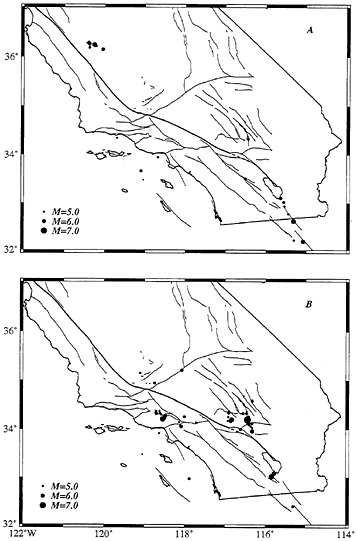
FIG. 4. Earthquakes of M≥5 in southern California from California Institute of Technology catalog. (A) 1977 through 1985. (B) 1985 through 1994. Thin solid lines, active faults; heavier line (dashed where multibranched and poorly delineated in San Gorgonio Pass), San Andreas fault.
(9, 20). Similarly, such activity has remained at a very low level for that portion of the 1906 rupture zone that did not break in 1989 (Fig. 2) and for many decades before 1989 for the Loma Prieta segment (10, 13, 14).
From 1907 to 1995, no earthquakes of M≥6 have occurred along the San Andreas fault itself for the entire 430-km length of the rupture zone of the 1906 shock with but one exception, the 1989 earthquake of Mw 6.9. If Eq. 1 were correct, about 8 events of M≥6 would be expected to have occurred during the interval from 1906 to 1989 for the Loma Prieta segment for reasonable values of the slope, b (i.e., those close to 1.0), and about 80 events of M≥5. During that period the Loma Prieta segment experienced one complete cycle of large shocks.
Low activity along 1989 rupture zone. From 1910, when the catalog of M≥5 becomes complete, until the 1989 shock, only 10 events of 5 ≤ M < 6 occurred along or near the southeastern 75 km (0–75 km in Fig. 3) of the 1906 rupture zone (14, 15). Epicentral locations more precise than a few kilometers only become available starting in 1969 (14). Of the 3 events from 1969 until the 1989 mainshock, the 2 Lake Elsman earthquakes of 1988 and 1989 are well enough located that they clearly occurred on a nearby fault, one of steep but opposite dip (northeast) to the one that ruptured in the Loma Prieta shock. The other, in 1974, occurred well to the east of the San Andreas on the Busch fault. Prior to 1960 epicentral locations for that area are more uncertain than 10 km (14). Four of the remaining 7 events occurred during that period; the other three occurred in 1963, 1964, and 1967. A special study of the 1963 shock (35) indicates that it occurred close to the San Andreas fault but southeast of Parajo gap (15 km in Fig. 3) beyond the 1989 rupture zone and along that part of the San Andreas where fault creep takes place at the surface and small to moderate shocks have been more numerous historically (14). The 1964 event was well enough located (36) to ascertain that it occurred east of the 1989 rupture zone. The 1967 shock of M 5.6 occurred close to the 1989 rupture zone but no special study of its aftershocks or mechanism was published.
Thus, of the 10 events of M≥5 from 1910 until the 1989 mainshock, none occurred on the coming rupture zone itself during the 20 years for which precise locations are available, the 1967 shock may have been on it, and large uncertainties exist in the locations of four events between 1910 and 1959. Hence, 0–5 shocks of M≥5 occurred along the Loma Prieta rupture zone itself during almost a complete earthquake cycle as opposed to 80 predicted from Eq. 1. Also, the rupture zone of the 1989 shock appears to have been very quiet even at the level of the smallest earthquakes detected from 1969 until the 1989 mainshock (14, 31).
Peninsular segment. Likewise, for the Peninsular segment of the San Andreas fault (60–120 km in Fig. 3), an extrapolation of Eq. 1 predicts about 30 events of M≥5.5 and 10 of M≥ 6 between 1838 and 1906, the dates that segment ruptured in large events (Mw >7). The historic record probably is complete for that region for M≥5.5 since about 1850 but not for smaller shocks (13, 15). Only 3 events of 5.5 ≤ M < 6 and none of M≥6 occurred along that segment from 1850 until the 1906 earthquake (6, 13, 15). Only a single event of M≥5 occurred near that segment since 1910 (Fig. 2). Its mechanism, involving mainly dip-slip motion (15), suggests that it was not located on the San Andreas fault. Thus, the record of M≥6 for the 145-year period since 1850 and that of M≥5 since 1910 are at least a factor of 10 lower than rates predicted from shocks of Mw>7 by using Eq. 1.
Southern California. Fig. 4 shows events of M≥5 in southern California for a recent 18-year period. Activity was very low (i.e., a single event) for the San Andreas fault itself. The historic record of the last 100 years indicates similar low levels of activity for the San Andreas even though the Mojave segment to the north of Los Angeles ruptures in large shocks about every 130 years (9, 20).
Large Earthquakes Are Not a Clustered Process. Davison and Scholz (34) examined the frequency of moderate-size earthquakes for segments of the Alaska-Aleutian plate boundary and found that the Mo of large segment-rupturing events was much higher than predicted from an extrapolation of smaller events using Eq. 1. Kagan (5) states that their result was biased by uncertainties in b value, saturation of the magnitude used, and poor knowledge of repeat times of large events. The absence of events of M≥6 and the very small number of shocks of M≥5 along the San Andreas from 1906 to 1989, however, cannot be attributed to those uncertainties.
A possibility is the 1906 and 1989 events broke either different faults separated by a few kilometers or different depth ranges for the same fault. I argued earlier that both are unlikely. Even if each event occurred on a different nearby fault, both involved substantial strike-slip motion and released shear strain energy, not from a fault surface, but from a volume of rock that extends outward about 75 km from each rupture zone. Hence, the drop in strain energy associated with strike slip motion on northwest-trending faults in the Loma Prieta region is similar for most of that volume of rock.
The hypothesis that large and small events differ in many of their properties is supported by simple dynamical models of faults (37, 38) that can be run on computers for thousands of cycles of large events and by observations of the frequency of occurrence of avalanches of various sizes on a large sandpile (39). In both cases small events follow a distribution like Eq. 1 but large events occur much more often than an extrapolation from small events predicts.
A catalog of global shallow earthquakes of Mw ≥7 from 1900 to 1990 indicates a change in b value in Eq. 1 from 1.5 for events of Mw ≥7.5 to 1.0 for smaller shocks (1). In that study N was a cumulative count—i.e., the number of events greater than or equal to Mw. While such a cumulative number, of course, cannot decrease as Mw is reduced, the number per magnitude (or moment) interval does decrease as b changes from 1.5 to 1.0. The interval distribution for the global catalog exhibits a maximum at Mw 7.5 followed by a minimum at a somewhat smaller Mw. Since interplate thrust events dominate the global catalog for Mw ≥7, this behavior is appropriate to those types of events. The fact that b is about 1.5 for shocks of Mw≥7.5 does not mean that large thrust events are rare but merely that the distribution of large earthquakes, when summed (1) over many different segments of plate boundaries, fits Eq. 1 but with a different slope than small events. (It does mean that shocks of Mw 9.5 are rare.) The maximum and minimum in the global distribution are not as extreme as for a single fault segment since W, Mw, and Mo usually differ among segments, resulting in the two extrema being smeared out when summed over many fault segments.
Kagan and Jackson (3) concluded that shocks remaining in several earthquake catalogs (after removal of events involved in short-term clustering like aftershocks) are characterized by clustering, not quasi-periodic behavior. They examined the Harvard catalog for events of Mw≥6.5, claiming Mw 6.5 is large enough to be a plate rupturing (i.e., a large) shock. Since that catalog is dominated by thrust events at convergent plate boundaries, however, Mw 7.5 is an appropriate lower bound for large shocks (1). That and the other catalogs of shallow events they examined are dominated by small, not large, events. Thus, the clustering properties that they find are pertinent to the former, but not the latter.
Some examples of the clustering of large events do exist. Adjacent segments of a major fault often rupture in large events separated by days to years. The 1984 earthquake on the Calaveras fault and the 1989 Loma Prieta event 30 km from it may be considered clustered events but not on the same fault. Individual segments of major faults, however, rarely, if ever, rerupture in large events within a short time. Kagan and Jackson (4) state “earthquakes in the near future will be
similar in location and mechanism to those of the recent past.” That proposition, however, is pertinent to small earthquakes. Most, and perhaps all, large events along a given fault segment occur quasi-periodically in time. The fault segments that rupture in large events that I examined are parts of very active faults, the main loci of plate motion. Whether large shocks in areas of complex multibranched faulting, as in Asia, occur quasi-periodically is yet to be ascertained.
Recent Buildup of Activity in Southern California
Fig. 4 shows earthquakes of M≥5 in southern California for the periods 1977–1985 and 1986–1994. In the first 9-year period, no shocks of that size occurred on or close to the San Andreas fault, while in the second interval, activity occurred on both sides of the San Andreas fault along a 200-km-long zone in the transverse ranges and the northern Los Angeles basin. That pattern of activity, especially the occurrence of several earthquakes of M>6, resembles that in the 25 years before the 1906 earthquake (Fig. 2A). It was not centered near the Landers earthquake.
The possibility that the recent pattern of activity is a long-term precursor to a great earthquake along the southern San Andreas fault deserves serious study and debate. Segments of the fault in that region have not ruptured in great earthquakes since either 1812 or about 1690 (9, 20). Also, changes in stress generated by the Landers sequence of shocks resulted in portions of the fault in San Gorgonio Pass moving closer to failure by about 10 years (40). The San Andreas fault undergoes a complex compressional left step in San Gorgonio Pass that is much larger than that in the Loma Prieta region. Much remains to be learned about the distribution of faults at depth, possible changes in seismic activity, the loci of volumes of weak- and strong-rock, fluid pressures, and the state of stress. An intensified effort is needed to understand that area in detail, which did not happen before the 1989 earthquake. Damage and loss of life may not be greatest in large events such as one on the southern San Andreas. Moderate-size shocks that are part of the buildup to a great earthquake but located closer to centers of population may cause the largest catastrophes. The Northridge event of 1994 may turn out to be such an example.
Discussion and Summary
Time-varying probabilistic estimates of large earthquakes for segments of several active faults in California are now in their second generation (10, 20) and are generally accepted and widely used. Debate continues about the width of the probability function to use either in general or for specific segments. Since those predictions are for 30-year periods, however, the probability gain with respect to a random distribution in time is only about a factor of 1.5–3. Those long-term forecasts, which have replaced the earlier seismic gap concepts of the 1970s, help to focus scarce scientific resources on specific areas and conversely to indicate segments unlikely to rupture in the next few decades. While progress can be expected over the next 20 years in improving those types of forecasts, probability gains likely will remain less than 5–10.
Major changes in the space-time distribution of moderate-size earthquakes have occurred in the San Francisco Bay area during the time intervals between large shocks. Computer modeling of earthquakes (37, 38) and studies of avalanches on a large sandpile (39) show many similarities to those found for shocks in the Bay area. All indicate that large events occur much more frequently than predicted by extrapolating rates of small events. In each case the rate of moderate-size events increases before large events and the dimension of the region of increased activity increases with the size of the coming large event. Much, if not all, of the activity that builds up prior to a large earthquake in the Bay area, however, occurs off its rupture zone on nearby faults. This is an important lesson for prediction and a factor that needs to be incorporated in future computer modeling.
These and three other findings make me moderately optimistic for intermediate- and long-term prediction.
(i) Rates of relative plate motion are virtually constant from a few to a few million years. Plate motion is the driving engine that leads to the buildup of elastic stresses that are released in earthquakes along plate boundaries. Accurate estimates of long-term rates of deformation have become available for many active faults by using space geodesy.
(ii) The key nonlinearity in the earthquake process appears to be associated with the stick-slip frictional force at fault interfaces (37). Most of that effect is concentrated during or close to the rupture time of large shocks. Fortunately, socially useful prediction needs to be attempted only for the next large event, not several such shocks into the future where nonlinear effects become cumulative. A better understanding of the nature of rupture in the last large event seems crucial to long-term prediction. Better modeling of fault interactions should permit a choice of which fault segments will rupture either separately or together in the next large earthquake along the San Andreas fault in southern California.
(iii) I foresee progress being made by recognizing that precursory processes are tensorial in character, not scalar. Stress (and its evolution with time), which is basic to an understanding of the earthquake process, is a second-order tensor. This would explain why increases as well as decreases in seismicity have been reported as precursors. While activity in most of the San Francisco Bay area decreased greatly soon after the great 1906 earthquake, the moderate activity that did take place in the next few decades was largely concentrated south and west of the end of the rupture zone (Fig. 2B) in areas that are predicted from dislocation models to have, in fact, moved closer to failure (15).
Moderate-size shocks are modulated in their occurrence by changes in the Coulomb failure function (∆CFF) at the time of large events (6, 15–17, 31, 40). The ratio of the numbers of small events before to that after the 1989 earthquake for individual nearby fault segments changed in accord with predictions of ∆CFF by using dislocation models (16, 17, 31). These changes occurred for fault segments extending out to 75–100 km from the 1989 rupture zone. This corresponds to ∆CFF > 0.01 to 0.03 MPa, where 1 MPa=10 bars. Those changes are about a factor of 10 times larger than those generated by earth tides. Thus, changes in rates of small earthquakes may become more useful for prediction when individual fault segments are analyzed separately.
Changes in the distribution of moderate-size events in the Bay area of the past 150 years can be explained in terms of a drop in stress at the time of large earthquakes and the slow buildup of stress with time. The 1906 shock created a broad area of reduced shear stress (or CFF) and suppressed moderate activity for many decades until stresses were gradually restored by plate motion. The southern Calaveras fault was one of the first to return to the pre-1906 stress level and was the site of some of the earliest moderate activity prior to 1989 (6, 15, 17).
The pair of Lake Elsman earthquakes of M 5.3 and 5.4 that occurred 16 and 2.5 months before the 1989 mainshock may be interpreted as an intermediate-term precursor. Both occurred on a fault dipping steeply to the northeast ≈2 km from the 1989 rupture zone. Like the 1989 event, they involved strike slip and reverse slip (14, 31). No other moderate-size events occurred on or near the 1989 rupture zone since the shocks of 1964 and 1967. As shear stress was restored in the region, some of the last places to be returned to the pre-1906 level of CFF were faults very close to the San Andreas, like the Lake Elsman fault. Those events resulted in the release of short-term (5 day)
warnings. While they may have had some value in terms of public preparedness, they were, in fact, false alarms.
If it had been realized that the Lake Elsman events were on a nearby but different fault, an intermediate-term warning would have been more appropriate. They probably indicated the return of stresses in that area to pre-1906 levels rather than the initiation of accelerated precursory slip on the San Andreas fault itself. Another example of an intermediate-term seismic precursor is the northward growth in aftershock activity in the Joshua Tree earthquake sequence in southern California between its mainshock on April 23 and the Landers shock of June 28, 1992 (41). While these precursors are subtle in character, they, and other examples, indicate that precursory phenomena likely exist on time scales of months to a decade.
How earthquake prediction is and has been viewed in the United States has a number of parallels to skepticism about continental drift and paleomagnetism prior to the late 1960s. Like them, prediction invokes strong views about what problems are “worth working on.” Earthquake prediction has suffered in this regard; only 10–20 scientists in the U.S. are currently working on intermediate-term prediction. Work in prediction also has suffered from a general belief that only short-term predictions would have social value. While not possible now, a well-founded 5-year prediction could be of greater value since serious mitigation measures could be undertaken.
Several observations of precursors have turned out upon reexamination to be artifacts of either environmental changes affecting instruments or changes in earthquake catalogs that are of human, not natural, origin. A superficial application of the ideas of chaos has led some to conclude that earthquakes are not predictable. Several workers active in studying earthquakes as an example of deterministic chaos, however, are moderately optimistic about prediction. Long- and intermediate-term prediction are areas where I think progress is possible in the next 20 years. Much remains to be done in understanding the physics of earthquakes and the role of fluid pressures at depth in fault zone and in deploying dense networks of a variety of observing instruments.
I thank J.Deng, S.Jaumé, C.Scholz, and B.Shaw for critical comments and discussions. This work was supported by grants from the U.S. Geological Survey, the National Science Foundation, and the Southern California Earthquake Center (SCEC). This is Lamont-Doherty Earth Observatory Contribution 5486 and SCEC contribution 319.
1. Pacheco, J.F., Scholz, C.H. & Sykes, L.R. (1992) Nature (London) 355, 71–73.
2. Summeriville, P. (1995) Eos Trans. Am. Geophys. Union 76, 49–51.
3. Kagan, Y.Y. & Jackson, D.D. (1991) Geophys. J. Int. 104, 117–133.
4. Kagan, Y.Y. & Jackson, D.D. (1994) J. Geophys. Res. 99, 13685–13700.
5. Kagan, Y.Y. (1993) Bull. Seismol. Soc. Am. 83, 7–24.
6. Sykes, L.R. & Jaumé, S.C. (1990) Nature (London) 348, 595– 599.
7. Tuttle, M.P. & Sykes, L.R. (1992) Bull. Seismol Soc. Am. 82, 1802–1820.
8. Sykes, L.R. & Nishenko, S.P. (1984) J. Geophys. Res. 89, 5905–5927.
9. Working Group on California Earthquake Probabilities (1988) U.S. Geol. Surv. Open-File Rep. 88–398, 1–62.
10. Working Group on California Earthquake Probabilities (1990) U.S. Geol. Surv. Circ. 1053, 1–51.
11. Lisowski, M., Preseott, W.H., Savage, J.C. & Johnson, M.J.S. (1990) Geophys. Res. Lett. 17, 1437–1440.
12. Tocher, D. (1959) Calif. Div. Mines Spec. Rep. 57, 39–48 and 125–127.
13. Ellsworth, W.L. (1990) U.S. Geol. Surv. Prof. Paper 1515, 153– 187.
14. Olson, J.A. & Hill, D.P. (1993) U.S. Geol. Surv. Prof. Paper 1550-C, C3-C16.
15. Jaumé, S.C. & Sykes, L.R. (1996) J. Geophys. Res. 101, 765–789.
16. Reasenberg, P.A. & Simpson, R.W. (1992) Science 255, 1687– 1690.
17. Simpson, R.W. & Reasenberg, P.A. (1994) U.S. Geol. Surv. Prof. Paper 1550-F, F55-F89.
18. Lindh, A.G. (1983) U.S. Geol. Surv. Open-File Rep. 83–63, 1–5.
19. Sehwartz, D.P. & Coppersmith, K.J. (1984) J. Geophys. Res. 89, 5681–5698.
20. 1994 Working Group on the Probabilities of Future Large Earthquakes in Southern California (1995) Bull. Seismol. Soc. Am. 85, 379–439.
21. Scholz, C.H. (1985) Geophys. Res. Lett. 12, 717–719.
22. Thatcher, W. & Lisowski, M. (1987) J. Geophys. Res. 92, 4771– 4784.
23. Schearer, C.F. (1988) U.S. Geol. Surv. Open-File Rep. 88–37, 296–300.
24. Savage, J. (1991) Bull. Seismol. Soc. Am. 81, 862–881.
25. U.S. Geological Survey Staff (1990) Science 247, 286–293.
26. Prentice, C.S. & Ponti, D.J. (1994) Eos Trans. Am. Geophys. Union 75, 343 (abstr.).
27. Segall, P. & Lisowski, M. (1990) Science 250, 1241–1244.
28. Snay, R.A., Neugebauer, H.C. & Preseott, W.H. (1991) Bull. Seismol. Soc. Am. 81, 1647–1659.
29. Prentice, C.S. & Sehwartz, D.P. (1991) Bull. Seismol. Soc. Am. 81, 1424–1479.
30. Marshall, G.A., Stein, R.S. & Thatcher, W. (1991) Bull. Seismol. Soc. Am. 81, 1660–1693.
31. Seeber, L. & Armbruster, J.G. (1990) Geophys. Res. Lett. 17, 1425–1428.
32. Shaw, J.H., Bischke, R. & Suppe, J. (1994) U.S. Geol. Surv. Prof. Paper 1550-F, F3-F21.
33. Wesnousky, S.G., Scholz, C.H., Shimazaki, K. & Matsuda, T. (1984) Bull. Seismol. Soc. Am. 74, 687–708.
34. Davison, F.C., Jr., & Scholz, C.H. (1985) Bull. Seismol. Soc. Am. 75, 1349–1361.
35. Udias, A. (1965) Bull. Seismol. Soc. Am. 55, 85–106.
36. McEvilly, T.V. (1966) Bull. Seismol. Soc. Am. 56, 755–773.
37. Carlson, J.M. (1991) J. Geophys. Res. 96, 4255–4267.
38. Pepke, S.L., Carlson, J.M. & Shaw, B.E. (1994) J. Geophys. Res. 99, 6769–6788.
39. Rosendahl, J.M., Vekic, M. & Rutledge, J.E. (1994) Phys. Rev. Lett. 73, 537–540.
40. Jaumé, S.C. & Sykes, L.R. (1992) Science 258, 1325–1328.
41. Hauksson, E., Jones, L.M., Hutton, K. & Eberhart-Phillips, D. (1993) J. Geophys. Res. 98, 19835–19858.


