
8
Fluoride
BACKGROUND INFORMATION
Overview
Fluoride is the ionic form of fluorine, a halogen and the most electronegative of the elements of the periodic table. It is ubiquitous in nature. Fluoride combines reversibly with hydrogen to form the acid, hydrogen fluoride (HF). Much of the physiological behavior of fluoride (for example, its absorption from the stomach, distribution between extra-and intracellular fluid compartments and renal clearance) is due to the diffusion of HF (Whitford, 1996). Owing to its high affinity for calcium, fluoride is mainly associated with calcified tissues. Its ability to inhibit, and even reverse, the initiation and progression of dental caries is well known. It also has the unique ability to stimulate new bone formation, and as such, it has been used as an experimental drug for the treatment of osteoporosis (Kleerekoper and Mendlovic, 1993). Recent evidence has shown an especially positive clinical effect when fluoride (23 mg/day) is administered in a sustained release form (Pak et al., 1997) rather than in forms that are quickly absorbed from the GI tract.
The ingestion of fluoride during the pre-eruptive development of the teeth has a cariostatic effect (it reduces the risk of dental caries) due to the uptake of fluoride by enamel crystallites and formation of fluorhydroxyapatite, which is less acid soluble than hydroxyapatite (Brown et al., 1977; Chow, 1990). Fluoride in the oral fluids, including saliva and dental plaque, also contributes to the cariostat-
ic effect. This posteruptive effect is due mainly to reduced acid production by plaque bacteria and to an increased rate of enamel remineralization during an acidogenic challenge (Bowden, 1990; Hamilton, 1990; Marquis, 1995).
Physiology of Absorption, Metabolism, and Excretion
Fifty percent of orally ingested fluoride is absorbed from the gastrointestinal tract after approximately 30 minutes. In the absence of high dietary concentrations of calcium and certain other cations with which fluoride may form insoluble and poorly absorbed compounds, 80 percent or more is typically absorbed. Body fluid and tissue fluoride concentrations are proportional to the long-term level of intake; they are not homeostatically regulated (Guy, 1979). About 99 percent of the body's fluoride is found in calcified tissues—to which it is strongly but not irreversibly bound. Fluoride in bone appears to exist in both a rapidly exchangeable pool and a slowly exchangeable pool. The former is located in the hydration shells on bone crystallites, where fluoride may be exchanged isoionically or heteroionically with ions in the surrounding extracellular fluids. Mobilization from the slowly exchangeable pool results from the resorption associated with the process of bone remodeling.
The elimination of absorbed fluoride occurs almost exclusively via the kidneys. The renal handling of fluoride is characterized by unrestricted filtration through the glomeruli followed by a variable degree of tubular reabsorption. The extent of reabsorption is inversely related to tubular fluid pH. The renal clearance of fluoride in adults is about 30 to 40 ml/minute (Cowell and Taylor, 1981; Schiffl and Binswanger, 1982; Waterhouse et al., 1980). The rate of fluoride removal from plasma, which in healthy adults is approximately 75 ml/minute, is virtually equal to the sum of the renal and calcified tissues clearances.
The fractional retention or balance of fluoride at any age depends on the quantitative features of absorption and excretion. For healthy, young, or middle-aged adults, approximately 50 percent of absorbed fluoride is retained by uptake in calcified tissues, and 50 percent is excreted in the urine. For young children, as much as 80 percent can be retained owing to increased uptake by the developing skeleton and teeth (Ekstrand et al., 1994a, b). Such data are not available for persons in the later years of life, but based on bone mineral dynamics, it is likely that the fraction excreted is greater than the fraction retained.
Under most dietary conditions, fluoride balance is positive.
Whether it is positive or negative appears to be due to the bloodbone fluoride steady state. When chronic intake is insufficient to maintain or gradually increase plasma concentrations, fluoride excretion by infants (Ekstrand et al., 1984) and adults (Largent, 1952) can exceed the amounts ingested due to mobilization from calcified tissues.
Cariostatic Effect of Fluoride
The cariostatic action of fluoride on erupted teeth of children and adults is due to its effects on the metabolism of bacteria in dental plaque and on the dynamics of enamel de- and remineralization during an acidogenic challenge (Marquis, 1995; Tatevossian, 1990). Plaque fluoride concentrations are directly related to the fluoride concentrations in and frequencies of exposure to water, beverages, foods, and dental products. Fluoride can be deposited in plaque by direct uptake from these sources as well as from the saliva and gingival crevicular fluid after ingestion and absorption from the gastrointestinal tract. Its effects on plaque bacteria involve inhibition of several enzymes, which limits the uptake of glucose and thus reduces the amount of acid produced and secreted into the extracellular plaque fluid (Kanapka and Hamilton, 1971; Marquis, 1995). These effects attenuate the pH drop in plaque fluid that would otherwise occur and, hence, the severity of the acidic challenge to the enamel (Birkeland and Charlton, 1976).
The effects of fluoride on the processes of enamel de- and remineralization in erupted teeth include: (1) a reduction in the acid solubility of enamel; (2) promotion of remineralization of incipient enamel lesions, which are initiated at the ultrastructural level several times each day according to the frequency of eating or drinking foods containing carbohydrates metabolizable by plaque bacteria; (3) increasing the deposition of mineral phases in plaque, which, under acidic conditions produced during plaque metabolism, provide a source of mineral ions (calcium, phosphate, and fluoride) that retard demineralization and promote remineralization; and (4) a reduction in the net rate of transport of minerals out of the enamel surface by inducing the reprecipitation of fluoridated hydroxyapatite within the enamel (Margolis and Moreno, 1990; Ten Cate, 1990). These various mechanisms underlying the protective effects of fluoride on the erupted teeth of children and adults require frequent exposures to fluoride throughout life in order to achieve and maintain adequate concentrations of the ion in dental plaque and enamel.
Factors Affecting the Nutrient Requirement
Bioavailability
In general, the bioavailability of fluoride is high, but it can be influenced to some extent by the vehicle with which it is ingested. When a soluble compound such as sodium fluoride is ingested with water, absorption is nearly complete. If it is ingested with milk, baby formula, or foods, especially those with high concentrations of calcium or certain other divalent or trivalent ions that form insoluble compounds, absorption may be reduced by 10 to 25 percent (Ekstrand and Ehrnebo, 1979; Spak et al., 1982). The absorption of fluoride from ingested toothpaste, whether added as sodium fluoride or monofluorophosphate (MFP), is close to 100 percent (Ekstrand and Ehrnebo, 1980).
Fluoride-Food Component Interactions
The rate and extent of fluoride absorption from the gastrointestinal tract are reduced somewhat by ingestion with solid foods and some liquids, particularly those rich in calcium, such as milk or infant formulas (Spak et al., 1982). Results from studies with rats that had chronically elevated plasma fluoride concentrations showed that a diet high in calcium increases fecal fluoride excretion such that fluoride loss can equal or exceed fluoride intake (Whitford, 1994). It has been suggested that the co-ingestion of fluoride and caffeine or some other methylxanthines increases the bioavailability of fluoride (Chan et al., 1990), but other studies failed to confirm this effect (Chen and Whitford, 1994).
Intake of Fluoride
The halo or diffusion effect reduces the utility of the local water fluoride concentration for estimating daily fluoride intake. This effect results from the transport of foods and beverages prepared with fluoridated water to communities served with water having low fluoride concentrations, and vice versa. The consumption of beverages in the United States and Canada is displacing the consumption of tap or well water (Clovis and Hargreaves, 1988; Pang et al., 1992). In a study of fluoride intake by 225 children aged 2 to 10 years, Pang et al. (1992) reported that total fluid intake ranged from 970 to 1,240 ml/day. Consumption of soft drinks, juices, tea, and other beverages accounted for more than 50 percent of fluid intake and
ranged from 585 to 756 ml/day. The fluoride concentrations ranged from nondetectable to 6.7 mg/liter. The estimated average (± standard deviation [SD]) fluoride intakes from beverages for children aged 2 to 3, 4 to 6 and 7 to 10 years were 0.36 ± 0.3, 0.54 ± 0.5, and 0.60 ± 0.5 mg/day. The maximum fluoride intakes for individual children within these age groups were 1.4, 2.4, and 2.0 mg/day.
The fluoride concentration in human milk ranges from 0.007 to 0.011 mg/liter (Ekstrand et al., 1984; Esala et al., 1982; Spak et al., 1982). Using the mean value of intake of human milk of 780 ml/day (Allen et al., 1991; Butte et al., 1984), this food provides about 0.005 to 0.009 mg/day of fluoride to the nursing infant. Intake by formula-fed infants spans a wide range depending on whether the product is ready to feed or requires the addition of water. The fluoride concentrations of ready-to-feed formulas currently made in the United States generally range from 0.1 to 0.2 mg/liter (Johnson and Bawden, 1987; McKnight-Hanes et al., 1988). Using a mean intake value of 860 ml/day of formula (Specker et al., 1997), bottle-fed infants receive about 0.09 to 0.17 mg/day of fluoride. Ready-to-feed formulas manufactured in Canada have concentrations ranging from 0.15 to 0.3 mg/liter (fluoride content of infant formulas as published by infant formula manufacturers, personal communication to Atkinson S, 1997).
The fluoride concentrations of powdered or liquid-concentrate infant formulas depend mainly on the fluoride concentration of the water used to reconstitute the products. They may be less than or several times higher than those of the ready-to-feed products. Thus, daily intakes by individual infants from these products are highly variable and can range from as little as 0.1 to over 1.0 mg/day of fluoride.
Table 8-1 summarizes the results of seven studies of dietary fluoride intake of children in the United States or Canada that were published from 1943 to 1988. The drinking water fluoride concentrations in fluoridated communities were between 0.7 and 1.1 mg/liter, whereas those in nonfluoridated communities were less than 0.4 mg/liter. The average daily dietary fluoride intakes (expressed on a body weight basis) in fluoridated areas have been relatively constant at about 0.05 mg/kg/day from infancy to early childhood since 1980. In communities without fluoridated water, average intakes have been about 50 percent lower than in fluoridated areas. As noted previously, as beverage consumption by children increases, particularly in communities without fluoridated water, fluoride intake may rise if the water source in the beverage is fluoridated (Pang et al., 1992).
TABLE 8-1 Dietary Fluoride (F) Intake by Childrena
|
mg F/day |
mg F/kg body wt/day |
||||
|
Age |
Fluoridated |
Non-fluoridated |
Fluoridated |
Non-fluoridated |
Reference |
|
1–3 years |
0.42–0.83 |
—b |
0.03–0.10 |
— |
McClure, 1943 |
|
4–6 years |
0.56–1.11 |
— |
0.02–0.09 |
— |
McClure, 1943 |
|
7–9 years |
0.70–1.38 |
— |
0.02–0.07 |
— |
McClure, 1943 |
|
2 months |
0.63 |
0.05 |
0.13 |
0.01 |
Singer and Ophaug, 1979 |
|
4 months |
0.68 |
0.10 |
0.10 |
0.02 |
Singer and Ophaug, 1979 |
|
6 months |
0.76 |
0.15 |
0.09 |
0.02 |
Singer and Ophaug, 1979 |
|
6 months |
0.54 |
0.35 |
0.07 |
0.04 |
Ophaug et al., 1980a |
|
2 years |
0.61 |
0.32 |
0.05 |
0.03 |
Ophaug et al., 1980b |
|
3–6 months |
0.42 |
0.25 |
0.06 |
0.04 |
Dabeka et al., 1982 |
|
9–12 months |
0.56 |
0.28 |
0.05 |
0.03 |
Dabeka et al., 1982 |
|
6 months |
0.42 |
0.23 |
0.05 |
0.03 |
Ophaug et al., 1985 |
|
2 years |
0.62 |
0.21 |
0.05 |
0.02 |
Ophaug et al., 1985 |
|
6 months |
0.4 |
0.2 |
0.05 |
0.03 |
Featherstone and Shields, 1988 |
|
a Data presented as means or ranges. b No data. |
|||||
Ten independent U.S. and Canadian studies published from 1958 to 1987 have shown that dietary fluoride intakes by adults range from 1.4 to 3.4 mg/day in areas where the water fluoride concentration was 1.0 mg/liter. In areas where the water concentration was less than 0.3 mg/liter, the daily intakes ranged from 0.3 to 1.0 mg/day (Cholak, 1959; Dabeka et al., 1987; Filippo and Battistone, 1971; Kramer et al., 1974; McClure and Zipkin, 1958; Osis et al., 1974; Singer et al., 1980, 1985; Spenser et al., 1981; Taves, 1983). With the exception of the study by Taves (1983), each of these studies included fluoride intake from water. On a body weight basis, therefore, dietary fluoride intake by adults is generally lower than it was during the growth period. There was no evidence that dietary fluoride intake in the 1970s and 1980s had increased over that in the 1950s.
Intake from Food
Most foods have fluoride concentrations well below 0.05 mg/100 g (Taves, 1983). Exceptions to this include fluoridated water, beverages and some infant formulas that are made or reconstituted with
TABLE 8-2 Fluoride Concentrations of Foods
|
Fluoride Concentration (mg/liter or kg) |
||
|
Food |
Average |
Range |
|
Fruits |
0.06 |
0.02–0.08 |
|
Meat, fish, poultry |
0.22 |
0.04–0.51 |
|
Oils and fats |
0.25 |
0.02–0.44 |
|
Dairy products |
0.25 |
0.02–0.82 |
|
Leafy vegetables |
0.27 |
0.08–0.70 |
|
Sugar and adjunct substances |
0.28 |
0.02–0.78 |
|
Root vegetables |
0.38 |
0.27–0.48 |
|
Grain and cereal products |
0.42 |
0.08–2.01 |
|
Potatoes |
0.49 |
0.21–0.84 |
|
Legume vegetables |
0.53 |
0.49–0.57 |
|
Nonclassifiable |
0.59 |
0.29–0.87 |
|
Beverages |
0.76 |
0.02–2.74 |
|
SOURCE: Taves, 1983. |
||
fluoridated water, teas, and some marine fish. Because of the ability of tea leaves to accumulate fluoride to concentrations exceeding 10 mg/100 g dry weight, brewed tea contains fluoride at concentrations ranging from 1 to 6 mg/liter depending on the amount of dry tea used, the water fluoride concentration, and brewing time (Cremer and Buttner, 1970; Wei et al., 1989). The concentrations in decaffeinated teas are approximately twice those of caffeinated teas (Chan and Koh, 1996). Muhler (1970) reported fluoride concentrations in marine fish ranging from 0.6 to 2.7 mg/100 g. The samples, however, may have contained bones. More recent studies reported average fluoride values for fish close to 0.05 mg/100 g and a range of 0.01 to 0.17 mg/100 g (Taves, 1983; Whitford, 1996).
Table 8-2 shows the fluoride concentrations of prepared foods that were served to adult hospital patients (Taves, 1983). When preparation required the use of water (for example, some juices, boiling vegetables), the local water, which contained 1.0 mg/liter fluoride, was used. Nonclassifiable foods included certain soups and puddings. The average daily fluoride intake was 1.8 mg, but intake from drinking water was not taken into account. Other investigators (Filippo and Battistone, 1971; Singer et al., 1980) reported an average intake of fluoride of 2.2 and 1.2 mg/day, respectively.
TABLE 8-3 Dietary Fluoride Supplement Dosage Schedule for U.S. and Canadian Children
|
Drinking Water Fluoride Concentration (mg/liter) |
|||
|
Age of Child |
< 0.3 |
0.3–0.6 |
> 0.6 |
|
6 months to 3 years |
0.25a |
0 |
0 |
|
3 to 6 years |
0.50 |
0.25 |
0 |
|
6 to 16 years |
1.00 |
0.50 |
0 |
|
a Fluoride supplement values are given in mg of fluoride per day (2.2 mg sodium fluoride = 1.0 mg fluoride). SOURCE: ADA, 1994; Canadian Paediatric Society, 1996. |
|||
Intake from Dietary Supplements
Table 8-3 shows the recently revised dietary fluoride supplement dosage schedule that was approved for U.S. and Canadian children by the American Dental Association and the American Academy of Pediatrics (ADA, 1994) and the Canadian Paediatric Society (1996). Supplements are available only by prescription and are intended for use by children living in areas with low water fluoride concentrations so that their intake is similar to that by children whose water fluoride concentrations are approximately 1.0 mg/liter. Based on the 1986 National Health Interview Survey (NHIS) data, it is estimated that 15 percent of children in the United States up to aged 5 years and 8 percent of those aged 5 to 17 years use dietary fluoride supplements (Wagener et al., 1995). Supplements are rarely prescribed for adults.
Intake from Dental Products
Intake from fluoridated dental products adds considerable fluoride (Burt, 1992; Whitford et al., 1987), often approaching or exceeding intake from the diet, particularly in young children who have poor control of the swallowing reflex. Although exposures to professionally applied products (for example, rinses and gels with high fluoride concentrations) occur less frequently, they also contribute to fluoride intake. The major contributors to nondietary fluoride intake are toothpastes (Osuji et al., 1988; Simard et al., 1989, 1991), mouth rinses (Bell et al., 1985), and dietary fluoride supplements (Ismail et al., 1990; Pendrys and Stamm, 1990).
Table 8-4 summarizes the findings from several studies of fluoride
TABLE 8-4 Fluoride Ingestion Resulting from the Use of Fluoride-Containing Toothpastes
|
Weight Used per Brushing (g) |
Fluoride Ingested per Brushing (mg) a |
% Ingested |
|||||
|
Age (years) |
Mean |
Range |
Mean |
Range |
Mean |
Range |
Reference Study |
|
3–6 |
—b |
— |
— |
0–2.6c |
— |
— |
Hargreaves et al., 1970 |
|
3–6 |
1.38 |
0.12–3.69 |
0.38 |
0–1.69 |
28 |
0–97 |
Hargreaves et al., 1972 |
|
2–4 |
0.86 |
0.19–2.41 |
0.30 |
— |
35 |
— |
Barnhart et al., 1974 |
|
5–7 |
0.94 |
0.15–2.08 |
0.13 |
— |
14 |
— |
Barnhart et al., 1974 |
|
11–13 |
1.10 |
0.31–2.00 |
0.07 |
— |
6 |
— |
Barnhart et al., 1974 |
|
20–25 |
1.39 |
0.42–3.29 |
0.04 |
— |
3 |
— |
Barnhart et al., 1974 |
|
8–10 |
1.04 |
0.23–2.57 |
0.12 |
0–0.41 |
12 |
0–32 |
Glass et al., 1975 |
|
2–5 |
0.66 |
— |
0.33 |
— |
45 |
— |
Simard et al., 1989 |
|
3–10 |
1.00 |
1.00–1.00 |
0.36 |
0.08–0.82 |
36 |
8–82 |
Salama et al., 1989 |
|
3–5 |
0.49 |
— |
0.14 |
— |
29 |
— |
Naccache et al., 1990 |
|
2 |
0.62 |
— |
0.36 |
— |
65 |
— |
Naccache et al., 1992 |
|
3 |
0.53 |
— |
0.28 |
— |
49 |
— |
Naccache et al, 1992 |
|
4 |
0.45 |
— |
0.24 |
— |
49 |
— |
Naccache et al., 1992 |
|
5 |
0.52 |
— |
0.23 |
— |
42 |
— |
Naccache et al, 1992 |
|
6 |
0.48 |
— |
0.18 |
— |
34 |
— |
Naccache et al., 1992 |
|
7 |
0.50 |
— |
0.18 |
— |
34 |
— |
Naccache et al., 1992 |
|
a Some studies measured the weight (g) of toothpaste ingested which, for a 1,000 ppm F product, would be proportional to the weight (mg) of fluoride ingested. b No data. c Toothpaste fluoride concentration = 2,400 ppm. Amounts of fluoride ingested were based on 24-hour urinary excretions and expressed as mg/day, not mg/brushing. |
|||||||
ingestion by children resulting from the use of toothpastes, the products of most interest because of their widespread and frequent use from an early age (Ronis et al., 1993). Dowell (1981) reported that brushing began for nearly 50 percent of his sample by the age of 12 months and that 75 percent had their teeth brushed at 18 months of age. As shown in Table 8-4, children 7 years of age or younger introduce approximately 0.8 mg of fluoride into the mouth with each brushing; the fraction that is swallowed and absorbed (Ekstrand and Ehrnebo, 1980) ranges from about 10 percent to nearly 100 percent. An average of about 0.30 mg of fluoride is ingested with each brushing by young children. Thus, brushing might contribute about 0.6 mg of fluoride daily, especially if a water rinse is not used after brushing. Similar findings were reported by Bruun and Thylstrup (1988), who studied Danish children.
Effects of Inadequate Fluoride Intake
Many studies conducted prior to the availability of fluoride-containing dental products demonstrated that dietary fluoride exposure is beneficial, owing to its ability to inhibit the development of dental caries in both children and adults (Russell and Elvove, 1951). The results of most of these studies showed that the prevalence of dental caries in communities with optimal water fluoride concentrations (range 0.7 to 1.2 mg/liter, depending on average regional temperature) was 40 to 60 percent lower than in areas with low water fluoride concentrations. The lower concentrations within the optimal range are recommended for warm climates where water intake tends to be greater than in cooler climates. Other studies have shown that the earlier children are exposed to fluoridated water or dietary fluoride supplements, the greater the reduction in dental caries in both the primary and permanent teeth (Hargreaves et al., 1988; Lewis, 1976; Stephen et al., 1987). The lack of exposure to fluoride or the ingestion of inadequate amounts of fluoride at any age places the individual at increased risk for dental caries.
Both the inter-community transport of foods and beverages and the use of fluoridated dental products have blurred the historical difference in the prevalence of dental caries between communities with and without water fluoridation. Brunelle and Carlos (1990) summarized the results of the 1986–1987 national survey conducted by the National Caries Program of the National Institute of Dental Research. The overall difference in caries prevalence between fluoridated and nonfluoridated regions in the United States was 18 percent whereas the majority of earlier studies reported differences of approximately 50 percent. After children with a reported history of exposure to dietary fluoride supplements or topical fluorides were excluded from the analysis, the difference increased to 25 percent. Further, the differences in the prevalence of caries in the seven geographic regions of the United States were inversely proportional to the percentages of water supplies that were fluoridated. In region VII (Pacific), where only 19 percent of the population is served with fluoridated water, the difference in caries scores between fluoridated and nonfluoridated areas was 61 percent. In region III (Mid-west), where 74 percent of the population is served with fluoridated water, the difference was only 6 percent. These findings suggested an important role for the halo or diffusion effect. The results of this survey, like that of the 1979–1980 national survey conducted by the National Caries Program of the National Institute of Dental Re-
search, indicate that water fluoridation continues to be of major importance in the control of dental caries.
ESTIMATING REQUIREMENTS FOR FLUORIDE
Selection of Indicators for Estimating the Fluoride Requirement
Dental Caries
The cariostatic effect of fluoride is a strong indicator for an Adequate Intake (AI) of the ion. Figure 8-1 summarizes the results of the pioneering epidemiological studies of the relationships between the concentration of fluoride in drinking water and dental caries and enamel fluorosis (mottling) (Dean, 1942). Enamel fluorosis is caused by excessive fluoride intake but only during the preeruptive development of the teeth. A fluorosis index value of 0.6 in a community was judged to represent the threshold for a problem of public health significance. As can be seen in Figure 8-1, this value occurred in communities having water fluoride concentrations in the 1.6 to 1.8 mg/liter range. The figure also shows that reduction in the average number of dental caries per child was nearly maximal in communities having water fluoride concentrations close to 1.0 mg/liter. This is how 1.0 mg/liter became the “optimal” concentration. That is, it was associated with a high degree of protection against caries and a low prevalence of the milder forms of enamel fluorosis. The average dietary fluoride intake by children living in optimally fluoridated communities was (and remains) close to 0.05 mg/kg/day (range 0.02 to 0.10 mg/kg/day; Table 8-1).
Both pre- and posteruptive exposures to fluoride have cariostatic effects (Dawes, 1989; Hargreaves, 1992; Horowitz, 1990). Based on data from their long-term study of the cariostatic effects of fluoridated water in the Netherlands, Groeneveld et al. (1990) concluded that: (1) the best effect on dental caries in the permanent teeth was achieved when fluoride was consumed from birth, (2) about 85 percent of the greatest reduction in caries was obtained when fluoride consumption started between ages 3 and 4, (3) about 66 percent of the protective effect for surfaces with high caries susceptibility (pits and fissures) derived from preeruptive fluoride exposure, and (4) about 25 percent of the protective effect for the lower risk, smooth surfaces was attributable to preeruptive fluoride exposure. Several other retrospective clinical studies have shown that the ear-
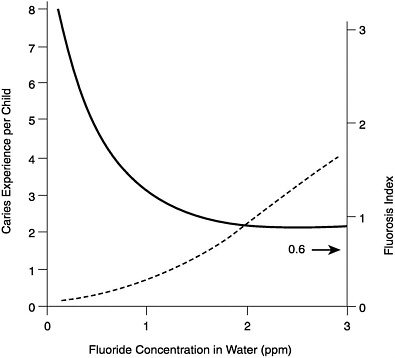
FIGURE 8-1 Relationships among caries experience (solid line), dental fluorosis index (dashed line), and the fluoride concentration of drinking water. A fluorosis index value of 0.6 was judged to represent the threshold for a problem of public health significance. The data are based on the examination of 7,257 12- to 14-yearold children (Dean, 1942).
lier children are exposed to fluoridated water or dietary fluoride supplements, the greater the reduction in dental caries in both the primary and permanent teeth (Hargreaves et al., 1988; Lewis, 1976; Stephen et al., 1987).
A large number of studies have shown that fluoridated drinking water increases resistance to dental caries at all ages. For example, Jackson et al. (1973) recorded caries experience among 3,902 residents of York and Hartlepool, England. The water fluoride concentrations in these cities were 0.2 mg/liter and 1.5 to 2.0 mg/liter, respectively. Caries experience in people in five different age groups (ranging from 15 to 19 to > 44 years) was significantly lower in Hartlepool (44 percent lower in the > 44-year-old group). In a study of Swedish subjects aged 30 to 40 years (n = 496), who were life-long residents of Uppsala (1.0 mg/liter fluoride in water) or Enköping (0.3 mg/liter fluoride in water), Wiktorsson et al. (1992) found that
the percentage of decayed and filled surfaces was 21 percent lower in the fluoridated community. Multiple regression analysis indicated that this difference was due to the community of residence but not to differences in past dental treatment, frequency of toothbrushing with a fluoridated toothpaste, or the frequency of drinking tea.
Bone Mineral Content
Several reports published 30 to 40 years ago suggested that the long-term ingestion of fluoride at levels slightly above optimum for caries prevention improved the quality of the human skeleton and that the risk of osteoporosis might thereby be reduced (Bernstein et al., 1966; Leone et al., 1955, 1960). A recent Finnish study concluded that, compared with the low-fluoride control group, vertebral bone mineral density (BMD) was increased slightly while femoral neck BMD was not affected among perimenopausal women who had used fluoridated water (1.0 to 1.2 mg/liter) for 10 years or more (Kröger et al., 1994). There was no difference between the groups in the prevalence of self-reported bone fractures. Richards et al. (1994) reported that the normal, age-related increase in bone fluoride concentrations (range 463 to 4,000 mg/kg) had no effect on the compressive strength or ash density of vertebra in Danish men and women whose ages ranged from 20 to 91 years. Sowers et al. (1986, 1991), however, reported a marginal increase in bone fractures (self-reported) and lower bone densities among women whose drinking water contained 4 mg/liter of fluoride.
Some evidence exists that fluoride may inhibit the calcification of soft tissues (Taves and Neuman, 1964; Zipkin et al., 1970), including the aorta (Bernstein et al., 1966). Taves (1978) reported that the standardized mortality rate due to ischemic heart disease in cities with optimally fluoridated water was lower than in cities with low water fluoride concentrations. Data are insufficient to justify using these effects as the basis for estimating an AI for fluoride.
Fluoride Balance
As shown in studies with infants (Ekstrand et al., 1984, 1994a, b) and adults (Largent, 1952; Maheshwari et al., 1981), the balance of fluoride can be negative. This occurs when chronic intake is reduced sufficiently to allow plasma fluoride concentrations to fall, which promotes the mobilization of the ion from calcified tissues. However, no data document the effects of a long-term negative fluoride balance on enamel, on salivary or plaque concentrations, or on
caries development. At this time, therefore, the use of balance data to estimate an adequate intake of fluoride is not warranted.
AI Definition
Because data are not available to determine an Estimated Average Requirement (EAR), the reference value that will be used for fluoride is the AI. The AI is based on estimated intakes that have been shown to reduce the occurrence of dental caries maximally in a population without causing unwanted side effects including moderate dental fluorosis.
FINDINGS BY LIFE STAGE AND GENDER GROUP
General Observations
The cariostatic effect associated with residence in communities served with optimally fluoridated water (ca. 1 mg/liter) has been confirmed by numerous epidemiological studies conducted in countries throughout the world (Horowitz, 1996). The average dietary intake by U.S. infants and children since 1980 in these areas has been close to 0.05 mg/kg/day (Table 8-1). The slightly higher average intakes by infants aged 2 to 6 months, reported by Singer and Ophaug (1979) were largely due to intake from formulas that had been manufactured with fluoridated water. Since then, most formula manufacturers in the United States have used low-fluoride water (Burt, 1992). Although the total amount of fluoride ingested daily by older children and adults is greater than by infants or young children, it is generally lower when expressed in terms of body weight. As noted earlier, average dietary fluoride intakes by adults living in fluoridated communities have ranged from 1.4 to 3.4 mg/day, or from 0.02 to 0.05 mg/kg/day for a 70 kg person.
Adequate Intake
Infants: Ages 0 through 6 Months
As noted earlier, fluoride intake among infants varies widely, especially during the first 6 months of life, depending on whether the infant is fed human milk or formula and whether the formula is ready-to-feed or requires reconstitution with water. Human milk-fed infants receive about 0.01 mg/day (0.001 to 0.003 mg/kg). Infants fed a formula reconstituted with fluoridated water may receive as much as 1.0 mg/day. Some evidence shows that the prevalence of
mild enamel fluorosis in the primary teeth, but not the permanent teeth, is higher among formula-fed infants than infants fed cow' s milk, which has a low fluoride concentration similar to that of human milk (Larsen et al., 1988). The current dosage schedule for dietary fluoride supplements in the United States (ADA, 1994) and Canada (Canadian Paediatric Society, 1996) recommends starting supplementation at 6 months of age. Since the intake of fluoride by human milk-fed infants during this period of life does not appear to significantly increase the risk of dental caries, fluoride from human milk is deemed adequate in early life.
|
AI for Infants |
0 through 6 months |
0.01 mg/day |
Ages > 6 Months
Based on the extensively documented relationships between caries experience and both water fluoride concentrations and fluoride intake, the AI for fluoride from all sources is set at 0.05 mg/kg/day. This intake range is recommended for all ages greater than 6 months because it confers a high level of protection against dental caries and is associated with no known unwanted health effects. The cariostatic effect is due both to preeruptive fluoride incorporation into tooth enamel and to continuing, frequent posteruptive fluoride exposures of the teeth. Indicative of the benefit of continuing posteruptive exposures, several studies have shown that caries experience increases among persons who were raised in a fluoridated community but then moved to an area with a lower water fluoride concentration (Russell, 1949), or when a water system is defluoridated (Lemke et al., 1970).
AI Summary: Ages 7 through 12 Months
Based on an AI for fluoride from all sources of 0.05 mg/kg/day and a reference weight of children in this age range of 9 kg (Table 1-3), the AI is 0.5 mg/day.
|
AI for Children |
7 through 12 months |
0.5 mg/day |
AI Summary: Ages 1 through 3 Years
Based on an AI for fluoride from all sources of 0.05 mg/kg/day and a reference weight of children 1 through 3 years of age of 13 kg (Table 1-3), the AI is 0.7 mg/day.
|
AI for Children |
1 through 3 years |
0.7 mg/day |
AI Summary: Ages 4 through 8 Years
Based on an AI for fluoride from all sources of 0.05 mg/kg/day and a reference weight for children 4 through 8 years of age of 22 kg (Table 1-3), the AI is 1.1 mg/day.
|
AI for Children |
4 through 8 years |
1 mg/day |
AI Summary: Ages 9 through 13 Years
Based on an AI for fluoride from all sources of 0.05 mg/kg/day and a reference weight for both boys and girls ages 9 through 13 years of 40 kg (Table 1-3), the AI is 2.0 mg/day.
|
AI for Boys |
9 through 13 years |
2 mg/day |
|
AI for Girls |
9 through 13 years |
2 mg/day |
AI Summary: Ages 14 through 18 Years
Based on an AI for fluoride from all sources of 0.05 mg/kg/day and a reference weight for boys ages 14 through 18 years of 64 kg (Table 1-3), the AI is 3.2 mg/day for boys. Based on a reference weight for girls ages 14 through 18 years of 57 kg, the AI is 2.9 mg/day for girls.
|
AI for Boys |
14 through 18 years |
3 mg/day |
|
AI for Girls |
14 through 18 years |
3 mg/day |
AI Summary: Ages 19 Years and Over
Based on an AI for fluoride from all sources of 0.05 mg/kg/day and a reference weight for males ages 19 and over of 76 kg (Table 1-3), the AI is 3.8 mg/day. Based on a reference weight for females ages 19 and above of 61 kg, the AI for females is 3.1 mg/day.
|
AI for Males |
19 years and over |
4 mg/day |
|
AI for Females |
19 years and over |
3 mg/day |
Pregnancy
It is known that fluoride crosses the placenta, enters the fetal circulation (Brambilla et al., 1994; Shen and Taves, 1974), and is incorporat-
ed into the developing primary teeth (Gedalia et al., 1964; Hargreaves, 1972; LeGeros et al., 1985). Studies conducted shortly after the beginning of water fluoridation indicated that the greatest reduction in caries was seen in children who had the longest exposure to fluoridated water (Arnold et al., 1956; Blayney and Hill, 1964). This raised the possibility of a beneficial effect of prenatal fluoride for the primary teeth. The results of several studies suggested that the ingestion of supplemental fluoride during pregnancy was beneficial to the primary teeth (Feltman and Kosel, 1961; Glenn, 1981; Glenn et al., 1984; Hoskova, 1968; Kailis et al., 1968; Prichard, 1969; Schutzmannsky, 1971). In contrast, other studies have reported no effects or statistically nonsignificant effects of prenatal fluoride administration on caries in the primary dentition (Carlos et al., 1962; Horowitz and Heifetz, 1967; Leverett et al., 1997). The Leverett et al. (1997) study was the first prospective, randomized, double blind study conducted in this area and the authors concluded that “the data do not support the hypothesis that the observed low carie levels are attributable to prenatal fluoride exposure.” At this time, scientific evidence is insufficient to support a recommendation for prenatal fluoride supplementation. This is in line with the current recommendation of the American Dental Association. Further, when fluoride supplements are taken during pregnancy, the United States Food and Drug Administration prohibits making claims of benefit to the teeth of children.
The results from two studies indicated that fluoride balances in pregnant and nonpregnant women were not markedly different (Maheshwari et al., 1981, 1983). In the former study, 16 women aged 19 to 31 years were studied. Ten were in the second half of pregnancy, and six served as nonpregnant controls. The diets had a low fluoride content (less than 0.45 mg/day), which, as in some of the infant studies described above, resulted in negative fluoride balances. The average balances for the pregnant and nonpregnant groups were −0.32 and −0.15 mg/day, respectively. In the second study 18 women aged 19 to 33 years were supplemented with 1.0 mg/day so the average total intake was 1.35 mg/day. Seven of the women were not pregnant, six were in the second quarter of pregnancy, and five were in the fourth quarter of pregnancy. The higher fluoride intake in this study resulted in positive balances in each group. The differences among the groups were small and not statistically significant.
AI Summary: Pregnancy
There is no evidence at this time that the AI for women during
pregnancy should be increased above the level recommended for women during the nonpregnant state.
|
AI for Pregnancy |
14 through 18 years |
3 mg/day |
|
AI for Pregnancy |
19 through 50 years |
3 mg/day |
Lactation
No data from human studies document the metabolism of fluoride during lactation. Because fluoride concentrations in human milk are very low and relatively insensitive to differences in the fluoride concentrations of the mother's drinking water, fluoride supplementation during lactation would not be expected to significantly affect fluoride intake by the nursing infant or the fluoride requirements of the mother. The AI for women during lactation is therefore not increased above that for women in the nonpregnant state.
|
AI for Lactation |
14 through 18 years |
3 mg/day |
|
AI for Lactation |
19 through 50 years |
3 mg/day |
Special Considerations
Fluoride Supplements in Areas without Water Fluoridation. Infants and children living in nonfluoridated water areas will not easily achieve the AI for fluoride. Thus, fluoride supplements have been recommended based on life stage and level of water fluoridation. Table 8-3 shows the recently revised dietary fluoride supplement dosage schedule that was approved for United States children by the American Dental Association and American Academy of Pediatrics (ADA, 1994) and for Canadian children by the Canadian Paediatric Society (1996). The daily fluoride dose is based on the age of the child and the fluoride concentration of the child's main drinking water source. Compared with the previous dosage schedule that was adopted in 1979, the current schedule represents a reduction of approximately 50 percent in the amount of fluoride to be prescribed for children up to the age of 6 years. Other changes from the previous schedule include starting supplementation at 6 months instead of at birth and reducing the water fluoride concentration to a level above which supplements should not be prescribed from 0.7 mg/liter to 0.6 mg/liter. The main reasons for these changes were the increased prevalence of enamel fluorosis in the United States and Canada and the identification of dietary supplements as one of
the risk factors (see below). The decision to delay the start of supplementation until 6 months of age was based on the fact that approximately two-thirds of infants are formula-fed and that many human milk-fed infants receive nourishment from other sources that contain variable amounts of fluoride at an early age.
TOLERABLE UPPER INTAKE LEVELS
Hazard Identification
The primary adverse effects associated with chronic, excess fluoride intake are enamel and skeletal fluorosis.
Adverse Cosmetic Effect: Enamel Fluorosis
Enamel fluorosis is a dose-response effect caused by fluoride ingestion during the preeruptive development of the teeth. After the enamel has completed its preeruptive maturation, it is no longer susceptible. Inasmuch as enamel fluorosis is regarded as a cosmetic effect, it is the anterior teeth that are of most concern. The preeruptive maturation of the crowns of the anterior permanent teeth is finished and the risk of fluorosis is over by 8 years of age (Fejerskov et al., 1977). Therefore, fluoride intake up to the age of 8 years is of most interest. Several reports suggest that enamel in the transitional or early maturation stage of development is most susceptible to fluorosis, which for the anterior teeth, occurs during the second and third years of life (Evans, 1989; Evans and Darvell, 1995; Pendrys and Katz, 1989; Pendrys and Stamm, 1990). Some evidence indicates that the risk of mild enamel fluorosis in the primary teeth is somewhat increased as a result of the relatively high fluoride intake associated with feeding some infant formulas reconstituted with fluoridated water (Larsen et al., 1988).
Fluorosed enamel has a high protein content. This results in increased porosity which, in the moderate and severe forms, may eventually become stained and pitted (Fejerskov et al., 1977; Kaminsky et al., 1990). Clinically, the milder forms of enamel fluorosis are characterized by opaque striations that run horizontally across the surfaces of teeth. The striations may become confluent giving rise to white opaque patches, often most apparent on the incisal edges of anterior teeth or cusp tips of posterior teeth (“snow-capping”). Mild fluorosis has no effect on tooth function and may render the enamel more resistant to caries. It is not readily apparent to the
affected individual or casual observer and often requires a trained specialist to detect. In contrast, the moderate and severe forms of enamel fluorosis are generally characterized by esthetically objectionable changes in tooth color and surface irregularities. Most investigators regard even the more advanced forms of enamel fluorosis as a cosmetic effect rather than a functional adverse effect (Clark et al., 1993; Kaminsky et al., 1990).
Adverse Functional Effect: Skeletal Fluorosis
Three recent reviews of the literature attempted to identify adverse functional effects of fluoride ingestion in adults (Kaminsky et al., 1990; NRC, 1993; USPHS, 1991). Fluoride exposures included those associated with drinking water containing as much as 8 mg/liter of fluoride and the use of dental products. These reviews indicate that the primary functional adverse effect associated with excess fluoride intake is skeletal fluorosis.
In the asymptomatic, preclinical stage of skeletal fluorosis, patients have slight increases in bone mass that are detectable radiographically, bone ash fluoride concentrations that range from 3,500 to 5,500 mg/kg, and bone concentrations that are 2 to 5 times higher than those of life-long residents of optimally fluoridated communities (Eble et al., 1992). Stage 1 skeletal fluorosis is characterized by occasional stiffness or pain in joints and some osteosclerosis of the pelvis and vertebra. Bone ash fluoride concentrations usually range from 6,000 to 7,000 mg/kg. In stages 2 and 3, bone ash concentrations exceed 7,500 to 8,000 mg/kg (Hodge and Smith, 1977). The clinical signs in stages 2 and 3, which may be crippling, may include dose-related calcification of ligaments, osteosclerosis, exostoses, possibly osteoporosis of long bones, muscle wasting, and neurological defects due to hypercalcification of vertebra (Krishnamachari, 1986).
The development of skeletal fluorosis and its severity is directly related to the level and duration of exposure. Most epidemiological research has indicated that an intake of at least 10 mg/day for 10 or more years is needed to produce clinical signs of the milder forms of the condition. Hodge (1979) reported that evidence of crippling fluorosis “was not seen in communities in the United States where water supplies contained up to 20 ppm.” In such communities daily fluoride intakes of 20 mg would not be uncommon. In a recent case report, severe joint pain and stiffness in a 64-year-old man were attributed to a fluoride intake of approximately 50 mg/day for 6 years. The well water ingested had a fluoride concentration of 25 mg/liter and a low calcium concentration (Boyle and Chagnon,
1995). Stevenson and Watson (1957) surveyed 170,000 radiographs of patients from Texas and Oklahoma whose drinking water fluoride concentrations ranged from 4 to 8 mg/liter. They identified 23 cases of osteosclerosis but no evidence of skeletal fluorosis.
Crippling skeletal fluorosis continues to be extremely rare in the United States (only 5 cases have been confirmed during the last 35 years), even though for many generations there have been communities with drinking water fluoride concentrations in excess of those that have resulted in the condition in other countries (Singh and Jolly, 1970). This puzzling geographic distribution has usually been attributed to unidentified metabolic or dietary factors that rendered the skeleton more or less susceptible.
Dose-Response Assessment
Infants and Children Ages 0 through 8 Years
Data Selection. The most appropriate data available for identifying a no-observed-adverse-effect level (NOAEL) (or lowest-observed-adverse-effect level [LOAEL]) are provided by two studies evaluating the severity of enamel fluorosis in children (Dean, 1942; Dean and Elvove, 1937). In these early studies, fluoride intake was almost exclusively from the diet and not confounded by intake from dental products.
Identification of a NOAEL (or LOAEL) and Critical Endpoint. Dental fluorosis has a strong dose-response relationship with fluoride intake. Dean (1942) established that the milder forms of enamel fluorosis affected the permanent teeth of 10 to 12 percent of permanent residents in communities where the drinking water had a fluoride concentration close to 1.0 mg/liter. The fluoride intake of children with developing teeth in these communities averaged 0.05 mg/kg/day and ranged from 0.02 to 0.10 mg/kg/day. In areas where the water contained low concentrations of fluoride (0.3 mg/liter), fewer than 1 percent of the permanent residents had enamel fluorosis. Mild enamel fluorosis affected about 50 percent of residents where the water contained 2.0 mg/liter of fluoride. At this concentration, a few cases (< 5 percent) of moderate fluorosis were recorded (Dean, 1942). Fluoride intake by most children in these communities would have ranged from approximately 0.08 to 0.12 mg/kg/day. An average, chronic daily fluoride intake of 0.10 mg/kg appears to be the threshold beyond which moderate enamel fluorosis appears in some children. Where the water fluoride concentration was 4.0 mg/liter, nearly 90 percent of the residents had
enamel fluorosis, and about one-half of the cases were classified as moderate or severe.
Because the cosmetic effects of the milder forms of enamel fluorosis are not readily apparent, moderate enamel fluorosis was selected as the critical adverse effect for susceptible age groups (infants, toddlers, and children through the age of 8 years). Thus, a fluoride intake of 0.10 mg/kg/day was identified as a LOAEL for moderate enamel fluorosis in children from birth through the age of 8 years, at which age the risk of developing fluorosis of the anterior teeth is over.
Uncertainty Assessment. The relationship between fluoride intake and enamel fluorosis is based on results from human studies and enamel fluorosis is considered a cosmetic effect rather than an adverse functional effect. Therefore, an uncertainty factor (UF) of 1 was selected.
Derivation of the UL. Based on a LOAEL of 0.10 mg/kg/day for moderate enamel fluorosis and a UF of 1, a Tolerable Upper Intake Level (UL) of 0.10 mg/kg/day was established for infants, toddlers, and children through 8 years of age. The extensive epidemiological research conducted in the United States during the 1930s and 1940s (Dean, 1942) established, with a high degree of certainty, that a chronic fluoride intake of less than 0.10 mg/kg/day by children at risk of enamel fluorosis was associated with a low prevalence (for example, approximately 10 percent) of the milder forms of the condition.
Based on a UL of 0.10 mg/kg/day of fluoride and a reference weight for infants ages 0 through 6 months of 7 kg (Table 1-3), the UL is 0.7 mg/day. For children ages 7 through 12 months with a reference weight of 9 kg, the UL is 0.9 mg/day.
|
UL for Infants |
0 through 6 months |
0.7 mg/day |
|
UL for Infants |
7 through 12 months |
0.9 mg/day |
Based on a UL of 0.10 mg/kg/day of fluoride and a reference weight for children ages 1 to 3 years of 13 kg (Table 1-3), the UL is 1.3 mg/day for children ages 1 through 3 years. For children ages 4 through 8 years with a reference weight of 22 kg, the UL is 2.2 mg/day.
|
UL for Children |
1 through 3 years |
1.3 mg/day |
|
UL for Children |
4 through 8 years |
2.2 mg/day |
Older Children and Adults: Ages > 8 Years
Data Selection. Although some recent recommendations have been made for additional research in the areas of intake, dental fluorosis, bone strength, and carcinogenicity, extensive reviews of the scientific literature revealed no adverse effects unless fluoride intakes were greater than 10 mg/day for 10 or more years (Kaminsky et al., 1990; NRC, 1993; USPHS, 1991). At these high, chronic intake levels, the risk of skeletal changes consistent with preclinical or stage 1 skeletal fluorosis increases. Therefore, the data deemed most appropriate for identifying a NOAEL (or LOAEL) for older children and adults are provided by studies on skeletal fluorosis.
Identification of a NOAEL (or LOAEL) and Critical Endpoint. Epidemiological studies reported no detectable radiographic changes in bone density in persons in the United States exposed to drinking water containing less than 4 mg/liter of fluoride (McCauley and McClure, 1954; Schlesinger et al., 1956; Sowers et al., 1986; Stevenson and Watson, 1957). Leone et al. (1955) compared bone x-rays of long-term residents of Bartlett and Cameron, Texas, which had water supplies with fluoride concentrations of 8.0 and 0.4 mg/liter, respectively. In this study, osteosclerosis was detected radiographically in 10 to 15 percent of individuals exposed to water containing 8.0 mg/liter of fluoride for an average of 37 years. However, no clinical symptoms of skeletal fluorosis were reported. Another report dealing with a variety of other medical conditions among residents of Bartlett and Cameron revealed no significant differences except for a slightly higher rate of cardiovascular abnormalities in Cameron residents (Leone et al., 1954). Therefore, based on the available data addressing the association between fluoride intake and skeletal fluorosis in North America, a NOAEL of 10 mg/day of fluoride was identified. This level of intake for some individuals would occur in areas where the drinking water has a fluoride concentration of 5 mg/liter and the diet is the main source of fluoride.
Uncertainty Assessment. Based on the fact that the NOAEL derives from human studies and the lack of evidence for symptomatic skeletal fluorosis observed at this level of fluoride intake, a UF of 1 was selected.
Derivation of the UL. The risk of developing early signs of skeletal fluorosis is associated with a fluoride intake greater than 10 mg/
day for 10 or more years. Therefore, a UL of 10 mg/day was established for children older than 8 years and for adults. Data from studies of fluoride exposure from dietary sources or work environments (Hodge and Smith, 1977) indicate that a UL of 10 mg/day for 10 or more years carries only a small risk for an individual to develop preclinical or stage 1 skeletal fluorosis.
|
UL for Children and Adults |
> 8 years |
10 mg/day |
Pregnancy and Lactation
No data indicate an increased susceptibility to fluorosis during pregnancy. Therefore, the UL for adults of 10 mg/day was also established for pregnant women. A UL of 10 mg/day was established for lactation, because an extremely small proportion of fluoride in drinking water is transferred to the breast milk (Ekstrand et al., 1981, 1984; Esala et al., 1982; Spak et al., 1982).
|
UL for Pregnancy and Lactation |
14 through 50 years |
10 mg/day |
Special Considerations
Reports of relatively marked osteofluorotic signs and symptoms have been associated with concentrations of fluoride in drinking water of approximately 3 mg/liter in tropical climates. This adverse effect has been attributed to poor nutrition, hard manual labor, and high levels of water intake (Krishnamachari, 1986; Singh and Jolly, 1970; WHO, 1984). Therefore, an increased risk of skeletal fluorosis from excess fluoride intake may exist for malnourished individuals living in hot climates or tropical areas.
Exposure Assessment
Prior to the 1960s, the diet, including water, was the only significant source of fluoride. Since then, fluoride ingestion resulting from the use of dental products and fluoride supplements has increased the risk of enamel fluorosis in children. The results of several studies (Kumar et al., 1989; Leverett, 1986; Pendrys and Stamm, 1990; Williams and Zwemer, 1990) have indicated that mild enamel fluorosis in communities with optimally fluoridated water (1.0 mg/liter) is now more than twice as prevalent as in the 1930s and 1940s; that is, the prevalence has increased from an average of about 10
percent to an average approaching 25 percent. In communities where the water has a low fluoride concentration (0.3 mg/liter or less), the prevalence has increased from less than 1 percent to slightly more than 10 percent. These findings reflect levels of fluoride ingestion by some children with developing teeth that are higher than heretofore.
Moreover, a recent national survey (Wagener et al., 1995) found that dietary fluoride supplements were used by 15 percent of children under 2 years of age, 16 percent by those 2 through 4 years of age, and 8 percent by those 5 to 17 years of age. In their study of infants born in Iowa City, a university community with a high socioeconomic status, Levy et al. (1995) reported that from 19 to 25 percent of infants between the ages of 6 weeks and 9 months were given fluoride supplements. Pendrys and Morse (1990) and Levy and Muchow (1992) are among those who have found that supplements are often prescribed at the wrong dosage and in areas where they are not recommended because the water is already fluoridated at recommended levels. Recommendations have been made to reduce fluoride intake from nondietary sources (NRC, 1993; USPHS, 1991; Workshop Reports, 1992).
Risk Characterization
Although the prevalence of enamel fluorosis in both fluoridated and nonfluoridated communities in the United States and Canada is substantially higher than it was when the original epidemiological studies were done some 60 years ago, the severity remains largely limited to the very mild and mild categories. As recorded in the original studies, the prevalence of cases classified as moderate or severe increases with the concentration of fluoride in the drinking water. These relationships are illustrated in Table 8-5, which summarizes data from several U.S. studies done in the 1980s (USPHS, 1991).
These data suggest that the UL (0.1 mg/kg/day) is exceeded by approximately 1 in 100 children in areas where the water fluoride concentration is 1.0 mg/liter or slightly higher. In the 1930s and 1940s, no moderate or severe cases of enamel fluorosis were recorded in these areas, and because fluoride intake from water and the diet appears not to have increased since that time, the additional intake by children at risk of enamel fluorosis almost certainly derives from the use of fluoride-containing dental products.
The virtual absence of evidence of skeletal changes consistent with a diagnosis of skeletal fluorosis indicates that the UL for older children and adults is not being exceeded in the United States or Canada.
TABLE 8-5 Prevalence and Severity of Enamel Fluorosis as a Function of Drinking Water Fluoride Concentration
|
Prevalence of Enamel Fluorosis, %a |
||||
|
No. of Studies |
No. of Subjects |
Drinking Water Fluoride (mg/liter) |
Very Mild/Mild |
Moderate/Severe |
|
4 |
1,885 |
ca. 1.0 |
21.5 (9.0–39.1) |
1.0 (0–2.4) |
|
3 |
526 |
1.3–1.4 |
25.1 (15.6–31.6) |
0.7 (0–1.1) |
|
6 |
1,080 |
2.0–3.0 |
64.5 (39.9–86.5) |
12.6 (3.3–32.8) |
|
4 |
631 |
3.0–4.3 |
53.1 (34.9–72.5) |
21.7 (4.4–36.1) |
|
a Range of the mean values of prevalence from the individual studies is shown in parentheses. SOURCE: USPHS, 1991. |
||||
RESEARCH RECOMMENDATIONS
-
Epidemiological studies (especially analytical studies) of the relationships among fluoride exposures from all major sources and the prevalence of dental caries and enamel fluorosis at specific life stages should continue for the purposes of detecting trends and determining the contribution of each source to the effects demonstrated.
-
Epidemiological and basic laboratory studies should further refine our understanding of the effects of fluoride on the quality and biomechanical properties of bone and on the calcification of soft tissue.
-
Studies are needed to define the effects of metabolic and environmental variables on the absorption, excretion, retention, and biological effects of fluoride. Such variables would include the composition of the diet (for example, calcium content), acid-base balance, and the altitude of residence.


