
7
Bioelectrical Impedance: A History, Research Issues, and Recent Consensus
Wm. Cameron Chumlea and Shumei S. Guo1
A window on the biology of the human body has opened as a result of numerous studies utilizing bioelectrical impedance. The view from this window is affected by the previous and current works of human biologists and biomedical engineers and by the future potential of bioelectrical impedance. This article briefly describes the research history of bioelectrical impedance, the status of present research related to body composition and future research directions. The final section is an abbreviated summary of the 1994 National Institutes of Health (NIH) Technology Assessment Conference on Bioelectrical Impedance Analysis in Body Composition Measurement.
HISTORY
Impedance is the frequency-dependent opposition of a conductor to the flow of an alternating electric current. A measure of impedance (Z) is composed of the sum of two vectors, resistance (R) and reactance (Xc), measured at a particular frequency and is described mathematically by the equation Z2 = R2 + Xc2. Resistance is the opposition of a conductor to the alternating current, and as the electric current travels through the body, resistance is basically the same as in nonbiological conductors (Kay et al., 1954; Nyboer, 1959). Reactance is produced by the additional opposition to the current from the capacitant (storage) effects of cell membranes, tissue interfaces, and structural features (Baker, 1989; Barnett and Bagno, 1936; Schwan and Kay, 1956). The occurrence of these capacitant effects produced by the bilipid cell membrane reaches a peak and then declines as the current changes from low to high frequency. The phase angle (see Figure 7-1), which has been found to be important for describing relationships between bioelectrical impedance and the body and for measuring physiological variables (Baumgartner et al., 1988; Lukaski and Bolonchuk, 1987; Subramanyan et al., 1980), is expressed in degrees as the arctangent of the ratio of Xc/R and changes with changes in the frequency of the current.
Early studies of bioelectrical impedance focused on the meaning of impedance measures in relation to the water and electrolyte content of the body and to physiological variables such as thyroid function, basal metabolic rate, estrogenic activity, and blood flow in human and animal tissues (Barnett, 1937; Lukaski, 1987; Spence et al., 1979). These explorations developed into some of the
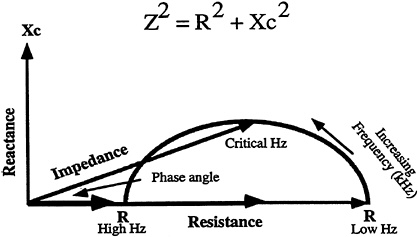
FIGURE 7-1 Impedance plot curve of resistance and reactance with frequency. Z, impedance; R, resistance; Xc, reactance; Hz, hertz; kHz, kilohertz. SOURCE: Chumlea and Baumgartner (1990), used with permission.
present-day areas of impedance cardiography, pulmonary impedance, brain impedance, and impedance imaging. The use of bioelectrical impedance to estimate body composition developed from more recent exploratory works in the areas of single-frequency and multiple-frequency impedance.
Nyboer (1959) and Hoffer et al. (1969) first used single-frequency measures of impedance at 50 kHz to estimate total body water (TBW) based upon a volumetric relationship of impedance and a conductor using the ''impedance index." This volumetric relationship between resistance and a conductor is described by the formula V = ρL2/R from which the "impedance index," body stature (S) squared divided by resistance (R) (or S2/R), is derived (Table 7-1). This volumetric relationship is theoretically dependent upon conductors of uniform shape or of suspensions of cell solutions and upon a uniform current distribution throughout the conductor. However, the geometrical relationship in this formula between the value of resistance and the volume of the body is not adequately explained in its application to human body composition because uniformity is not a characteristic of the human body or of human populations.
The specific resistivity, or ρ, in this volumetric formula (Table 7-1) is an electrical property particular to the conducting medium and independent of its size or shape. For a homogeneous conductor, it is a constant physical property similar to specific gravity. Specific resistivity for the whole body is assumed to be a constant, but each tissue has a characteristic specific resistivity, and the observed specific resistivity for a body segment or the whole body is supposed to be the mean specific resistivity of all conductive tissues (Kay et al., 1954; Schwan and Kay, 1956).
Thomasset (1962) and coworkers (Bolot et al., 1977; Ducrot et al., 1970; Jenin et al., 1975) first used measures of impedance at more than a single frequency to describe the proportion of extracellular water in TBW. These investigators used a ratio of impedance at low and high frequencies to differentiate this extracellular total-body relationship. Multifrequency bioelectrical impedance analyzers measure resistance and reactance at a set of selected frequencies. Ana-
lytical aspects of impedance plots of resistance and reactance (Figure 7-1) relate to physiological characteristics of the body (Boulier et al., 1990; Kanai et al., 1987; Rush et al., 1963). However, these graphic impedance analyses are limited in their ability to estimate body composition if the impedance information cannot be reduced to a few parameters for statistical analysis. With multifrequency bioelectrical impedance, large amounts of data are collected for each individual, and this creates a problem of how to analyze and interpret these data so as to estimate body composition.
These groups of investigators explored the basics of bioelectrical physiology that provide the foundation for much of the present research efforts in body composition with single-and multiple-frequency impedance. However, application of these groups' work was not fully recognized until the development of inexpensive, commercial, bioelectrical impedance body composition analyzers that did not require the expertise of a biomedical engineer. With the advent of the first single-frequency body composition impedance analyzer, and now the newer multifrequency analyzers, there has been a plethora of studies and subsequent reports on the use of impedance to estimate aspects of body composition (Chumlea and Baumgartner, 1990; Chumlea and Guo, 1994). However, these studies of bioelectrical impedance estimates of body composition have, to some extent, drifted from the mainstream of bioengineering impedance research, especially regarding the validity of the machine measurements from the body. The present confusion in using and interpreting single-and multiple-frequency impedance estimates of body composition, in light of its research potential, led NIH to conduct a technology assessment conference in December 1994 (NIH, 1996) to determine current conditions and develop future research goals and directions for bioelectrical impedance.
IMPEDANCE AND BODY WATER
The conduction of an alternating electric current in the body is through its water content or, more correctly, the solution of electrolytes in the body (Hoffer et al., 1969; Kushner and Schoeller, 1986). An alternating current is used for bioelectrical impedance analysis because it penetrates the body at low levels of voltage and amperage. In a complex electrical structure such as the human body, the part of the fluid volume or TBW measured by bioelectrical impedance is also a function of the current frequency. At low frequencies of less than about 5 kHz, the bioelectrical current travels primarily through extracellular fluids, but as the frequency increases, the current starts to penetrate body tissues, creating reactance, and the measure of this current flow starts to represent more of a measure of TBW. At high frequencies (above 100 kHz), the current is assumed to penetrate all conductive body tissues or all of the total body water in the conductor and supposedly overcomes the capacitant properties of the body, reducing reactance to zero. Electrical circuit diagrams (Figure 7-2) have been used
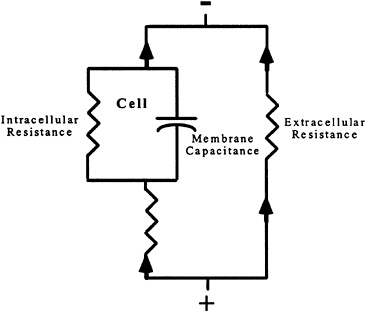
FIGURE 7-2 Intracellular and extracellular electrical circuit diagram.
The ability to quantify TBW and to differentiate it into intra-and extracellular body fluid compartments is important in order to describe fluid shifts and balance and to explore variations in levels of hydration and clinical and nutritional status (Chumlea and Guo, 1994). At present, most bioelectrical impedance analyzers operate at a single frequency of 50 kHz, where the resistance value is primarily for TBW. The quantification of TBW from single-frequency impedance measures has been reasonably accurate. However, the estimation of TBW that results from single-frequency analyzers is limited in its ability to distinguish among individuals the distribution of body water into its intra-and extracellular compartments. This limitation is due in part to the inability of body water estimates from 50 kHz-impedance analyzers to discriminate the relative proportions of extra-and intracellular fluids in the body. Some studies have used reactance at 50 kHz as an additional independent variable to help make this differentiation among individuals, but ratios of bioelectrical impedance measures at low and high frequencies have been more successful in differentiating the proportion of extracellular fluid volume (ECFV) in TBW than have single-frequency impedance and reactance measures (Bolot et al., 1977; Ducrot et al., 1970; Jenin et al., 1975; Thomasset, 1962). The accurate indirect estimation of TBW and ECFV could greatly expand the knowledge of
these fluid spaces in normal and clinical conditions. Little further work in this area has occurred despite reports that the relative proportions of TBW and ECFV determined from multifrequency impedance are reasonably constant with deviations occurring in disease states (Bolot et al., 1977; Jenin et al., 1975). The availability of relatively inexpensive multifrequency body composition impedance analyzers should again spark interest in this significant aspect of body hydration.
IMPEDANCE AND BODY COMPOSITION
To estimate body composition from measures of bioelectrical impedance requires the generation of a mathematical equation that is validated against some criterion method for body composition determination. This is the only way to convert impedance values into estimates of body composition. The use of single-frequency bioelectrical impedance measures in a prediction equation assumes a two-compartment model of body composition, where the total conductive volume of the body is equivalent to TBW and where the hydration of adipose tissue is minimal. Fat-free mass (FFM) is then estimated from single-frequency impedance estimates of TBW based upon the percentage of TBW in FFM. This percentage has a reported mean value of 73 percent, which varies with age, gender, and possibly race and is altered by disease and some physiological conditions (Lohman, 1986; Moore, 1963). Single-frequency impedance estimates of body composition from a two-component model are not accurate for all ages and genders; however, a multicomponent model of body composition using impedance and including measures of bone density has not been developed.
Numerous studies have developed equations that predict body composition from bioelectrical impedance data, but such an impedance estimate will only be as accurate as the criterion method used to determine the dependent variable in the equation. In single-frequency impedance prediction equations, the dependent variable is most frequently derived from densitometry, TBW (as measured by deuterium oxide dilution), and dual-photon absorptiometry (or more recently dual-energy x-ray absorptiometry [DXA or DEXA]). These criterion methods, however, add further assumptions of questionable validity regarding clearance of chemicals and their distribution within the body and levels of hydration and density of the fat-free body. There are assumptions and limitations for almost all body composition methods, old and new, but among the best methods, mean differences of about 2.0 to 3.0 kg are reported for estimates of FFM. This is also true of bioelectrical impedance predictions in comparison with other body composition methods.
The performance of a single-frequency impedance equation with respect to its ability to predict body composition is evaluated by goodness-of-fit measures and measures of accuracy (Guo and Chumlea, 1996). Aspects of goodness of fit generally include the coefficient of determination (R2), the root mean square
error (RMSE), and the coefficient of variation (CV). The accuracy of an equation, when applied to independent samples, is determined by the pure error. Independent cross-validation of impedance prediction equations produces pure errors that are frequently more than twice the RMSE values of the original published equations. In predicting an individual's body composition for a clinical or nutritional assessment, there is a greater statistical uncertainty than there is for a group. The standard error for an individual is several times larger than the standard error of the estimate (for a group) that is provided with statistical program packages. Predictions for an individual have a reduced accuracy and large error bounds, which are exacerbated when an individual differs from the sample used to develop a prediction equation.
The performance of the prediction equation depends also on the selection and the number of independent variables (Guo and Chumlea, 1996). The independent variables used most often are the impedance index (S2/R) from the volumetric equation and weight, followed by stature, arm and thigh circumferences, gender, and age. Arm circumference is an index of the cross-sectional area of muscle tissues and is highly correlated with FFM. Thigh circumference also has been reported as a predictor of FFM, and its inclusion in some equations relates to the amount of muscle tissue in the legs. These circumferences also are related to the geometrical aspects of current and conductor because resistance is inversely proportional to the circumference of the conductor. However, too many independent variables in an equation result in instability and too few result in large RMSE values, causing the equation to perform poorly when applied to independent samples. Independent variables included in an equation can also be interrelated, which causes the regression estimates to be unstable. As a result, a prediction equation may have independent variables that are not statistically significant, and its performance when applied to other samples will be unsatisfactory.
Estimates of body composition derived from single-frequency bioelectrical impedance that have been reported for samples of normal persons have been poor, and single-frequency impedance does not significantly improve estimates of body composition over anthropometry, especially in obese and thin individuals. In the obese and individuals with greater-than-normal amounts of adipose tissue, errors of measurement using whole-body single-frequency impedance and prediction overestimate FFM (Unpublished data, W. C. Chumlea, Wright State University School of Medicine, Dayton, Ohio, 1995). A possible reason for this reduced performance is that specific resistivities vary among body tissues and segments and among individuals because of intra-and interindividual differences in tissue composition and electrolyte concentrations. This variance contributes further to subsequent differences noted among individuals in single-frequency impedance estimates of body composition. Individual and group results also may be influenced by sampling effects, the validation method, and the limitations of V = ρL2/R at a single frequency of 50 kHz.
QUANTIFICATION OF CHANGES IN BODY COMPOSITION
It is important to be able to estimate body composition at any age, but it is equally important that estimates of body composition for the same person at two different ages accurately reflect the change over time. From their analysis of the data from seven studies reporting body composition changes, Forbes and co-workers (1992) have justifiably questioned the basic assumptions of the impedance index (S2/R) in determining the validity of repeated, single-frequency bioelectrical impedance estimates of body composition from the same individuals over time. Part of the problem is the limited sensitivity of the impedance index.
The value of resistance is proportional to the number of ions in a conductor, and a change in the composition that affects the number of ions should be reflected in the value of resistance. However, when the resistance value is used in the geometrical relationship of the index (S2/R) and related to FFM, then changes in body weight or FFM must be sufficient to produce concurrent changes in the volume of conductor before significant changes are detectable in the impedance index. This raises the question as to the quantitative value of a change in body composition in relation to resistance. The relationship between changes in body weight and the proportion of FFM may be different depending upon whether the change is positive or negative. However, a measure of bioelectrical resistance can only account for the fat-free portion (that is, the water) in the change. Therefore, if a change in weight is predominantly fat, or is prolonged over time, it will not be detected by resistance easily until a sufficient change in the FFM (that is, TBW) has occurred. However, a measure of body weight can easily detect a change of 3.0 kg, irrespective of its composition.
The effect of the interrelationship of corresponding changes in volume and composition of the body upon the sensitivity of bioelectrical impedance at a single frequency is unknown. If there is a change in the ionic composition without a concurrent change in the volume of a biological conductor, then the ionic change will not be detected accurately without knowing the change in the value of the specific resistivity. It has not been determined if a measure of resistance in the human body is more sensitive to volume than to composition or of equal sensitivity to both. Accurate measures of changes in body composition are needed. Considering the complex structure and composition of the human body and the fact that the theory and axioms of impedance are based upon constancy of the conductor and a uniform current distribution, it may be asking too much of impedance at a single frequency or any frequency to assess changes in body composition.
SEGMENTAL BIOELECTRICAL IMPEDANCE
Patterson and coworkers (Patterson, 1989; Patterson et al., 1988) have reported that measures of changes in segmental impedance at a single frequency
are more sensitive to changes in body composition than are whole-body impedance measures. This use of a segmental approach to bioelectrical impedance makes use of the work put forth by Settle et al. (1980) who noted that 85 percent of total body impedance was accounted for by the sum of impedance for the arm and the leg. The total conductive volume of the body is derived from impedance indices, measures of the lengths of these body segments, and their single-frequency impedance values. This approach has been used to estimate total and segmental body composition with good results. There is also increased clinical use of segmental impedance in the assessment of diseases that affect body fluid balance (Fuller and Elia, 1989; Scheltinga et al., 1991; Tedner et al., 1985; Ward et al., 1992).
Whole-body impedance, measured from the wrist to the ankle, is less than the sum of impedance values for corresponding body segments by an amount approximately equal to the impedance of the trunk (Baumgartner et al., 1989). This suggests that at 50 kHz, the trunk contributes little to whole-body impedance. Considering the amount of fat on and within the trunk in adults and the relationship of trunkal adipose tissue to cardiovascular disease (CVD) risk factors, further study is needed to clarify this point with multiple-frequency impedance. This is especially important if impedance is to provide improved estimates of or to be used to screen for levels of fatness among those persons at greatest risk of obesity and CVD.
MULTIFREQUENCY BIOELECTRICAL IMPEDANCE
Impedance values measured at a spectrum of frequencies or at several discrete frequencies or some combination of frequencies may help to explain interindividual variations in body composition more precisely than an impedance measurement at a single frequency can. Innovative uses of all data in an impedance spectrum should be considered through multivariate and curve-fitting statistical applications to estimate body composition. When impedance data are collected at multiple frequencies, however, the amount of interpretable information per subject can be large, especially if numerous frequencies are measured. What is the degree of redundancy and multicollinearity among these measurements? Also, at what frequencies should impedance be measured in order to produce the best models of body composition? The most appropriate combination of frequencies and multivariate methods of using multifrequency impedance values in estimating body composition and changes in body composition are just now being explored. Hopefully these studies are of sufficient size so that adequate power is available for inferential interpretation of the results.
Pairs of multiple-frequency impedance values and ratios of low-to high-frequency impedance have been used to explore variations in levels of hydration (Jenin et al., 1975) and to differentiate disease conditions (Thomasset, 1962), and more recently multiple-frequency impedance has been used to estimate
body composition (see Table 7-2). A comparison of these latter body composition studies is presented in Table 7-2. In the study by Segal and coworkers (1991), impedance was measured at 5, 50, and 100 kHz, and each determination used independently with anthropometry to estimate TBW and ECFV in prediction equations. In the study by Van Loan and Mayclin (1992), a spectrum of multifrequency impedance values at 25 frequencies was measured. However, Van Loan and Mayclin (1992) did not attempt to model the spectrum of frequencies but simply used regression analysis to select a single impedance value at 224 kHz to use in a prediction equation; Deurenberg and Schouten (1992) did the same. Only very recently have measures of impedance at four separate frequencies been used to predict body composition (Deurenberg et al., 1995; van Marken Lichtenbelt et al., 1994) (Table 7-2). However, these four measures were used separately as independent variables in prediction equations. In addition, none of the samples listed in Table 7-2 included minority subjects. There also have been reports of the use of multifrequency impedance in France
TABLE 7-2 Comparison of Frequencies Used with Frequencies Measured, in Published Studies of Multifrequency Bioelectrical Impedance
|
Reference |
Frequencies Measured (kHz) |
N |
Frequencies Used in Models |
|
Segal et al., 1991 |
5, 50, 100 |
36 |
Only a single frequency used with stature and weight |
|
Van Loan and Mayclin, 1992 |
1, 2, 3, 4, 5, 6, 8, 10, 15, 20, 27, 37, 50, 64, 90, 100, 122, 167, 224, 300, 400, 548, 740, 1000, 1348 |
60 |
Only a single frequency used with stature, weight, and gender |
|
Deurenberg and Schouten, 1992 |
1, 5, 10, 15, 20, 25, 50, 75, 100, 250, 750, 1000, 1250, 1350 |
12 |
Only a single frequency used with stature |
|
Hannan et al., 1994 |
5, 50, 100, 500, 1000 |
43 |
One or two frequencies used with stature and weight |
|
Sergi et al., 1994 |
1, 50 |
40 |
Only a single frequency used with stature, weight, gender, and health status |
|
van Marken Lichtenbelt et al., 1994 |
1, 50, 100, 400 |
29 |
Four frequencies used with stature, gender, age, and body mass index |
|
Visser et al., 1995 |
1, 5, 50, 100, 250, 500, 1000, 1350 |
117 |
Only a single frequency used with stature, weight, gender, and age |
|
Deurenberg et al., 1995 |
0, 1, 5, 50, 100, 250, 500 |
48 |
Four frequencies used with stature and weight |
(Boulier et al., 1990), but these investigators used a two-electrode (needle electrode) method rather than the tetrapolar electrode method used in the United States. Thus, published studies reporting the use or "model" of multifrequency impedance have been limited in terms of sample size, minority representation, and analytical methods.
From these published studies using multifrequency impedance (Table 7-2), there is little new in the analyses used from what has been reported with single-frequency 50-kHz impedance. Most models have simply used a single impedance value measured at some frequency with anthropometry in a prediction equation, and the performance of these equations is similar to that of 50-kHz impedance prediction equations. There has been little or no analytical consideration or modeling of the representative nature of the spectrum of multifrequency impedance and its relation to body composition. All of the published uses of multifrequency bioelectrical impedance have related whole-body impedance measures to total-body composition. None of the published multifrequency models are applicable to ethnic or minority groups.
Multifrequency Bioelectrical Impedance Spectral Analysis
The multifrequency bioelectrical impedance spectrum can be modeled through multivariate and curve-fitting statistical applications to develop summary parameters to estimate body composition. These models and their statistical applications appear to expand the use of the multifrequency bioelectrical impedance spectrum to quantify body fatness among individuals in clinical, epidemiological, and nutritional settings.
In a feasibility study conducted in this laboratory, the validity of multiple-frequency impedance spectra measured across 16 frequencies to estimate body composition measured by DXA was tested using a small sample of young adult, normal-weight, Caucasian men and women (Chumlea et al., 1996). The spectra of total body and segmental multifrequency impedance values plotted against frequency for each individual follow a similar set of curves as demonstrated in Figure 7-3. The general shape of these curves is described by the same mathematical function containing three components that allow for asymptotes as the frequency approaches zero and as the frequency increases. The function that best describes the shapes of the impedance spectrum for the ith individual is shown in Figure 7-3 where fik(xj) is the impedance value (total body, arm, leg, or trunk) for the ith individual measured at the jth frequency for the kth measure, where xj is the jth frequency; aik, bik, and cik are the parameters for the kth impedance measure (total body, arm, leg, or trunk) of the ith individual; and eijk is an error term assumed to be normally distributed with a mean of zero and variance of s2. The parameter ai is the asymptote, bi is the slope of the curve, and ci is the acceleration or change in bi with frequency for the ith individual. For an individ-
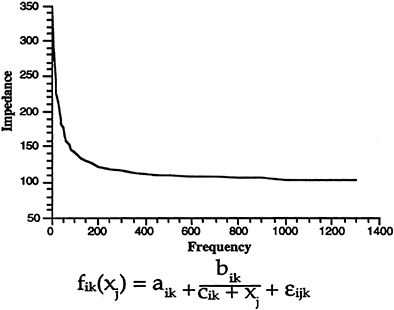
FIGURE 7-3 Spectrum curve and formula of impedance (expressed in ohms) against frequency (expressed in Hertz); fik(xj), impedance value; aik, asymptote; bik, slope; cik, acceleration; eik, error. SOURCE: Adapted from Chumlea and Guo (1994).
ual, the parameters, ai, bi, and ci, contain information derived from the individual measurements of impedance, summarized across the spectrum of current frequencies.
Models of these impedance spectrum parameters demonstrated gender and anatomical differences in their relation to the variance in body composition values. In regression models of the total body parameters ai, bi, and ci, on total body FFM, the R2 values were higher in the men than in the women. In the regression models of segmental parameters on total-body FFM, the R2 values were higher in the arms and legs of the men than in the women where the significant gender difference in muscle mass exists. Regression models of the total-body and segmental impedance spectrum parameters on total body fat (TBF) or percentage body fat (%BF) also demonstrate gender differences in body fatness and possible association with fat patterning in the variance associations. The total-body impedance spectrum parameters for TBF and %BF had higher R2 values in the women than in the men. This pattern continued in the segmental analyses that corresponds to greater amounts of subcutaneous adipose tissue on the limbs in women than in men. However, the impedance spectrum parameters for the male trunk had higher R 2 values for TBF and %BF than occurred for the limbs, conforming to the pattern of greater adiposity on the trunk than the limbs in men.
The patterns of these R2 values appear to demonstrate possible differences in fat patterning between men and women, in that a greater variance for amounts
of adipose tissue on the trunk than the limbs occurs in the women than the men. Ratios of low-to high-frequency impedance measures of the trunk also were correlated significantly and negatively with levels of TBF and total body %BF (r = -0.7 to -0.9). These correlations with body fatness remained significant even after removing the effects of waist circumference or the waist/hip circumference ratio. Different placements of electrodes on the trunk might discriminate the location of trunkal adipose tissue more clearly between men and women, but it is doubtful that multifrequency impedance can discriminate levels of internal adipose tissue.
IMPEDANCE AND BLOOD CHEMISTRY
There are few if any significant associations reported among physiological variables and bioelectrical impedance, and possible associations of bioelectrical impedance to blood chemistry and electrolytes generally have not been considered in detail (Azcue et al., 1993; Cha et al., 1994a, b; Shirreffs and Maughan, 1994; Shirreffs et al., 1994). Factors that affect body fluid or electrical activity potentially affect measures of impedance. Total-body and segmental measures of multifrequency impedance were significantly correlated with blood chemistry variables, which included hemoglobin, hematocrit, serum sodium and potassium, serum creatinine, and serum osmolality (Chumlea et al., 1996). The values of the significant correlation coefficients (p < 0.05) ranged from 0.4 to 0.7. These correlations represent an association of multifrequency impedance with the physiological status of the body. Several of the blood variables represent electrolytes or ion levels in the body. Impedance measures the electrical conductivity of the body, so correlations with these types of variables is expected. The effect of interrelationships among blood chemistry values on the variance in impedance measures and subsequent estimates of body composition needs further study. Understanding the relationship of impedance and blood chemistry values might help improve estimates of body composition. Increased knowledge is needed about the relationship of multifrequency impedance measures to physiological factors, especially related to electrolytes or possibly viscosity in large normal and clinical samples.
ETHNICITY
Body composition studies of non-Caucasian ethnic groups have never equaled the application to samples from Caucasians. Studies of bioelectrical impedance in non-Caucasian samples are needed and should be cross-validated to help ensure their generalizability to other samples. There have been a limited number of reports on the use of single-frequency impedance with Native-American and African-American samples (Rising et al., 1991; Sparling et al., 1993; Stolarczyk et al., 1994; Zillikens and Conway, 1991). It is unknown
whether there are published studies of bioelectrical impedance with Hispanic-or Asian-American groups. Because of the specificity of these ethnic samples, the results have been anecdotal or of limited application to other corresponding samples in the United States. Studies of impedance and body composition in non-Caucasian and mixed ethnic samples are seriously warranted.
NIH TECHNOLOGY ASSESSMENT CONFERENCE: BIOELECTRICAL IMPEDANCE ANALYSIS IN BODY COMPOSITION MEASUREMENT
Recently, Dr. Van Hubbard, Nutrition Sciences Branch, National Institute of Diabetes and Digestive and Kidney Diseases, and Dr. Elsa Bray, Office of Medical Applications of Research, NIH, conducted a technology assessment conference of bioelectrical impedance chaired by Dr. John Rombeau. This conference consisted of a panel of impartial scientists who listened to a series of expert presentations covering the area of bioelectrical impedance. The following is an abbreviated summary of the panel's comments from the final report (NIH, 1996). This 1994 conference assessed the present state of knowledge and technological development in the area of bioelectrical impedance so that some of what follows is redundant with what has already been presented. The conference addressed the five questions listed in Table 7-3.
What does bioelectrical impedance measure in terms of electrical and biological parameters?
Precise bioelectrical impedance measures of electrical and biological parameters are unknown and vary from person to person. The actual parameter measured with bioelectrical impedance is voltage produced between two meas-
TABLE 7-3 NIH Technology Assessment Conference Questions
|
1. |
What does bioelectrical impedance measure in terms of electrical and biological parameters, and how safe is it? |
|
2. |
How should bioelectrical impedance be performed, and how can BIA measurements be standardized? |
|
3. |
How valid is the bioelectrical impedance technology in the estimation of total body water, fat-free mass, and adiposity? |
|
4. |
What are the appropriate clinical uses of bioelectrical impedance technology, and what are the limitations? |
|
5. |
What are the future directions for basic science, clinical research, and epidemiological evaluation of body composition measurements? |
uring electrodes. The current magnitude is small and not perceived by the subject, but it is large enough that the current produces voltages that are above the interfering electrical ''noise" of the body. However, other detectable electrical "noise" may arise from myoelectric sources, such as muscles, or possibly from outside electromagnetic interference from such sources as heaters and radio transmissions.
The voltage or impedance measurement does not provide any direct information as to how much current travels through intracellular versus extracellular volumes, in blood versus muscle, or in fat versus fat-free tissues. Current paths in the body used by impedance will generally differ from person to person because of differences in body size, shape, electrolytes, fluid distribution, or other aspects of the body's composition. These characteristics vary within an individual, and almost any change in body size, shape, or composition will have at least a small effect on impedance. Relationships between impedance and other variables such as TBW, FFM, or body fat have been established as statistical associations with impedance for a particular population rather than on a biophysical basis. These relationships are not absolute because the current diffuses throughout the conducting volume and makes use of any and all conductive paths that are available at the time of measurement.
The assumptions underlying bioelectrical impedance, those of uniform cross-sectional and homogeneous conductivity, are not fulfilled in humans. No values for specific resistivity are identified or used in work with human subjects. Instead, an analogous statistical parameter (Ht2/R), where height (Ht) replaces length, is used as an independent variable in a statistical regression procedure, and its degree of association with the output of interest, such as TBW, is evaluated. As used with humans, the bioelectrical impedance measurement does not directly measure any biological quantity of interest, such as fat, on the basis of a physical or biophysical model. Resistance is used as one element of a statistical evaluation, where it may or may not be found to be significant as related to a particular output variable in a particular population.
The bioelectrical impedance equations describe statistical relationships found for a particular population and are not derived from biophysical reasoning, and the measurement is affected by numerous variables. Such populations are chosen to be similar in many attributes so that the bioelectrical impedance result can then be correlated with the remaining attributes that are allowed to vary. Consequently, each equation is useful only for subjects that are a close match to the reference population used in the original derivation of the equation.
How safe is it?
Bioelectrical impedance is considered safe because: the current frequency of 50 kHz is unlikely to stimulate electrically excitable tissues, there is an absence of reports of untoward events induced by bioelectrical impedance after thousands of trials, the relatively small current magnitudes are below the
threshold of perception, and batteries or low-voltage power sources are used. However, there are no formal safety standards for bioelectrical impedance instruments. In fact, the introduced current is larger in magnitude than leakage currents allowed for some medical devices, such as electrocardiograph machines. A systematic assessment of all safety-related issues is needed.
How should bioelectrical impedance be performed, and how can bioelectrical impedance measurements be standardized?
Standardization of procedures is essential. Proper electrode placement is crucial for accurate and reproducible bioelectrical impedance measurements. More information is needed to determine whether additional electrode placement sites offer improvement over present examination techniques.
Other variables that affect the validity, reproducibility, and precision of the measurements include body position, hydration status, consumption of food or beverages, ambient air and skin temperature, recent physical activity, and conductance of the examination table. Additionally, the accuracy of the determination of other measures that are used in the equations to predict TBW or fatness with bioelectrical impedance affects the accuracy of the estimate.
Measurements are made with the subject reclining, but evidence indicates that impedance values change sharply within the first 10 minutes after the subject assumes a supine position and continue to do so for several hours. Standardization of procedures should include the length of time the subject is recumbent before the measurement is performed. Measurements obtained several hours postprandially may also influence impedance values, depending on the volume change. This can be controlled by obtaining bioelectrical impedance measurements after a fast of at least 4 hours.
Different manufacturers of bioimpedance machines use various equations to convert the raw data of impedance to estimates of body composition. There has been difficulty in obtaining the actual equations in the software of the machines and the data upon which these equations were derived. The availability of this information would allow more application of bioelectrical impedance in research and clinical settings.
All instruments should report the directly measured resistance and reactance values. Computational algorithms and the characteristics of the validation population used to convert the fundamental electrical parameters to the instrument-reported biological ones should be provided with the instrument. In all cases, reported biological values should include an assessment of the precision of the individual (not the population) estimate based on propagated instrumental and measurement errors and on the statistical error limits of the computational algorithm.
How valid is the bioelectrical impedance technology in the estimation of body composition?
The common assumption that the current penetrates cell membranes and freely passes through all fluids is known to be false. The current is carried by extracellular fluid plus some component of intracellular fluid. The human body poorly approximates a cylinder, and the bioelectrical impedance measurement is disproportionately sensitive to limb versus trunk water content. The correlation between bioelectrical impedance resistance measurements and isotopic dilution TBW differs slightly in conditions where there are disturbances in extracellular versus intracellular water or limb versus trunk water distribution.
The ability to predict fatness from bioelectrical impedance in severely obese subjects (BMI > 32) should be interpreted with caution. The obese have a greater proportion of body mass and body water accounted for by the trunk in relation to the extremities than do leaner subjects. The trunk does, however, contribute a relatively minor amount to total body impedance, resulting in the overestimation of body fat from standard equations. The hydration of FFM is greater in the obese, and the ratio of extracellular to intracellular water is increased in the obese, resulting in the underestimation of body fat from standard predictive equations.
Additional research that links bioelectrical impedance measurements to the underlying physiological and biophysical structure will help to place bioelectrical impedance technology on a much stronger scientific basis. A major need in clinical research is the establishment of reference norms to improve data interpretation. There is little information on how trunkal obesity affects impedance measurements.
Additional studies are also needed for population-specific equations to predict adiposity in the elderly, the very lean, and the obese as well as to determine racial or ethnic predictions. These studies should include multifrequency impedance measurements and multicomponent criterion methods accounting for TBW and total body mineral as well as body density and should include statistically accepted cross-validation methods. Other clinical variables might be used to improve estimates of TBW if valid prediction equations are developed for specific demographic subgroups. Additional validation studies are needed using multicompartment models to test how well bioelectrical impedance-derived estimates of TBW predict body mass and adiposity.
What are the appropriate clinical uses of bioelectrical impedance technology, and what are the limitations?
The relationship between impedance and TBW is of necessity empirical. This constrains the derived value of TBW in that it must be altered in the torso and extremities in a fixed relationship in health and disease in order to retain predictive value. This relationship occurs in most normal subjects, as well as
those with any one of a number of mild disease states or chronic illnesses that do not produce local fluid accumulation. It appears to be of value to assess nutritional status in early HIV infection. However, in conditions where water distribution is disturbed, such as during critical illness, the assumptions of body impedance analysis and TBW are invalid.
In the hospital setting, particularly among the critically ill, the role of bioelectrical impedance has not been clearly defined. Disturbances of intracellular water are known to be characteristic of protein calorie malnutrition, and direct or indirect measures of TBW do not reliably reflect FFM. This likely invalidates bioelectrical impedance as an assessment of the response to parenteral and enteral nutrition in such patients, at least in terms of changes in FFM that reflect protein accretion. There are clinical conditions for which knowledge of TBW may be helpful in monitoring the critically ill, but the role of bioelectrical impedance in this assessment remains to be defined.
Bioelectrical impedance does not appear to be useful to assess acute weight changes due to dieting in the obese. Neither acute changes in weight by infusion nor acute loss by the development of protein calorie malnutrition appear to be reliably detected by bioelectrical impedance. More gradual nutritional repletion may be accurately assessed by bioelectrical impedance in malnourished patients who are not critically ill.
For patients undergoing hemodialysis, bioelectrical impedance is useful in the prescription and monitoring of the adequacy of dialysis. Where urea kinetic modeling has become the common standard, bioelectrical impedance can provide the accurate assessment of TBW as this model requires. Bioelectrical impedance also can be of value in assessing volume status in the dialysis patient and may serve to improve interpretation of drug pharmacokinetics.
The third National Health and Nutrition Examination Survey (NHANES III) single-frequency bioelectrical impedance data may be useful for examining the relationship between body composition estimates from this technique and clinical risk factors such as blood pressure, blood lipids, and glucose intolerance. This could help determine whether bioelectrical impedance provides additional information on disease risks compared with other techniques of body composition assessment. The availability of the longitudinal follow-up of the NHANES III cohort would provide valuable information relating body composition data derived from bioelectrical impedance with clinical outcome.
AUTHORS' CONCLUSION
Bioelectrical impedance has an interesting history, and much research is currently underway for single-and multiple-frequency measures. The application of single-and multiple-frequency impedance to body composition is not proven yet. The recent NIH Technology Assessment Conference highlighted several areas where additional research is needed and indicated some of the directions this research should take. Persons interested in developing and explor-
ing bioelectrical impedance and its technology are directed to the full report of the NIH Technology Assessment Conference (NIH, 1996).
ACKNOWLEDGMENTS
The assistance of Lisë Hall, Jean Payne, Leona Miller, Merita Moffitt, and Xiaoyin Wu is gratefully acknowledged.
REFERENCES
Azcue, M., D. Wesson, M. Neuman, and P. Pencharz 1993 What does bioelectrical impedance spectroscopy (BIS) measure? Basic Life Sci. 60:121–123.
Baker, L.E. 1989 Principles of the impedance technique. IEEE Eng. Med. Biol. Mag. 3:11–15.
Barnett, A. 1937 The basic factors in proposed electrical methods for measuring thyroid function, III. The phase angle and the impedance of the skin. West. J. Surg. Obstet. Gynecol. 45:540–554.
Barnett, A., and S. Bagno 1936 The physiological mechanisms involved in the clinical measure of phase angle. Am. J. Physiol. 114:366–382.
Baumgartner, R.N., W.C. Chumlea, and A.F. Roche 1988 Bioelectric impedance phase angle and body composition. Am. J. Clin. Nutr. 48:16–23.
1989 Estimation of body composition from bioelectric impedance of body segments. Am. J. Clin. Nutr. 50:221–226.
Bolot, J-F., G. Fourier, A. Bertoye, J. Lenior, P. Jenin, and A. Thomasset 1977 Determination of lean body mass by the electrical impedance measure. Presse Med. 6:2249–2251.
Boulier, A., J. Fricker, A.L. Thomasset, and M. Apfelbaum 1990 Fat-free mass estimation by the two electrode impedance method. Am. J. Clin. Nutr. 52:581–585.
Cha, K., E.F. Brown, and D.W. Wilmore 1994a A new bioelectrical impedance method for measurement of the erythrocyte sedimentation rate. Physiol. Meas. 15:499–508.
Cha, K., R.G. Faris, E.F. Brown, and D.W. Wilmore 1994b An electronic method for rapid measurement of haematocrit in blood samples. Physiol. Meas. 15:129–137.
Chumlea, W.C., and R.N. Baumgartner 1990 Bioelectrical impedance methods for the estimation of body composition. Can. J. Sport Sci. 15(3):172–179.
Chumlea, W.C., and S.S. Guo 1994 Bioelectrical impedance: Present status and future directions. Nutr. Rev. 52:123–131.
Chumlea, W.C., S.S. Guo, D.B. Cockram, and R.M. Siervogel 1996 Mechanical and physiologic modifiers and bioelectrical impedance spectrum determinants of body composition . Am. J. Clin. Nutr. 64(suppl.):413S–422S.
Deurenberg, P., and F.J.M. Schouten 1992 Loss of total body water and extracellular water assessed by multifrequency impedance. Eur. J. Clin. Nutr. 46:247–255.
Deurenberg, P., E. Van Malkenhorst, and T. Schoen 1995 Distal versus proximal electrode placement in the prediction of total body water and extracellular water from multifrequency bioelectrical impedance. Am. J. Hum. Biol. 7:77–83.
Ducrot, H., A. Thomasset, R. Jolz, P. Jungers, C. Eyraud, and J. Lenior 1970 Determination of extracellular fluid volume in man by measurement of whole body impedance. Presse Med. 51:2269–2272.
Forbes, G.B., W. Simon, and J.M. Amatruda 1992 Is bioimpedance a good predictor of body composition change? Am. J. Clin. Nutr. 56:4–6.
Fuller, N.J., and M. Elia 1989 Potential use of bioelectrical impedance of the "whole body" and of body segments for the assessment of body composition: Comparison with densitometry and anthropometry. Eur. J. Clin. Nutr. 43:779–791.
Guo, S.S., and W.C. Chumlea 1996 Statistical methods for the development and testing of predictive equations. Pp. 191–202 in Human Body Composition: Methods and Findings, A.F. Roche, S.B. Heymsfield, and T.G. Lohman, eds. Champaign, Ill.: Human Kinetics Press.
Hannan, W.J., S.J. Cowen, K.C.H. Fearon, C.E. Plester, and J.S. Falconer 1994 Evaluation of multi-frequency bioimpedance analysis for the assessment of extracellular and total body water in surgical patients. Clin. Sci. 86:479–485.
Hoffer, E.C., C.K. Meador, and D.C. Simpson 1969 Correlation of whole-body impedance with total body water volume. J. Appl. Physiol. 27:531–534.
Jenin, P., J. Lenoir, C. Roullet, A. Thomasset, and H. Ducrot 1975 Determination of body fluid compartments by electrical impedance measurements. Aviat. Space Environ. Med. 46:152–155.
Kay C.F., P.T. Bothwell, and E.L. Foltz 1954 Electrical resistivity of living body tissues at low frequencies. J. Physiol. 13:131–136.
Kanai, H., M. Haeno, and K. Sakamoto 1987 Electrical measurement of fluid distribution in legs and arms. Med. Prog. Technol. 12:159–170.
Kushner, R.F., and D.A. Schoeller 1986 Estimation of total body water by bioelectrical impedance analysis. Am. J. Clin. Nutr. 44:417–424.
Lohman, T.G. 1986 Applicability of body composition techniques and constants for children and youths. Exerc. Sports Sci. Rev. 14:325–357.
Lukaski, H.C. 1987 Methods for the assessment of human body composition: Traditional and new. Am. J. Clin. Nutr. 46:537–556.
Lukaski, H.C., and W.W. Bolonchuk 1987 Theory and validation of the tetrapolar bioelectrical impedance method to assess human body composition. Pp. 49–60 in In Vivo Body Composition Studies, K.J. Ellis, S. Yasumura, and W.D. Morgan, eds. London: The Institute of Physical Sciences in Medicine.
Moore, F.D. 1963 The Body Cell Mass and Its Supporting Environment. London: W.B. Saunders.
NIH (National Institutes of Health) 1996 Technology Assessment Statement on Bioelectrical Impedance Analysis in Body Composition Measurement, 1994 December 12–14. Am. J. Clin. Nutr. 64 (suppl.):524S–532S.
Nyboer, J. 1959 Electrical Impedance Plethysmography. Springfield, Ill.: Charles C Thomas.
Patterson, R. 1989 Body fluid determinations using multiple impedance measurements. IEEE Eng. Med. Biol. Mag. 3:16–18.
Patterson, R., C. Ranganathan, R. Engel, and R. Berkseth 1988 Measurement of body fluid volume change using multisite impedance measurements. Med. Biol. Eng. Comput. 26:33–37.
Rising, R., B. Swinburn, K. Larson, and E. Ravussin 1991 Body composition in Pima Indians—validation of bioelectrical resistance. Am. J. Clin. Nutr. 53:594–598.
Rush, S., J.A. Abildskov, and R. McFee 1963 Resistivity of body tissues at low frequencies. Circ. Res. 12:40–50.
Scheltinga, M.R., D.O. Jacobs, T.D. Kimbrough, and D.W. Wilmore 1991 Alterations in body fluid content can be detected by bioelectrical impedance analysis. J. Surg. Res. 50:461–468.
Schwan, H.P., and C.F. Kay 1956 The conductivity of living tissues. Ann. N.Y. Acad. Sci. 65:1007–1013.
Segal, K.R., S. Burastero, A. Chun, P. Coronel, R.N. Pierson, and J. Wang 1991 Estimation of extracellular and total body water by multiple-frequency bioelectrical-impedance measurement. Am. J. Clin. Nutr. 54:26–29.
Sergi, G., M. Bussolotto, P. Perini, I. Calliari, V. Giantin, A. Ceccon, F. Scanferla, M. Bressan, G. Moschini, and G. Enzi 1994 Accuracy of bioelectrical impedance analysis in estimation of extracellular space in healthy subjects and in fluid retention states. Ann. Nutr. Metab. 38:158–165.
Settle, R.G., K.R. Foster, B.R. Epstein, and J.L. Mullen 1980 Nutritional assessment: Whole body impedance and body fluid compartments. Nutr. Cancer 2:72–80.
Shirreffs, S.M., and R.J. Maughan 1994 The effect of posture change on blood volume, serum potassium and whole body electrical impedance. Eur. J. Appl. Physiol. 69:461–463.
Shirreffs, S.M., R.J. Maughan, and M. Bernardi 1994 Effect of posture change on blood volume, serum potassium and body water as estimated by bioelectrical impedance analysis (BIA). Clin. Sci. (London) 87:21.
Sparling, P.B., M. Millard-Stafford, L.B. Rosskopf, L.J. Dicarlo, and B.T. Hinson 1993 Body composition by bioelectric impedance and densitometry in Black women. Am. J. Hum. Biol. 5:111–117.
Spence, J.A., R. Baliga, and J. Nyboer 1979 Changes during hemodialysis in total body water cardiac output and chest fluid as detected by bioelectric impedance analysis. Trans. Am. Soc. Artif. Intern. Organs 25:51–55.
Stolarczyk, L.M., V.H. Heyward, V.L. Hicks, and R.N. Baumgartner 1994 Predictive accuracy of bioelectrical impedance in estimating body composition of Native American women. Am. J. Clin. Nutr. 59:964–970.
Subramanyan, R., S.C. Manchanda, J. Nyboer, and M.L. Bhatia 1980 Total body water in congestive heart failure. A pre-and post-treatment study. J. Assoc. Physicians India 28:257–262.
Tedner, B., L.E. Lins, H. Asaba, and B. Wehle 1985 Evaluation of impedance technique for fluid-volume monitoring during hemodialysis. Int. J. Clin. Monit. Comp. 2:3–8.
Thomasset, A. 1962 Bio-electrical properties of tissue impedance measurements. Lyon Med. 207:107–118.
Van Loan, M.D., and P.L. Mayclin 1992 Use of multi-frequency bioelectrical impedance analysis for the estimation of extracellular fluid. Eur. J. Clin. Nutr. 46:117–124.
van Marken Lichtenbelt, W.D., K.R. Westerterp, L. Wouters, and S.C. Luijendijk 1994 Validation of bioelectrical-impedance measurements as a method to estimate body-water compartments. Am. J. Clin. 60:159–166.
Visser, M., P. Deurenberg, and W.A. Van Staveren 1995 Multi-frequency bioelectrical impedance for assessing total body water and extracellular water in the elderly. Eur. J. Clin. Nutr. 49:256–266.
Ward, L.C., I.H. Bunce, B.H. Cornish, B.R. Mirolo, B.J. Thomas, and L.C. Jones 1992 Multi-frequency bioelectrical impedance augments the diagnosis and management of lymphoedema in post-mastectomy patients. Eur. J. Clin. Invest. 22:751–754.
Zillikens, M.C., and J.M. Conway 1991 Estimation of total body water by bioelectrical impedance analysis in Blacks. Am. J. Hum. Biol. 3:25–32.
DISCUSSION
JOHANNA DWYER: In renal disease, in renal dialysis patients, you are measuring dry weight. Do you believe that you can really get reliable estimates of lean body mass and fat, as well as total body mass, using dual frequency?
WM. CAMERON CHUMLEA: I would seriously doubt that [you could get reliable estimates] with a commercial machine like the RJL or the Zytron. Much of the early work that was done with the renal patients was by a man named Tadnor, who I believe was in Scandinavia. He used multifrequency machines there and built his own machines. That work is at least 5 years old, if not older.
There have been some reports in the literature using the more recent commercial machines, and I do not think that those results have been outstanding. They tend to be too subject to error.
DOUGLAS WILMORE: I enjoyed your presentation. One of the things that you were directed to talk about was composition, but one of the things that you did not talk about was phase angle and the value that phase angle may have in assessing physiological function of individuals and determining whether they should go ahead and perform a task or not.
For example, in looking at a very, very large group of HIV patients in Europe, phase angle has been found to be the single best predictor of outcome in that population, more so than CD4 count, weight loss, serum albumin, food in-
take, and a whole variety of things, basically because phase angle is probably assessing either a membrane function or a partitioning of intracellular or extracellular water.
When you look at performance of the troops, for example, and you start to predict which people should go ahead with a task and which should not, this methodology, if somewhat refined, may really be very appropriate for that. I wonder if you would comment on that.
WM. CAMERON CHUMLEA: That is correct. Just for the information of the audience, phase angle is the ratio of reactance to resistance, and the arctangent is then taken to convert it into degrees, so it is the low angle that this vector traces as it goes around the semicircle [see Figure 7-1]. That is phase angle.
I agree with you. What I did not have a chance to report is that we have correlations of phase angle with blood chemistry values and we find that phase angle is correlated with hematocrit, serum sodium, and osmolality, so it has some potential there, and it does not surprise me that the Europeans have found this also.
I think it is a variable that is poorly related to body composition in the prediction-equation type of relationships, although some people have included it on occasion. It is a variable that may be sensitive to the physiological status of an individual. I am not surprised at that because it would appear that it does have that sensitivity.
As I said, we found correlations between phase angle and blood chemistry values. Those have only been considered anecdotally almost, in relationship to body composition. It is possible that it could be used in terms of body composition to explain some part of the variance that is included in the measurement, but it is more sensitive, I think. I agree with you.
DENNIS BIER: So this would be an in-field use?
WM. CAMERON CHUMLEA: It could be.
DENNIS BIER: Whereas blood chemistries would be more complex?
WM. CAMERON CHUMLEA: That is right. You could have a distribution of phase angles that would relate to sodium levels or something like that that could be important.
LYLE MOLDAWER: Are you implying that these phase angles or membrane potentials are indirect estimates of, say, skeletal muscle?
WM. CAMERON CHUMLEA: Well, the reactance is supposedly produced by some aspect of the membrane acting as a capacitor. Again, the theory is that the current eventually exceeds some magic number there, and it basically overpowers the capacitor effect. However, with the commercial machines, we still recorded reactance values up at over a megahertz. Now, I do not know if that is a function of the quality of the machine or the fact that the body was not doing what it was supposed to be doing.
But what we have found from theory and from using these commercial machines is that they do not always agree. Now, maybe the Hewlett-Packard or some of these more expensive ones would give us the correct answers.
DENNIS BIER: As you mentioned in your presentation, there are a variety of people here who are on the NIH Technology Assessment Conference panel, and I do not want to compete with them.
WM. CAMERON CHUMLEA: Dennis was on the panel.
DENNIS BIER: It was hung up on two things. As opposed to what we heard about this morning, where there was one black box (you have a measurement and you know what it is measuring, and an algorithm, which is a black box), here we have two black boxes. We have the algorithm, in which remains a black box, and then we have a measurement which we do not really know what it is measuring. So we have a lot of theories about what it should be measuring and calculations based on electrical principles in defined physical systems, but until we determine what it is actually measuring on a biophysical basis, we have real trouble understanding what we are doing.
WM. CAMERON CHUMLEA: The report of this panel, if I am correct, will be published in The American Journal of Clinical Nutrition (NIH, 1996) as a special issue some time later this year.


