National Academies Press: OpenBook

Humanities Doctorates in the United States: 1995 Profile (1997)

Chapter: 1 DOCTORAL POPULATION IN THE HUMANITIES

« Previous: INTRODUCTION
Suggested Citation:"1 DOCTORAL POPULATION IN THE HUMANITIES." National Research Council. 1997. Humanities Doctorates in the United States: 1995 Profile. Washington, DC: The National Academies Press. doi: 10.17226/5840.
×

1
Doctoral Population in the Humanities

Distribution by Field

The estimated population of humanities doctorates in 1995 was 113,700. For this project the population was defined to include Ph.D.s who earned their degrees in a humanities field from a U.S. institution between January 1942 and June 1994 and who were age 75 or younger and residing in the United States in April 1995.

  • One-fourth of the humanities population was composed of doctorates in English and American languages and literature (see Table 1). Doctorates in history or art history accounted for another one-fourth of the population.
  • The next largest field was modern languages and literature at 16 percent. Also at 16 percent were the disciplines combined under the label "other humanities." The smallest distinct fields were art history (3 percent) and classics (2 percent).
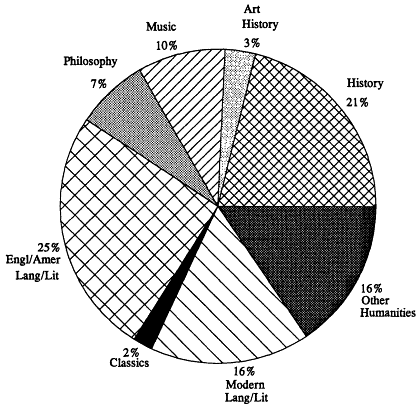
Figure 1.

Humanities Ph.D. population, by field of doctorate, 1995.

Suggested Citation:"1 DOCTORAL POPULATION IN THE HUMANITIES." National Research Council. 1997. Humanities Doctorates in the United States: 1995 Profile. Washington, DC: The National Academies Press. doi: 10.17226/5840.
×

Demographic Characteristics

In this section, humanities doctorates are described by such characteristics as gender, race, age, and citizenship (see Table 2).

Gender

  • Women comprised 35 percent of the U.S. population of humanities doctorates in 1995.
  • The fields of art history and modern languages/literature had the highest representation of women (59 and 50 percent, respectively); only 17 percent of the doctorates in philosophy were women.
  • The proportion of female humanities Ph.D.s grew from 17 percent of the group who earned their degrees more than 25 years earlier to nearly half of the doctorates from the most recent 5-year cohort (see Table 3).
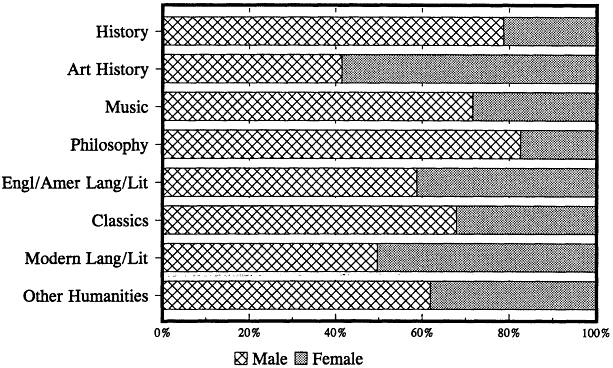
Figure 2.

Field composition of humanities Ph.D.s, by gender, 1995.

Suggested Citation:"1 DOCTORAL POPULATION IN THE HUMANITIES." National Research Council. 1997. Humanities Doctorates in the United States: 1995 Profile. Washington, DC: The National Academies Press. doi: 10.17226/5840.
×

Race/Ethnicity

  • The population of humanities doctorates was 94 percent white, 3 percent Hispanic, 2 percent black, and 2 percent Asian.
  • As might be expected, modern languages/literature had the highest ethnic composition of the humanities fields. Hispanics constituted 11 percent of the doctorates in this field.
  • The proportion of humanities Ph.D.s who were minorities grew from 3 percent of those who earned degrees more than 25 years earlier to 11 percent of the doctorates earned in the past 5 years.

Age in 1995

  • Of all humanities doctorates, 28 percent were age 44 or under in 1995. Doctorates age 55 or older accounted for 35 percent.
  • The youngest doctorates were in music: 43 percent were age 44 or under. History had the highest proportion of older doctorates: 41 percent were age 55 or older. Those with doctorates in classics and English were the second oldest, both at 38 percent age 55 or older.

Year of Doctorate

  • About 5 percent of all humanities doctorates received their degrees before 1960. Just over half received their degrees between 1960 and 1979, and 43 percent received their degrees since 1980.
  • Music doctorates were most likely to have recent degrees, in keeping with their younger age distribution: only 2 percent received their degrees before 1960, whereas 62 percent received their degrees since 1980.
  • Classicists were least likely to have recent degrees, in keeping with their older age distribution: 8 percent of classicists received their degrees before 1960, whereas only 35 percent received their degrees since 1980.
Suggested Citation:"1 DOCTORAL POPULATION IN THE HUMANITIES." National Research Council. 1997. Humanities Doctorates in the United States: 1995 Profile. Washington, DC: The National Academies Press. doi: 10.17226/5840.
×

Citizenship Status

  • Only 3 percent of humanities doctorates were foreign citizens in 1995.
  • Modem languages and literature had the highest proportion of foreign citizens (9 percent). Music, English, and philosophy had the smallest proportions (slightly less than 2 percent each).
  • Ten percent of the doctorates earned in the past 5 years were awarded to foreign citizens, up from only 1 percent of those earning their degrees more than 25 years earlier.
Suggested Citation:"1 DOCTORAL POPULATION IN THE HUMANITIES." National Research Council. 1997. Humanities Doctorates in the United States: 1995 Profile. Washington, DC: The National Academies Press. doi: 10.17226/5840.
×
Page 3
Suggested Citation:"1 DOCTORAL POPULATION IN THE HUMANITIES." National Research Council. 1997. Humanities Doctorates in the United States: 1995 Profile. Washington, DC: The National Academies Press. doi: 10.17226/5840.
×
Page 4
Suggested Citation:"1 DOCTORAL POPULATION IN THE HUMANITIES." National Research Council. 1997. Humanities Doctorates in the United States: 1995 Profile. Washington, DC: The National Academies Press. doi: 10.17226/5840.
×
Page 5
Suggested Citation:"1 DOCTORAL POPULATION IN THE HUMANITIES." National Research Council. 1997. Humanities Doctorates in the United States: 1995 Profile. Washington, DC: The National Academies Press. doi: 10.17226/5840.
×
Page 6
Next: 2 EMPLOYMENT AND UNEMPLOYMENT »
Humanities Doctorates in the United States: 1995 Profile Get This Book
×
 Humanities Doctorates in the United States: 1995 Profile
Buy Paperback | $36.00
MyNAP members save 10% online.
Login or Register to save!
Download Free PDF

READ FREE ONLINE

  1. ×

    Welcome to OpenBook!

    You're looking at OpenBook, NAP.edu's online reading room since 1999. Based on feedback from you, our users, we've made some improvements that make it easier than ever to read thousands of publications on our website.

    Do you want to take a quick tour of the OpenBook's features?

    No Thanks Take a Tour »
  2. ×

    Show this book's table of contents, where you can jump to any chapter by name.

    « Back Next »
  3. ×

    ...or use these buttons to go back to the previous chapter or skip to the next one.

    « Back Next »
  4. ×

    Jump up to the previous page or down to the next one. Also, you can type in a page number and press Enter to go directly to that page in the book.

    « Back Next »
  5. ×

    Switch between the Original Pages, where you can read the report as it appeared in print, and Text Pages for the web version, where you can highlight and search the text.

    « Back Next »
  6. ×

    To search the entire text of this book, type in your search term here and press Enter.

    « Back Next »
  7. ×

    Share a link to this book page on your preferred social network or via email.

    « Back Next »
  8. ×

    View our suggested citation for this chapter.

    « Back Next »
  9. ×

    Ready to take your reading offline? Click here to buy this book in print or download it as a free PDF, if available.

    « Back Next »
Stay Connected!