
2
CTBT Monitoring Technical Challenges that Drive Research
INTRODUCTION
The extensive U.S. experience of testing nuclear weapons and monitoring foreign tests provides an essential foundation for identifying and locating explosions in all environments of the Earth. From first principles and testing experience, the explosion characteristics of nuclear devices are well understood. However, the interactions of these explosions with surrounding media underground, underwater, or in the atmosphere are less well known. Importantly, these phenomena also play a role in monitoring activities. Specifically, the interactions excite disturbances of sound waves, stress waves, light flashes, radioactive gases, and debris clouds that can be observed at large distances using sensors in the atmosphere, ocean, or ground. These disturbances propagate through the Earth system obeying well-known laws of physics. By continuously monitoring the diverse media on the Earth, one can detect arrival times and characteristics of explosion signals at different positions on the surface or in space. By using a fundamental understanding of the propagation processes, the signals at various stations can then be analyzed to locate and identify an explosion source. Thus, if the acoustic properties of the ocean were well known as a function of depth, temperature, salinity, and bathymetric structure, one could use three different observations of hydroacoustic arrivals to triangulate accurately on the source. In practice, however, such capabilities are limited because the properties of the Earth, oceans, and atmosphere are complex and not completely characterized.
Given these limitations, there are two principal challenges for CTBT monitoring. First there is a need for a sufficient distribution of global monitoring stations to ensure a high probability of detecting, locating, and identifying explosions at yields and confidence levels consistent with national goals. This is the primary challenge for designing, operating, and maintaining the IMS and the assets of NTM. Second, there is a need to analyze monitoring signals, using a complete understanding of transmission paths and phenomena, to allow location and identification of potential explosions with confidence amidst the significant background of natural and human-induced sources of noise (e.g., earthquakes, quarry blasts, undersea volcanic eruptions). This is the primary challenge for basic research in support of CTBT monitoring, and it is the focus of much of this report. For that reason, the basic monitoring procedures that are the drivers for the most important research problems
are outlined in this chapter. Chapter 3 discusses the research activities necessary to enhance U.S. CTBT monitoring capabilities.
2.1 PHYSICAL PHENOMENA: SOURCE EXCITATION, SIGNAL PROPAGATION, AND RECORDING
Nuclear explosions can occur in space, the atmosphere, underwater, and underground. For monitoring sources in each medium the basic problem can be posed in terms of source excitation of the signals of interest, propagation of those signals through the various media, recording the signals, and ensuing signal analysis to detect, locate, and identify the source.
Atmospheric or Space Explosions
There have been 514 nuclear tests in the atmosphere and space conducted by five different nations (Adushkin, 1996). In an atmospheric nuclear explosion, a fireball is produced in the first fraction of a second after detonation as a result of the interaction of the atmosphere and the initial x-ray emission from the device. The thermal energy is reemitted in the visual and infrared spectrum, with the fireball light history involving a double flash (a rapid-duration flash followed by a longer-duration flash) that forms the basis for distinguishing nuclear explosions from chemical explosions and lightning. The pattern of light can be detected by satellite optical sensors (so-called bhangmeters) and is highly diagnostic of the source type. The atmosphere absorbs most other types of radiation (e.g. x rays, gamma rays, neutrons, beta particles) from low-altitude or below-surface tests, preventing them from being observed by remote sensors (DOE, 1993).
High-altitude explosions between 15 and 80 km produce large fireballs due to the thin atmosphere, with high visible light intensity. Above 80 km, the fireball is largely the result of ionized debris (DOE, 1993). As the atmosphere thins in approaching deep space (altitude > 110 km), the optical effects of the fireball diminish, but there is a corresponding increase in x-ray and gamma-ray emissions that can be monitored by upward-looking sensors on orbiting satellites. Explosions in the atmosphere produce ionized plasma in the source region that has a strong electromagnetic pulse (EMP) capable of disrupting communications over a large area and being monitored by EMP detectors on satellite systems. The DOE is currently developing a new generation of EMP detector for deployment as part of the U.S. NTM for atmospheric monitoring. However, numerous large lightning bolts as well as human-generated broadcasting activities also produce EMP signals that must be differentiated from explosion signals.
A nuclear explosion in the atmosphere will also produce acoustic signals (sound waves) that travel through the air at about 300 m/s, with energy concentrated in the 20 to 500 mHz range. Only a tiny fraction of the explosion energy is transmitted as sound waves, but testing experience has empirically been able to characterize the sound level as a function of explosion yield. This relationship, together with the background noise, provides a basis for defining infrasonic detection thresholds. Sounds transmitted through the atmosphere have predictable propagation properties influenced mainly by the vertical thermal and density structure of the atmosphere, which is quite well known. Secondary effects of wind patterns on the sound intensity are predictable if the wind patterns at various altitudes are known. IMS infrasound stations are arrays of surface atmospheric pressure sensors designed to record these signals.
In this period range, several natural phenomena can produce a background noise level. These include long-duration signals with a frequency of about 200 mHz, which are ocean wave-generated ''microbaroms." Short-duration impulsive signals more likely to be confused with explosion signals are generated by volcanic blasts, meteor falls, sonic booms, and auroral infrasonic waves propagating beneath supersonic auroral electrojet arcs (Figure 2.1).17 Historical experience with atmospheric monitoring suggests that at most a few events per day will be recorded at more than one of the IMS infrasound stations, whereas a 1-kiloton (kt) explosion will typically be observed at a large number of stations. Relative to the seismic problem, for which on the order of 100 events per day (or even more in the case of large earthquake aftershock sequences) are large enough for the IMS
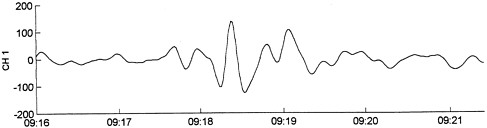
FIGURE 2.1 Example of a short-duration impulsive infrasound signal produced by an auroal infrasonic wave. The time scale of the record is approximately 5 minutes (Source: C. Wilson, personal communication, 1997).
to locate, the infrasound system will be confronted with far fewer events, but it could play an important role in identifying surface sources such as quarry blasts, as well as monitoring atmospheric events. The air disturbance from an atmospheric blast can also perturb the ionosphere, producing a propagating, large-amplitude deflection of the ionosphere that could be detectable by radiowave sensors, which reflect signals from the ionosphere, or by Global Positioning System (GPS) stations at the surface, which detect changes in the total electronic count associated with a frequency-dependent time delay. Such sensors are not part of the IMS.
Atmospheric blasts release radioactive particulates and gases that are transported by the wind. If the blast is near the Earth's surface, a cloud of dust, hot gas, and debris can rise with the vortex formed by the fireball, injecting debris into the upper atmosphere. Fission products and other vapors condense on soil and debris particulates, with the heavier particulates settling out near the source while lighter ones can be carried downwind (see Appendix G for more details). Explosions over water close enough to the surface for water to be vaporized by the fireball will have a large amount of local fallout as the fission products are washed out of the air, first with the descending water column, then with the resulting mist, and then in rain as the vaporized water recondenses (Glasstone, 1957). Radionuclide detectors at the surface will detect the particulates and radiogenic noble gases that are produced by atmospheric nuclear explosions, with wind patterns determining which stations "see" the event and at what time. Wind transport velocities are relatively slow (compared to sound waves); thus, radionuclide detections may take days to weeks, depending on source location, weather patterns, and the location of the nearest fixed station. The radioactive decay with time and the reduction in concentration due to various mechanisms as the material spreads out reduce the detectability of the material. Rain-out can rapidly reduce particulate concentrations, so the opportunity to observe the debris is time-limited. Rain-out will have little effect on the concentration of radioactive noble gases; so the monitoring of these gases is important. Radionuclide observations can be reliable indicators of an atmospheric test if the material is collected and analyzed early enough.
Near-surface atmospheric explosions can couple energy from atmospheric sound waves into the ocean or solid Earth. Thus, there is some role for hydroacoustic and seismic monitoring of explosions in the atmosphere, particularly in the case of evasion scenarios that attempt to mask the explosion by near-surface detonation (e.g., testing near the surface on a cloudy day with strong rains and certain masking efforts).
Underwater Explosions
Underwater nuclear tests are a major concern because, like atmospheric tests, they could potentially
be carried out in remote international waters, where—even if detected and identified—they may defy attribution (see Section 2.2). There have been at least eight underwater nuclear tests (five by the United States, three by the U.S.S.R.), which provide some basis for understanding these events. For a device tested underwater at depths less than about 70 m, the fireball will be significantly reduced relative to an atmospheric test, but most of the radioactive noble gases and a significant fraction of the other fission products will be released into the atmosphere, with the remainder deposited near the water surface. The altitudes reached by the ejected particulates tend to be lower than for low-atmosphere shots, and radioactive fallout tends to be reduced relative to explosions above land due to the lack of larger particulates. Tests in the depth range 70 to 300 m will allow a significant fraction of the noble gases to be released, but most of the other fission fragments will remain in the water. If the test is conducted deeper than 300 m, it is possible that no fireball will be detectable and most of the radioactive noble gases, along with the other fission fragments, will be absorbed in the ocean water before the bubbles can reach the surface. For such tests, there will be efficient excitation of acoustic and seismic signals. In underwater tests, much of the radioactive material will accumulate in the thermocline, a thermally stable layer of water that exists in the oceans from depths of about 200 to 900 m. A seasonal thermocline at a much shallower depth forms during summer as a result of solar heating. Thus, a highly radioactive pool will be formed that disperses much more slowly than do atmospheric clouds of radioactive gases and particulates.
An important effect of the hydrostatic pressure in the water column is that hot gases released by the explosion are contained in a bubble, which typically expands and contracts in radius several times and rises before collapsing. The repeated oscillations give secondary pressure pulses that generate acoustic waves in the water. These are called "bubble pulses" (see Appendix E for further discussion). Near-surface events may lack a bubble pulse because the hot gases vent directly to the surface.
Monitoring underwater explosions involves a combination of satellite, infrasound, radionuclide, seismic, and hydroacoustic methods, with the latter two playing the largest role. The explosion and repeated pulses of gas bubble oscillation produce sound waves that spread into the surrounding ocean. The variation of sound velocity in the water is sensitive to temperature and pressure conditions. A low-velocity waveguide, the SOFAR channel exists in almost all ocean environments to varying degrees (in some regions the minimum sound velocities are right at the ocean surface, but typically they are 0.5–1.5 km deep). Sound is channeled into the SOFAR channel for sources within, above, and below the waveguide, and sound waves with frequencies below 200 Hz can travel thousands of kilometers in all directions with little attenuation, although variations in seafloor topography, water temperature, and salinity, along with islands and seamounts, can block or modify propagation along some paths. The specific excitation of sound waves depends on the explosion depth, the local structure of the sound velocity profile, and lateral gradients in the velocity profile. Hydrophones, typically deployed vertically in arrays across the SOFAR channel or in some cases deployed horizontally in arrays on the ocean bottom, can detect the passage of hydroacoustic waves and measure the corresponding pressures in the sound pulses and their propagation direction (if arrays are used, but not for single sensors).
A 1-kilogram explosion detonated in the center of the SOFAR channel in most regions of the open oceans will be detected readily at numerous worldwide hydrophone systems. This results from the remarkable efficiency of sound propagation in the oceans. Explosions at different positions with respect to the SOFAR channel will couple less efficiently, but most excitation effects are well understood except for sources right at the ocean surface or ocean bottom. At these interfaces the synergy between hydroacoustic methods and infrasound, seismic, and NTM is an important factor. In principle, it is possible to detect events anywhere in the ocean down to fractions of a kiloton in yield, as long as the hydroacoustic network is adequately configured. A sparse hydroacoustic network intrinsically has blind spots that must be monitored by other means, due to blockage of hydroacoustic signals by coastlines or ocean bathymetry. If the network is composed of single sensors that cannot measure propagation direction, the association of arrivals from a given event in the presence of nonstationary noise presents special problems.
Aside from blockage of the SOFAR channel for
certain source regions, the main operational issue for a hydroacoustic network is discrimination of the various noise sources from explosions to avoid false alarms and to provide the location of sources of all types. Given the efficient sound transmission properties, low-amplitude acoustic signals are detectable around the world from chemical explosions for military exercises and airguns for oil exploration. Underwater earthquakes can also produce vibrations of the ocean floor that couple into hydroacoustic signals (T-phases). These tend to be long-duration signals due to the size of the effective source region where they are excited (the surface area over which seismic wave energy couples into hydroacoustic energy). Underwater volcanic explosions can emit impulsive sound waves, either in short bursts or in long sequences (sometimes called "popcorn" signals), and bubble pulses may be produced by some volcanic eruptions if magma is exposed to ocean water. Meteorite falls can produce significant hydroacoustic signals if they impact the water. Ships produce both narrowband and broadband signals, and whales produce noises at low frequencies as well.
Given the effectiveness of low-level detections in the hydroacoustic environment, a major operational decision involves determination of the sound amplitude threshold below which events will not be considered in order to avoid being swamped with analysis of numerous small sources. This requires an informed assessment of the extent to which source excitation can be reduced by testing at the surface or in regions with extensive blockage of the SOFAR channel, as well as the synergies achievable through the use of other monitoring technologies, including NTM.
Seismic stations contribute to monitoring the underwater environment in several ways. First, explosions in the water are efficient generators of seismic waves, because hydroacoustic energy efficiently generates downgoing seismic waves below the water. As a result, seismology provides monitoring for regions in which a hydroacoustic network has blind spots. Second, submarine earthquakes that generate T-phases should also generate seismic waves whose approximate origin time and location can be used to identify the hydroacoustic signal (which in turn may help to locate the event). In addition, seismic stations can be deployed on the ocean bottom or in drill holes in the ocean floor, and these can directly observe both seismic and hydroacoustic signals (changes in water pressure due to sound waves in the ocean move the ocean bottom up and down and thus are recorded on the seismic ground motion sensors). Seismic stations deployed on islands and near continental margins can detect hydroacoustic waves that convert to seismic waves at the land margins and then propagate through the rock. The efficiency of conversion of hydroacoustic to seismic energy laterally across a coastline is strongly influenced by the slope of the underwater margin, with steeper slopes favoring coupling. Five of the IMS hydroacoustic network stations are seismic stations deployed on islands for the purpose of monitoring hydroacoustic phases converted to seismic T-phases. Typically stations must be deployed on several sides of an island to provide sensitivity to waves arriving from different directions.
It is important to recognize that as a result of political considerations related to concerns about tracking ships and submarines, the IMS hydroacoustic network was designed to be a sparse, limited-capability system. For example, IMS hydroacoustic stations involve only single sensors, rather than distributed arrays. The resulting inability to determine the direction of approach of hydroacoustic waves leads to difficulty in associating signals with particular sources and in determining source locations. Furthermore, the sparse distribution of IMS hydroacoustic systems results in many blind spots due to blockage of propagation in the SOFAR channel by coastal configurations and variations in bathymetry. These blind spots will require seismic monitoring or coverage by NTM.
Underground Explosions
Underground nuclear explosions present a monitoring challenge. Although there has been extensive underground testing, with more than 1570 known tests (Adushkin, 1996), and the physics of excitation of seismic signals by explosions is quite well understood, the solid Earth is physically a heterogeneous and "noisy" environment. Because the solid Earth is much less accessible for direct measurement of physical parameters than the oceans, atmosphere, and space, models for seismic propagation in the interior are correspondingly less detailed. Furthermore, numerous non-nuclear sources produce seismic signals similar
to those expected from small nuclear explosions, so that the potential for event mis-identification (false alarms) is substantial. These factors pose the greatest research challenges to seismology; however, hydroacoustics, infrasonics, radionuclides, and satellite imaging all can contribute to monitoring underground tests; thus, research in these areas is also warranted. The OSI issues for the underground environment are also challenging.
Underground nuclear tests are typically designed to be well contained, meaning that the depth of burial, the material properties, and other operational factors are sufficient that explosion materials do not vent to the surface. However, many underground tests in the past did in fact vent radionuclides. Presumably, a determined evader would want to avoid significant release of debris in order to avoid detection by radionuclide monitoring or OSI. The evader would also want long-term containment of noble gases, which is difficult because of rock fracturing above the explosion site and the mobility of these gases.
For a 1 kt explosion, U.S. experience suggests that burial depths of greater than 107 m will contain gases from the experiment; the depth of burial for containment scales with the cube root of the explosion yield (DOE, 1993). Underground explosions at these depths or greater may be located in boreholes, tunnels, mines, or caves. If drill holes are used, activity related to drilling, emplacement, and diagnostic facilities may be detected and monitored by high-resolution overhead methods, although such approaches typically work best when the location of the test is well known. Emplacement in mines or tunnels or in large cavities excavated in rock or salt for the purpose of decoupling could allow concealment of diagnostic facilities. Unrelated mining activities might further obscure nuclear testing operations and signals.
An underground nuclear explosion releases energy in microseconds, with a fully tamped explosion vaporizing rock surrounding the device and producing a gas-filled cavity having pressures of several million atmospheres that expands outward rapidly, sending a compressional shock wave into the surrounding rock. This shock wave initially melts and shatters the medium as it propagates but progressively decreases in amplitude until the rock begins to respond elastically (i.e., it returns to its initial state after the disturbance passes by) to the outward-propagating wavefront. At this point, called the elastic radius, the wave becomes a type of seismic wave called a P wave (analogous to a sound wave in the air) that propagates away from the source volume as a spherically expanding wavefront of radial compressional motions of the solid rock. The explosion source process is rapid relative to natural earthquake events of comparable total energy release, and in the ideal case for a homogeneous source region the seismic radiation from an explosion is isotropic, with uniform amplitudes over the spherical P wavefront. The physical dimension of the source volume (defined as the region of nonlinear rock deformations within the elastic radius) is much smaller than the fault zone for a natural earthquake of comparable energy release; however, this difference decreases at small magnitudes, and attenuation may eliminate the frequencies at which the differences could be observed. For both explosions and earthquakes, only a small fraction of the total energy released at the source is contained in the elastic wavefield.
Solid materials transmit a second type of elastic wave that involves transient shear deformation of the medium. Known as S waves, these propagate only through the solid Earth, not in fluids such as the oceans or atmosphere. Both P and S waves are referred to as body waves because they travel through the Earth's interior. Although P waves are the predominant seismic signal from explosions, a smaller fraction of S waves can be generated from asymmetries in material properties around the source, cracking and shearing of rock above the shotpoint, and relaxation of ambient tectonic stresses in the rock volume surrounding the explosion cavity. The S waves travel more slowly than P waves: for a typical crustal rock the P-wave velocity is on the order of 6 km/s, whereas the S-wave velocity is 3.5 km/s.
Pressure and temperature effects, along with changes in rock mineralogy and composition, cause seismic velocities to vary with depth as well as laterally at a given depth. At the Earth's surface and at sharp internal boundaries between rock masses with different seismic velocities and densities, P-wave energy can convert to S-wave energy and vice versa, so the total elastic wavefield in the Earth always involves a complex distribution of propagating P-and S-wave energy, with the source
and propagation effects controlling the partitioning of energy. At the surface, the interaction of P-and S-wave energy produces disturbances that travel as surface waves (i.e., their amplitudes decrease with depth from the surface). Seismic wave energy is also dissipated by irreversible processes such as friction, fluid pumping, and dislocation motions in crystals. These mechanisms attenuate seismic waves with increasing propagation distance and spread the seismic energy over larger and larger areas of the Earth's surface.
Seismic waves produce characteristic motions of the medium that can be recorded by ground motion sensors (seismographs) located at fixed positions. By recording three orthogonal components of ground motion as a function of time, the complete history of ground motion at the seismic station can be recovered for analysis, albeit limited by the filtering effects of the instrument. The times of particular ground motions are controlled by the distance from the source, the time of the source event, and the seismic wave velocities between the source and the receiver. The recorded ground motions, or seismograms, are time series that are typically digitized with discrete time sampling and written to tape or disk or telemetered to a central analysis facility. A station at a given distance from a source will record a sequence of arrivals involving P and S waves that travel through and reverberate in the Earth's structure and surface waves that travel along the surface from the source to the station.
The general characteristics of seismic waves differ as a function of the distance traveled. Signals recorded at distances less than 1000–2000 km are called regional waves, whereas those at distances greater than 2000 km are called teleseismic waves. Regional waves primarily travel in the low-velocity crust (25 to 70 km thick in continental regions) and uppermost mantle. Seismic wave amplitudes at regional distances are strong near the source but decrease in amplitude with distance and can be too small to detect beyond 1000 km. Thus, the word "regional" here carries the additional implication that such waves are dependent on the properties of the Earth's crust and uppermost mantle, which can vary quite strongly from one region to another. The P waves in the distance range 1000 to 2000 km tend to have low amplitudes due to defocusing by upper mantle velocity gradients and/or waveform complexities due to interactions with the velocity layering in the transition zone (400–670 km deep); this range is sometimes called the upper mantle triplication range. Teleseismic body waves tend to penetrate through the mantle transition zone and reach their lowest point in the lower mantle or core of the Earth. Teleseismic P waves from 3300 to 9000 km tend to exhibit simple propagation effects and are the most straightforward to interpret.
For decades following the LTBT, when nuclear testing was carried out underground and in-country monitoring was not permitted, monitoring was conducted using teleseismic signals. With the CTBT and the permitted use of in-country stations, attention returns to the study of regional waves because they provide the strongest signals and may be the only detectable seismic signals from small-magnitude sources. Though regional waves can have large amplitudes (and thus be detected easily if a seismometer is operated at a regional distance from a source of interest), they are more complex and harder to interpret than teleseismic waves. An extensive data set of seismic signals from a given region must first be acquired and understood before regional waves recorded within it can be interpreted in detail, a process frequently referred to as calibration. (Sometimes, however, the data from a more easily accessed region can be used to aid in the interpretation if the two regions are geologically similar.) The IMS will rely mainly on teleseismic data to achieve global monitoring, whereas NTM will have to use regional data for certain areas in order to meet U.S. monitoring objectives. Thousands of stations outside the IMS are potentially available to supply supplementary regional data for events that the IMS and NTM may detect and to aid in the calibration of IMS and NTM stations.
A major seismic monitoring challenge arises from the fact that ambient ground motion forms a background noise level at every seismic station. This noise is composed of surface motions caused by local weather conditions, vibrations produced by wave interactions in the oceans (microseisms), human-induced activity, and many other localized or distributed sources of seismic waves. It is station specific and establishes a lower bound for detectability of P and S waves from distant sources. Recording signals with groups of sensors
distributed in a pattern—a seismic array—allows the signals to be enhanced by summing the traces, thereby suppressing incoherent background noise. Array recordings can be processed to determine the direction of approach of a wave as well.
A great number of background signals are as large as the signals expected for a small nuclear test. For example, there are about 7000 earthquakes per year with seismic magnitudes of 4.0 or larger and about 68,000 earthquakes per year with magnitudes of 3.0 or larger (Ringdal, 1985). A global seismic monitoring system that compiles all global events larger than magnitude 3.0 would have to detect, locate, and identify 186 events per day, on average, as well as with deal with intermingled arrivals from many smaller events detectable at some stations. Pushing the monitoring threshold downward has serious operational implications because there are about 209,000 magnitude 2.5 earthquakes per year (572 per day). At the lower magnitude, quarry blasts and natural phenomena such as volcanic eruptions, avalanches, and landslides add to the total number of events that can be detected. Fortunately, U.S. monitoring concerns greatly reduce the areas that have to be monitored down to low seismic thresholds, which greatly decreases the number of events that must be processed in the CTBT monitoring system.
The coupling of seismic waves into acoustic waves in the oceans and atmosphere, as well as the direct excitation of infrasonic waves by sources that disrupt the surface, allows hydroacoustic and infrasonic methods to be used to monitor underground events. Other methods that exploit energy coupling from the solid Earth to the atmosphere could also be useful. These include monitoring of ionospheric deflections, EMP, and radioactive materials released by venting. In addition, postevent seepage through cracks and fissures might be detectable by OSI methods (which can include drilling back into the source region). The upgoing shock wave can affect surface flora and soil conditions, displace material at the surface, and cause faults and fissures to appear. If the surface material settles back into the explosion cavity, a collapse crater may appear at the surface. Such surface disruptions can be detected by satellite imagery and OSI methods. Highly precise pre-and postexplosion imaging is needed, so this is a practical monitoring strategy only for localized candidate testing areas that are predefined by other criteria. Finally, any underground nuclear test will involve significant drilling, tunneling, mining, and instrumental recording activities that may be monitored by satellite imagery and other NTM, again subject to the need to localize the activity by methods other than imagery.
2.2 FUNCTIONS OF MONITORING SYSTEMS
Section 2.1 summarizes the physical processes involved in exciting wave disturbances and radioactive emissions that potentially can be detected at large distances. The process of monitoring the CTBT involves systematic screening of all types of signals detected by the monitoring network for the purpose of identifying those from any nuclear explosion that might take place. The challenge lies in distinguishing signals generated by natural or benign human-induced sources from those of a nuclear explosion against a background of ambient noise. At every stage of the monitoring operation there are basic functions that must be performed that depend on scientific understanding of the phenomena; these are discussed below.
Event Detection
The first substantial signal processing step in CTBT monitoring by technical means is the detection of signals of the type that would be emitted by a nuclear explosion. In the case of seismic, hydroacoustic, and infrasound technologies, this means searching a continuous time series for excursions from or changes in the background "noise" level or the appearance of spatially correlated energy with little or no change in signal level or spectra. In the case of radionuclide technologies, it means comparing the gamma-ray spectra collected from daily samples with the spectra expected from products of a nuclear explosion. The remainder of this section discusses the processing of the continuous time series. The seismic methodology forms the basis for this discussion because it is most developed in the CTBT context. Processing is similar for the hydroacoustic and infrasound technologies.
Each underground event creates a variety of signals due to the near-source effects described in the previous section and the heterogeneity of the
paths from the source to the receiving site. The pattern of signals varies from station to station, and the signals from the many nonnuclear sources overlap and mask each other. The first step in signal processing is to determine if individual signals are present and then to group together those signals associated with a specific event. In the case of both hydroacoustic and infrasonic systems, the propagation speed is lower and the presence of spurious signals can lead to difficulties in associating signals, particularly for sparse networks.
The seismic signal detection process at the prototype IDC combines signal tuning, a short-term/long-term detection algorithm, and processing for array stations to detect the waves and determine the arrival times to be used in the association algorithms. Because of the large volumes of data, automatic detection processing is essential. The signal detection processing relevant to CTBT monitoring must address the problem of detecting unknown or highly varying signal shapes with spectra that overlap the spectra of the background noise. Publications of the Group of Scientific Experts of the Conference on Disarmament and of the Center for Monitoring Research describe the process and its results in detail. The following discussion is an abridged version of those descriptions.
Signal Tuning
Tuning begins with the identification and adjustment of bad data because failure to do so results in many spurious detections and, ultimately, failed or false associations. The individual channels are examined in 4-second segments for spikes and for sequences of zeros or data of constant value. If the number of data with bad values in the segment does not exceed a number specified by the user, the bad data are adjusted by setting them to zero or by interpolation between adjacent values. If the number of bad values in the segment exceeds the reference number, the segment is excluded from further processing.
Detection Algorithms
The data used in the detection process consist of filtered versions of tuned individual or, in the case of arrays, combined channels. The criteria for combining the data reflect the information known about the phase velocities, frequency content, azimuthal distribution, and optimum channel weights at each station. Coherent and incoherent array beams (beams are sums of seismograms with small timing shifts to align them on a particular arrival azimuth and angle of incidence at the surface; coherent beams sum the actual seismograms, whereas incoherent beams sum envelopes of the seismograms, removing the phase information) are used to detect the P and S waves, respectively. The IMS beams are equispaced in azimuth and often are based on subsets of array channels in order to suppress coherent noise. Various steps in the process are applied to the data from both array stations and three-component stations.
In the CTBT context, seismic signal detection processes are currently tuned to detect the first arrival of a series of seismic phases associated with an event. The tools are applied in the frequency range 0.5–5 Hz. The most common approach is to compare some measure of the short-term average (STA) signal amplitude or power to a similar measure of the long-term average (LTA) signal amplitude or power. When the STA exceeds the LTA by a fixed level, a detection is declared. It is also common to make this comparison in several rather narrow-frequency bands, a detection being declarable on one or on a weighted combination of filtered channels. In arrays, a detection will often be declared on several beams nearly simultaneously. The beam with the highest signal-to-noise ratio is accepted as the correct one. Signal detection algorithms used in some networks require detection of the data from more than one element of the network before a "network detection" is declared. This is an effective criterion for eliminating false or spurious detections, but its use raises the detection threshold because detection must occur at the station with the worst detection level of the stations used.
Detection parameters must be adjusted for each array or three-component station to achieve optimum performance. The primary adjustable parameters are the durations of the STA and LTA, the STA/LTA ratio above which a detection is declared, and the filter bands. For example, studies of the station at Lormes, France, indicated that a reduction in the length of the interval used in computation of the short-term average reduced the
number of false alarms while detecting more actual seismic phases. In general, these parameters are adjusted so that few, if any, signals from real events are missed. The result of this approach is that many, up to 90 per cent, of detected signals are never used either because they are spurious or because they cannot be associated with other detections to form a well-located event. Nonetheless, experience with the prototype IDC in December 1995 showed that about 30 per cent of the detections used in event location must be added by the analysts, so there is significant room for improvement in detector efficiency.
Onset Estimation
Once a signal detection has been declared in an automatic processing system, the next step is to measure the characteristics of the detected signal. This includes amplitude, period, azimuth of approach, direction of ground motion (in the seismic case), phase velocity, and time of arrival or onset time. An accurate onset time is critical for the location process; the other characteristics are useful for source location and for identification of the arrival type and the source.
At the prototype IDC, determination of the onset time associated with a detection is usually made on the detecting beam with the largest signal-to-noise ratio. If the detection is made on an incoherent beam (which is usually the case for S-wave detections), the onset is estimated from a vertical coherent beam composed of a subset of filtered data streams similar to those of the detecting beam. The time of arrival of the onset is defined as the time corresponding to one-quarter cycle before the arrival of the first large peak in the window surrounding the initial detection. The results from processing have agreed with those of an analyst to within 1 second about 75 per cent of the time.
Other techniques have been proposed. The prototype IDC has an option to apply a "Z" transform based on a statistical treatment of the excursions of STA from the mean level. Another technique developed by Pisarenko et al. (1987) and Kushnir et al. (1990) defines the onset time as the time at which the statistical features of the power or frequency content of the observed time series change abruptly. This technique uses maximum likelihood spectral estimates of the waveform in an autoregressive model. The experience in the prototype IDC, using autoregressive models, was that most of the arrival times were late, and manual corrections moved the automatic arrival forward in time, up to 2 seconds. However, about one-half of the automatic time "picks" remained unchanged when reviewed by an analyst. More research is required to refine these techniques in the seismic case.
Other deterministic techniques, described by Stewart (1977), work entirely in the time domain. They transform the seismogram into various versions of a "characteristic function" or recombination of the individual data points in which abrupt changes in amplitude or frequency are more easily recognized.
Association
Whereas the detection of arrivals in a given time series requires relatively little knowledge of the medium in which the signals are propagating, the process of associating arrivals at different stations with a common source requires extensive knowledge of how signals traverse the medium. At first thought, this seems like a straightforward activity, but in fact it typically drives the most computer-intensive operational element of any monitoring system. The problem is complicated by the mixing of detections from many global sources, and some detections may be observable at only one or a few stations. The systematic variation of signal amplitudes with propagation distance must be allowed for because a strong arrival at a station may be produced by a small local event, a moderate-size event at a greater distance where wave energy gets strongly focused, or a distant strong event. In all media, but particularly in the solid Earth, multiple arrivals from a given event are expected in a distance-dependent sequence, and these may or may not be detected and identified completely at each station (due to variations in source radiation pattern, source excitation effects, attenuation and blockage, geometrical spreading effects, and detector sensitivity). Associating radionuclide anomalies with a source region can involve either backtracking wind patterns from observing stations or using forward calculations for possible event locations based on other monitoring technologies.
Particular challenges for association occur when there are clusters of events, such as earthquake aftershock sequences and chemical explosions in some active mining areas, whose signals must be unscrambled to locate each event. In the oceans, seismic exploration for hydrocarbons and shipping can mask some events of interest to CTBT monitoring, such as low-altitude atmospheric explosions over water. Furthermore, the small number of hydroacoustic stations, the low speed at which acoustic waves propagate, and the multiplicity of transient sound sources in the ocean pose a special problem in association for ocean paths.
The standard information used to associate events is empirically determined travel times of different wavetypes as a function of distance from the source, or so-called travel time curves. Observed travel time curves are often used to determine models of the velocity variations in a medium. These models are then used to predict travel times for all phases (even those that are poorly observed empirically). If the medium is so heterogeneous that a single travel time curve cannot be used everywhere, regional travel time curves can be used (or a laterally varying Earth model can be determined) or empirical corrections for travel times in different parts of the Earth can be tabulated. Travel time curves for direct teleseismic P waves in the Earth typically predict global arrival times to on the order of ±1 second at a given distance (greater scatter is found at regional distances), so association is based on this level of consistency of arrivals at different stations for any postulated event location and origin time. Classic procedures for seismic association would use pairs of detections to form trial location estimates that were tested for consistency with other arrivals, both in the positive sense of having a detection with a consistent arrival time and in the negative sense of not having a detection when one should have been observed for the trial location.
A critical parameter in the association process is the definition of the number of detections required to form a legitimate event, especially given a sparse network intended to monitor low thresholds. Phase identification thus plays a major role because confident identification of multiple arrivals from a single event at a given station can reduce the number of stations needed to define and locate the event. Analysis of the direction of ground motion provides the primary basis for identifying seismic wave arrivals, which have distinctive angles of incidence depending on their propagation path and distinctive polarization of ground motion depending on the type of phase. Association is also influenced by the extent to which individual detections can be processed to characterize the azimuth of arrival at the receiver. In principle, an event can be defined and located by a single seismic station or array if at least two phases (e.g., P and S) are detected, associated, and identified correctly, providing an estimate of the distance to the source based on the systematic variation of relative arrival times as a function of distance and the azimuth to the source is determined by polarization or array analysis. In practice, multiple stations are often used because associating detections from multiple stations reduces errors in the location estimates. The prototype IDC currently uses an automatic event definition based on a sum of weighted observations at Primary stations, with a weighted sum threshold of 3.55 and no requirement for the minimum number of stations. All automatic event lists contain some events with one or two stations, but the final Reviewed Event Bulletin (REB) produced by the prototype IDC includes only events defined by at least three P-type phases at Primary stations.
The actual process of associating multiple detections at the prototype IDC involves a recent research development called Global Association (GA). A global grid of possible source locations is considered systematically as a function of time by testing the list of station detections for consistency with predicted arrival times at each station. This exhaustive search, enabled by fast computer processing, is more effective than classic methods of iteratively forming and breaking up trial location estimates. It has the advantage that a priori knowledge about the time corrections, blockage characteristics, and noise levels for various possible source-receiver geometries can be incorporated. This strategy can be implemented for all of the monitoring technologies if the a priori knowledge is available. Current versions use parametric measurements for discrete detections, but research is being done on methods that use the continuous time series. Algorithms proposed by Ringdal and Kvaerna (1989), Shearer (1994), and Young et al. (1996) operate on the waveforms themselves, without relying on the determination of times of arrival of individual phases. Such methods blur
the distinction between detection and association and, in effect, detect events rather than individual phases. These methods show promise, but more work must be done before they can be introduced for general-purpose processing.
There is a strong interaction between detection thresholds and the association problem. During December 1995, only 5 per cent of the detections at IMS Primary stations and 6 per cent of the detections at Auxiliary stations were eventually associated with events that were published in the REB. Presumably this reflects large numbers of small arrivals detected at single stations and is a necessary outcome of monitoring low-magnitude thresholds. One cannot simply restrict the detections of interest to those with certain amplitude levels, given the variability of signal amplitudes caused by source and propagation effects.
The methodologies for associating hydroacoustic and infrasonic detections are similar to those for seismic signals. In the study of underwater acoustics, however, different terminology has been used, and there are some differences in signal processing details. For example, the process of association in acoustics would normally include array processing and interarray processing. Acousticians have typically dealt with arrays of individual sensors and relied heavily on coherent array processing and less heavily on coherent interarray processing. The IMS hydroacoustic network has no array processing involved in the conventional acoustic sense because there are no arrays. Thus, association of the signals at widely separated hydroacoustic and T-phase stations to triangulate on event location is identical to the seismic process.
Source Location
An event location is given by the latitude, longitude, depth or altitude, and time at which the energy release occurred. The association process generates an approximate location for an event, which must then be refined. It must be recognized that in the absence of ground truth for a given event, there are only estimates of the actual source location. Typically, this is obtained by solving a mathematical problem where the data are the arrival times of various types of signals at different sensors around the Earth's surface and the ''model" is a set of relationships between travel times and distances for various wavetypes. In practice, the prototype IDC uses an iterative, nonlinear inversion process involving measurements of the arrival time, the azimuth of approach, and the apparent velocity of the wave along the surface.
Consider the situation for an event to be located by seismic waves. Estimating the source parameters most consistent with a group of associated arrivals requires source depth-dependent travel time curves for the Earth, which is one form of "model." This empirical information can be tabulated or incorporated into another form of "model" involving an explicit representation of the seismic wave velocity structure inside the Earth obtained from inversion of the travel time curves. Such inversions essentially smooth and interpolate the surface observations, giving a mathematical representation that can be used efficiently in computing theoretical travel times for waves anywhere in the medium (essentially giving the same result as interpolating travel time curves directly). Velocity models can be prescribed as a function of depth only (one-dimensional models) or as complete three-dimensional structures, while travel time curves may be regionalized or accompanied by source region or station corrections that account for deviations from a given curve. However detailed they may be, the resulting seismological models are simplified and averaged representations of actual seismic velocities inside the planet. Imperfect knowledge of the three-dimensional distribution of seismic velocities intrinsically limits the ability to determine the source's location and origin time, given a set of observed P and S arrival times at different stations (see Appendix C).
All underground source locations are estimates that depend explicitly on the seismic model used to interpret the observed arrival times, as well as on the extent to which available observations intrinsically allow the location to be estimated (e.g., the azimuthal distribution of stations recording the event). Uncertainties in source parameter estimates therefore involve the combined effects of using an approximation to the actual Earth structure, measurement error, and limitations due to station coverage. Estimates of uncertainty are usually given in terms of a "90 per cent error ellipse," defining that area of the Earth's surface within which the located event is expected to fall with 90 per cent confidence. There is a fundamental
difference between the precision of a location estimate and its accuracy. Precision reflects the random variability in the solution, whereas accuracy pertains to errors relative to the true location. Internally consistent data sets can give exceedingly precise locations that are badly biased due to the use of an incorrect model; these therefore have low accuracy. The uncertainty due to measurement error and station or phase coverage can be assessed formally in the context of the mathematical inversion procedure, but the biasing effects due to inaccurate propagation models are much harder to determine. For small events that are recorded by only a few stations, typically at regional distances where the waves travel in heterogeneous crustal structure, uncertainties in the velocity structure usually result in poor location estimates, and there are corresponding difficulties in identifying the source type. In 1995, 18 per cent of the events reported in the REB had error ellipses with areas less than 1000 km2 (the CTBT goal); 49 per cent had error ellipses between 1000 and 10,000 km2; 23 per cent had error ellipses between 10,000 and 100,000 km2; and 10 per cent had error ellipses greater than 100,000 km2 (Ad Hoc Group of Scientific Experts, 1996). Deployment of additional IMS stations will improve performance significantly, particularly as azimuthal coverage improves and station corrections are determined, but the error ellipse estimates may not reflect systematic or model uncertainties.
Statistical estimates of the model uncertainty can be extracted from large data sets or from physical bounds on viable model parameters, but these approaches tend to result in unacceptably large location uncertainties. Typically some form of direct calibration is required, involving, for example, travel time corrections for paths from a source region to the monitoring network that account for errors in the standard model used. Calibration can be performed by using events with known source parameters (e.g., controlled explosions or earthquakes that rupture the surface) or, less directly, by developing improved three-dimensional velocity models that reduce model inadequacy (Appendix C considers this issue in some detail). A major problem confronting CTBT monitoring is that uncertainties in current seismic velocity models (even three-dimensional versions) are large in the context of the accuracy desired, and the opportunities for direct calibration of source or receiver paths are limited. This is true for hydroacoustic and infrasound methodologies as well, but the solid Earth environment is significantly more inaccessible in terms of measuring the properties required to make a highly accurate model of the medium. Thus, achieving the CTBT requirement of high-confidence absolute location uncertainties of 1000 km2 requires both accurate seismic models or network calibration and a clear understanding of the remaining biases in absolute location accuracy, along with use of complementary technologies such as satellite imaging. Although the acoustic velocities in the infrasound and hydroacoustic methods can, in principle, be measured directly, these velocities are time dependent, with major dependencies on seasons and—in the case of the atmosphere—on winds. Radionuclide detections can contribute to source location by providing information about the strength and isotopic distribution at various sites. Atmospheric back-trajectories can be computed to provide low-resolution estimates of the source location that can then be correlated with events detected by other methodologies. This procedure would take place days to weeks after the event was located by seismic or acoustic signals.
The event's location estimate includes a value for its depth, which can be the most poorly determined parameter for most events. It reflects the fact that variations in depth of the source have similar travel time effects at all stations and thus there is a strong trade-off between the depth of the event and the origin time. The prototype IDC assumes an initial location at the surface and changes this only if the data absolutely require it. Seismic depth phases (waves that bounce off the surface above the source and hence arrive at the stations with delay times that indicate depth) can resolve the depth, but during December 1995, less than 10 per cent of the REB events had depths determined by depth phases (which are clearest for relatively infrequent earthquakes deeper than 50 km). During the same time, 25 per cent of the REB events had depths resolved by the location process (Ad Hoc Group of Scientific Experts, 1996). Calibration of the network will improve depth resolution, which is desirable because it is one of the definitive ways of ruling events out as possible nuclear tests.
The principal method for improving seismic event locations by the IMS and U.S. NTM is will
be a long-term process of comparing the locations with those from various regional, national, or international organizations operating large numbers of stations. The panel notes that this process would be enhanced if IMS data were openly available to the research community. The underlying point here is that for treaty monitoring, location estimates must be provided promptly, within one or two days, which typically prevents making use of numerous additional stations that have good data but do not report to the IMS or the U.S. NDC. Fortunately, many event locations with precision better than 5 km are published openly (although not always promptly) for many regions of the world, and these locations can be used to build up an archive of calibration events with which treaty monitoring organizations can improve their location procedures.
Given multiple monitoring technologies for which the data streams can be fused, event location can incorporate the propagation attributes of multiple wavetypes if detections are associated reliably. This presents some challenging research problems for merging different data types with different intrinsic resolution. With radionuclide data being delayed relative to other data types, source regions determined by backtracking can be used to identify sources detected by other means or as a motivation to reexamine archived data for undetected events.
Size Estimation
Interpreting the strength of signals recorded at large distances from a source in terms of the physical energy released at the source is a pervasive need of monitoring operations. This goes to the heart of defining the explosion yield levels associated with diverse monitoring thresholds, as well as playing a key role in event identification procedures. Various technologies make different contributions to estimating size. It is difficult to employ radionuclide identification to determine the size of a nuclear test because there are many processes that attenuate the size of various radionuclide signals, such as soil and water absorption, atmospheric fallout, rain-out, delayed releases of radioactive noble gases, and different atmospheric absorption and diffusion processes. Modeling of these effects is still warranted, given that explosion size may have a role in attribution and technology assessment, but radionuclide monitoring plays its most critical role as a discriminant that a nuclear explosion has occurred.
With the other monitoring technologies, size estimation is essential for assessing the levels of national monitoring capabilities. If an event is identified confidently as a nuclear explosion, it is then possible to estimate the yield of the explosion from empirical or theoretical knowledge of how explosion sources generate the observed signals. As described in Section 2.1, the propagation effects for hydroacoustic, infrasound, and seismic waves must be understood if observed signal amplitudes are to be related to source energy release, and this must be done without a priori knowledge of the source type. In effect, there is a need to know the variation of signal amplitudes with distance from a source for different frequencies and wavetypes. This allows the effective source strength to be estimated as a function of frequency and signal type, which provides the basis for many event identification procedures.
Just as for wave travel times, characterizing propagation effects on amplitudes in different media can involve either empirical or model-based strategies. Amplitude-distance curves, analogous to travel time-distance curves, can be used to estimate amplitudes at the source from amplitudes observed at the recording stations. This is a standard practice in seismic magnitude determination. Model-based strategies involve systematic studies of a medium to determine the nature of wave propagation in the medium as represented by one-, two-, or three-dimensional models. This requires techniques that can accurately solve the acoustic or elastic wave propagation equations in the model for the phases of interest. Such approaches estimate the source strength using the entire recorded signal.
Seismic event size or magnitude is based on measuring the amplitude of particular phases on seismograms (further details of magnitude estimations are given in Appendix D). The four most common measures of magnitude are: mb (measured for the onset of short-period P waves), MS (for long-period surface waves), ML (peak short-period motion of S waves at local distances), and mb(Lg) (short-period surface waves at regional distances). All of these phases are corrected for distance using empirical amplitude-distance curves as discussed in Appendix D. The range of magnitude-yield variations with source emplacement
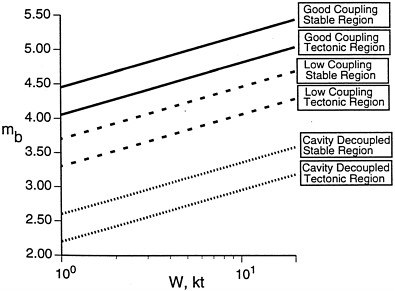
FIGURE 2.2 Comparison of mb-yield (W) relations for underground nuclear explosions, illustrating the effects of test site tectonic environment and cavity decoupling. Source: Murphy, 1996.
media is illustrated in Figure 2.2. Analogous relationships exist for hydroacoustic and infrasonic measurements as functions of explosion size in the oceans and atmosphere. In the hydroacoustic case, coupling between elastic waves in the solid Earth and acoustic waves in the ocean is sufficiently poorly understood that acoustic amplitudes cannot be used to quantify the size of a source located in the solid Earth.
Effects of Decoupling
One of the most challenging monitoring issues is the reduction of seismic magnitude by decoupling underground explosions in a preexisting cavity. There is a long history of experiment, calculation, and debate about the seismic magnitude effect of decoupling, and this continues to be a critical issue for the CTBT because it forms the basis for one of the more challenging evasion scenarios (e.g., see Sykes, 1996, for a review of this topic). It is widely agreed that full decoupling can achieve a seismic wave amplitude reduction up to about a factor of 70, or 1.8 magnitude units (e.g., Stevens et al., 1991). This means that in a region where a 1.0 kt fully coupled event produces a seismic magnitude of 4.3, one must be able to monitor down to a level of 2.5 with high confidence if decoupling is considered viable and seismological methods are the principal monitoring technology (see Figure 2.2). This capability would provide monitoring down to about 0.01 kt for fully coupled explosions.
If a deep underground nuclear explosion is conducted at the center of a large spherical cavity in hard rock, seismic signals are reduced by a decoupling factor of about 70 if the radius is greater than or equal to about 25 m times the cube root of the yield in kilotons (i.e., r > 25 × W1/3).
For a 1 kt explosion (~25 m), this is a size that can be excavated by dissolution mining in salt or by room-pillar mines in hard rock. In fact, much larger solution cavities have been mined in salt, which in principle could decouple explosions with yields as great as several hundred kilotons (the resulting signals would still be large enough to detect and identify), although the largest fully decoupled explosions that have been tested are less than 1 kt. No country is known to have removed the brine from such a dissolution cavity and exploded a device within one, and the distribution of large salt deposits is limited. As noted above, explosion within a fluid-filled cavity can actually enhance the magnitude, so evacuation is essential. Open-air cavities in salt are stable only at depths of about 200 to 1300 m, and the geological distribution of such open-air deposits is also quite limited (Sykes, 1996). Hard rock sites are much more widely distributed; thus, this evasion method must be considered for a number of regions. Explosions can be conducted in cavities produced by prior nuclear explosions as well (all known decoupling tests have been). The prior explosion has to be at least 20 times larger in yield than the fully decoupled event, so the locations of all such cavities relevant to a 1 kt evasion attempt are known (Sykes, 1996). Recent data suggest a smaller decoupling factor of about 10 at high frequencies of 10–20 Hz (Murphy, 1996), which may provide one way to monitor decoupled events with sparse networks. However, these higher frequencies are not likely to be observed at typical regional monitoring distances because of the effects of attenuation.
It is easier to build cavities of the same volume that are elongated rather than spherical, and apparently such aspherical cavities can achieve high decoupling factors, but they also increase the concentration of stress on the cavity and make it much more likely that radionuclides will be released into the atmosphere. An overall evaluation of the cavity decoupling scenario therefore raises several different technical issues:
-
Does a country considering an evasive test have access to a suitably remote and controllable region with appropriate geology for cavity construction?
-
Can the site be chosen to avoid seismic detection and identification (given that seismic events are reported routinely down to magnitude 2.5 by earthquake monitoring agencies for many areas in industrialized countries)? Can cavities of suitable size, shape, and depth be constructed clandestinely in the chosen region?
-
Can nuclear explosions of suitable yield be carried out secretly in sufficient number to support the development of a deployable weapon? Can radionuclides be contained?
Source Identification
The most direct means of nuclear event identification is radionuclide detection. Nuclear power-plant emissions and natural radioactivity (including that from the history of past nuclear testing) constitute the background level against which a nuclear event must be identified. Fortunately, the relative abundance of radioactive isotopes is quite characteristic of the source, and with sufficient signal levels, the type of nuclear device can be determined if measurements are made before critical radionuclides decay. This determination includes the type of fissionable material used (either uranium-235 or plutonium-239) and possibly other nuclear characteristics of the device. Determining the source location for emissions involves complicated atmospheric backtracking and possibly association with detections by other methodologies.
Nuclear event identification can also be based on distinctive features such as the double light flash of atmospheric fireballs if they are observed. For CTBT monitoring purposes, however, the identification process is largely one of determining which events are definitely not nuclear tests. For example, accurate determination that the depth of a source in a continental region is greater than 10 km ensures that it is not a human-induced event. A seismic event that is located under the ocean and lacks any hydroacoustic signature of a bubble pulse is deemed to not be a nuclear test. The extent to which the monitoring network accurately can determine critical location parameters, such as depth and offshore location, greatly impacts the number of events that must be identified based on other signal characteristics. There will inevitably be many events that are not identified by straight-forward procedures. For these events, more information must be extracted from the signals than is
required for any other monitoring procedure, with the result that high-confidence identification thresholds are intrinsically at higher levels than location thresholds. The variability in signals associated with source, path, and receiver effects places identification in a probabilistic context that ultimately involves trade-offs between the confidence levels for not missing events of interest and the estimates of tolerable numbers of mis-identified nonnuclear sources (potentially leading to costly On-Site Inspections or loss of confidence in compliance). As with other monitoring functions, event identification capabilities will vary geographically and with the medium under consideration.
The basis for identifying the type of source for a given wave disturbance (commonly called classification in the hydroacoustic community and discrimination in the seismic and infrasonic communities) involves the distinctive physical processes at the source and the associated excitation of wave energy. For example, the rapid rise times, short source durations, and singular occurrence of underwater explosions and their associated bubble pulses are quite distinctive from submarine volcanic eruptions (which tend to occur in prolonged sequences). The oceanic waveguide formed by the water column and underlying crust causes both explosions and earthquakes to generate long-duration wavetrains. Infrasonic waves excited by an atmospheric or shallow underwater nuclear blast will have frequencies quite distinctive from most longer-duration processes such as volcanic eruptions, severe weather, or meteor impacts. One of the major challenges is thus to characterize not only the wave excitation by explosions but also those of all other sources that can produce signals of size relevant to the monitoring threshold.
For regions in which past nuclear tests were recorded it is possible to estimate the statistical identification capabilities of each monitoring methodology for events in that region. This experience base is actually quite restricted, and identification capabilities established by historical testing in a particular region may not extrapolate to small explosions in the same region or to different regions. Extrapolation to small events is uncertain because the stations available for detection of suitable signals could be different from those used for larger events and distinctive propagation effects can obscure the source identification. Similarly, lateral variations in wave transmission can change the event diagnostic criteria from one region to another by amounts that are difficult to predict based on limited experience with well-calibrated regions. For many regions of the world, CTBT verification will necessarily rely on source identification procedures that are never calibrated directly by recording a nuclear explosion in those particular regions. This places great weight on establishing a fundamental understanding of why identification procedures work when they do, in order to predict their behavior in regions for which only nonnuclear events may be available to characterize the wave behavior and the use of chemical explosions as calibration events. The background levels of nonnuclear activity (natural or human) and the statistical fluctuations in background activity must also be understood to determine the confidence level for the identification of nuclear events and the associated false-alarm potential for nonnuclear events.
The rapid onset time scale and compact source dimensions of underground nuclear explosions have been noted earlier. These directly affect the spectrum of seismic wave energy radiated by the source, with explosions having weak long-period body and surface wave excitation but strong high-frequency radiation. Earthquake faulting typically involves shearing displacements across a fault surface, generating stronger S-wave radiation than P-wave radiation and longer surface waves. Explosion sources are located within the upper kilometer or so of the crust, whereas most earthquakes occur at greater depths.
The depth of the source, the spatial extent of the source, the rate at which source energy is released, and the geometry of the source process all control the relative levels and frequency content of P and S energy released into the surrounding medium (and their partitioning into body and surface waves). Resulting variations in the properties of seismic waves generated by these sources lie at the heart of seismic discrimination methods, as discussed in Appendix D. Comparison of the relative behavior of various measures of source strength tuned to different frequencies or wavetypes (e.g., mb and MS), can distinguish the different types of sources in some cases, as illustrated in Figure 2.3. The empirical trends observed in such measures establish a basis for identifying a given source type; these indirect measures must be viewed as statistical indicators.
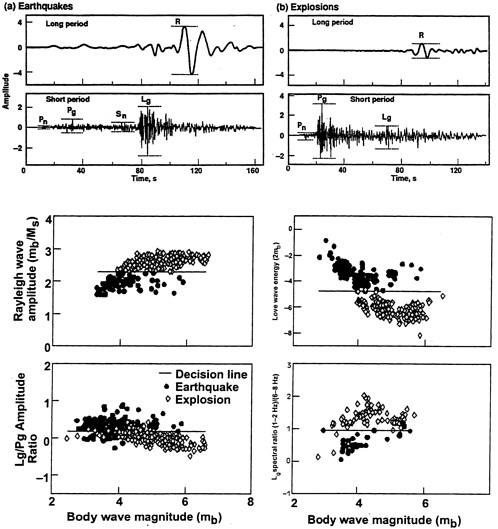
FIGURE 2.3 Top: Characteristic seismic signals for explosion and earthquake sources from long-and short-period instruments, illustrating measurements of amplitudes used for magnitude and yield estimates. Pn and Sn are regional P and S waves that travel just under the crust. Pg and Lg are regional P and S waves that propagate within the crust through multiple reflections. Bottom: Examples of seismic wave discriminants. Source: DOE, 1993.
For large events, the mb:MS comparisons made for teleseismic measurements provide one of the most robust seismic discriminants between explosions and earthquakes. As shown in Figure 2.3, the separation of source types is good for events with body wave magnitudes larger than 4.0. Past research has quantified the empirical success of this discriminant and explained it in terms of the relative excitation efficiency of short-period body wave and 20-second-period surface wave energy by shallow explosions and earthquakes. The confidence gained by achieving a theoretical understanding of this discriminant for the small number of regions with prior nuclear testing allows it to be applied globally for large events. For CTBT monitoring, in which small events are of interest, application of the traditional form of this discriminant is limited by the fact that small events do not excite 20-second-period surface waves, independent of the type of source. Thus, successful teleseismic discriminants developed for large events typically have to be modified for application to regional signals where the propagation effects and the signal frequency content may differ. Appendix D indicates that events with magnitudes down to 3 or lower may be identified based on regional discriminants analogous to the teleseismic discriminants.
In addition to extending successful teleseismic discriminants to the regional environment, the large amplitudes of regional phases can be exploited to develop new seismic discriminants. For example, as shown in Figure 2.2, ratios of regional S-wave-dominated energy to regional P-wave energy (e.g., Lg/Pg), provide some separation of explosion and earthquake observations. However, there is no separation in the magnitude range 3 to 4 in this example. The Lg/Pg ratio has been shown to improve in discriminant performance as the frequency content increases, with frequencies higher than 5 Hz leading to good separation of explosion and earthquake populations in most regions where it has been tested. Improved propagation corrections for lower-frequency signals may enhance the performance of the discriminant as well. Other measures of regional phase energy, emphasizing relative measures of shear and compressional energy or variations with frequency, hold promise for small event identification. Applications to available data sets indicate that regional adjustments in the discriminant baselines and propagation effects have to be determined, effectively involving a calibration effort analogous to that for regional travel time corrections. However, it has also been demonstrated that for reasons that are not well understood at this time, discriminants vary in their performance from region to region, with some doing well in one region of the world but failing to work in others. As a result, there is as yet no single dominant regional seismic discriminant for smaller events that performs as well as mb:MS does for larger events. In current practice, then, a suite of regionally calibrated discriminants must serve for small event identification purposes, with sequential application of the discriminant or a statistical combination of the event identification probabilities provided by the various methods being used to define the confidence level for identification for the suite.
The primary obstacles to seismic identification are an inadequate understanding of regional variations in seismic wave propagation, the large variability in signals that constitute the background noise, and the similarity in signals from nuclear and some nonnuclear sources. Although all seismic discriminants are based on empirical measurements that isolate source characteristics, substantial theory has been developed to characterize some successful methods. For monitoring areas with no direct calibration of nuclear explosion signals, one is forced to rely heavily on combined theoretical and empirical validation of the identification methodology, particularly to establish the confidence levels to be assigned to each identification.
For any discriminant measurement there will be scatter in the populations measured for explosions and for other sources. This scatter results from intrinsic measurement error and the variability of the sources (e.g., radiation pattern effects on P and S waves for earthquakes, near-source material properties, heterogeneity along the propagation path, and depth effects on wave excitation). The identification process then involves establishing for a given discriminant a decision line that separates nuclear and nonnuclear events with an acceptable balance between missing a violation and raising a false alarm (Figure 2.4). The overlap of values of the discriminant for the two populations determines the relative probabilities of missed violations and false accusations that can be achieved by the discriminant. Specific values of the two types of error
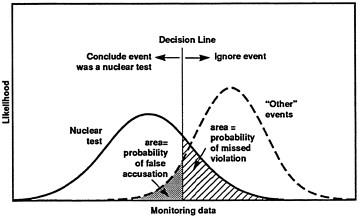
FIGURE 2.4 Schematic illustration of a monitoring decision line. Interpretation of monitoring data is based on values above or below a specified threshold. The decision line determines the probabilities of false accusations and missed violations. Source: DOE, 1993.
area associated with each choice of decision line and the ensemble of values corresponding to various choices are a description of the operating characteristics of the discriminant. Research developments that narrow the overlap of nuclear and nonnuclear distributions are a primary way of improving event identification capabilities. The setting of the decision line is influenced mainly by policy decisions regarding the acceptable tolerance for false alarms versus missed detections. Given the limited experience with applying regional seismic discriminants around the world, event identification for small underground explosions stands out as one of the primary areas for improvement of national monitoring capabilities. Associated research issues are addressed in Chapter 3.
Attribution
If a nuclear test occurs, verification ultimately requires the ability to identify the nation or organization responsible for it. Although various monitoring technologies may indicate high probability that a nuclear device has been detonated at a particular location, on-site, near on-site, or possibly remote-site detection of fission products plays the most important role in identifying the source type as nuclear or nonnuclear. Given that a nuclear explosion has been identified, attribution in the CTBT context can occur in three generic ways either alone or in combination: (1) NTM or intelligence assets identify the nation or organization associated with the explosion; (2) the identified explosion occurs at a location that can be demonstrated to be under the control of a particular nation or organization; and/or (3) analysis of the debris or artifacts from an identified event reveals characteristics that can be associated with a specific nation or organization. The first approach can take place before, during, or after an explosion. It involves sources of information that are outside the scope of this report. The second and third approaches take place after the event has been identified. Figure 2.5 illustrates the generic steps involved in these two approaches.
Attribution on the Basis of Location
In some cases, the site of an identified event may be such that the location alone is sufficient to
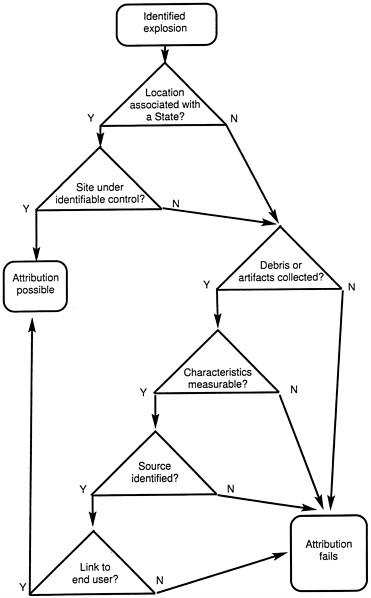
associate it with a specific nation or organization. In general, such an association would require that the accuracy of the location be sufficient to assign it to a region that was under the unequivocal control of an identifiable state or organization at the time the explosion occurred. Some examples of cases in which these conditions may not be met follow:
-
The initial location is near the boundary between two states; the uncertainty in the location is such that it could be on either side of the border; and an On-Site Inspection is unable to locate the site precisely.
-
The location is in a region whose actual control is uncertain. Remote areas accessible to multiple parties, areas in dispute, and extended maritime boundaries (e.g., 200-mile limits) are examples of this situation.
Attribution on the Basis of Debris or Artifacts
If attribution on the basis of location is not possible, it may be possible to attribute the event to a specific nation or organization on the basis of debris or artifacts. For this form of attribution to occur.
-
debris or artifacts must be recovered,
-
appropriate characteristics must be measurable from the debris or artifacts,
-
the characteristics either alone or in combination with other information must have distinguishing features that can be correlated with a specific state or organization, (this implies that a reference exists relating specific sources of material or processes to the characteristics), or
-
the sources must be tied to an end user.
Debris may be recovered in a variety of ways. In the case of an atmospheric explosion or a massive vent for a shallow underground or underwater explosion, enough material may be present in the atmosphere that remote radionuclide particulate detectors will be able to collect a sample of sufficient size. Airborne collectors, if available, could greatly enhance this process. If such venting does occur, then the near-source fallout will also be detectable by On-Site Inspections or searches at sea, if performed rapidly.
If the event is on land and has not vented, the debris would have to be acquired by drilling. This would require determination of a precise location because samples required for determination of the characteristics can be acquired only from debris located in the cavity beneath the explosion or dispersed through cracks in the underground environment. A well-contained explosion is unlikely to show significant dispersal of material or gases shortly after the explosion. The cavity material would be concentrated in a region with a radius of 10–30 m/kt (the radius of the cavity-associated with the explosion under various emplacement conditions ranging from fully coupled to fully decoupled). Samples have been recovered under controlled conditions at the U.S. test site when the source's location was known precisely and the drilling was carefully controlled. These conditions are unlikely to exist in the case of an On-Site Inspection and subsurface sample recovery will be correspondingly more difficult.
If the event is located at sea either in the water or in the atmosphere at low altitudes above the surface, it may be possible to obtain samples from the slurry deposited on the surface of the sea from venting or rain-out. Models (T. Harvey, Lawrence Livermore National Laboratory, personal communication, September 1996) indicate that airborne radiation measurements may be able to detect the presence of this slurry as late as two weeks or more after the detonation. These estimates are derived from models incorporating scenario-dependent terms for source and-slurry production, long-range dispersion, decay of the radioactive materials, and depletion of the slurry material. Recovery of the material depends on weather conditions and on having an accurate location of the test, both of which have substantial uncertainties. Once the location of the slurry is determined, samples could provide information useful for attribution. For example, if a 1 kt fission explosion occurred on a barge, slurry samples with volumes ranging from a liter to a few hundred liters would be sufficient if they were collected within a week of the detonation. If the sampling time is three weeks later, the required volumes would be larger, but not prohibitively so. The exact volume depends on the nuclide of interest, the particulars of the device (e.g., its yield and special nuclear material), and the evasion scenario.
Analysis of the fission and activation product distribution of recovered particulates may reveal
the type of special nuclear material that was used (uranium or plutonium), its preshot isotopic composition, production signatures (e.g., age and trace elements that can be related to the production methods), and/or the material is structures around the device. If the appropriate data bases are available, these observations might be related to the availability of resources and the capabilities of various nations or organizations. For example, if a radioactive signature revealed that plutonium was the fissile material used in a test, this would limit the source of the device to nations that had the ability to produce or acquire sufficient stockpiles of plutonium to conduct a test.
Even if the properties of the debris can be related to the capabilities and/or resources of a particular nation or organization, attribution of a test on the basis of debris characteristics requires examination of the entire context. For example, the testing nation may have acquired the material from another source. In this case, the source might be in violation of the treaty by encouraging or participating in the test, but it would not have been the testing party.
In principle, each of these steps in an attribution process is possible. The ability to do so will require the development of analytical processes as well as appropriate data bases.
On-Site Inspection
The CTBT provides that ''each State Party has the right to request an On-Site Inspection … in the territory or in any other place under the jurisdiction or control of any State Party, or in any area beyond the jurisdiction or control of any State." It further states: "The sole purpose of an On-Site Inspection shall be to clarify whether a nuclear weapon test explosion or any other explosion has been carried out … and, to the extent possible, to gather any facts which might assist in identifying any possible violator." The Executive Council of the CTBT organization must approve an OSI request by at least 30 affirmative votes.18
The protocol to the treaty provides that allowable techniques and equipment may include position finding; visual observation, video and still photography, and multispectral imaging, including infrared measurements; measurements of radioactivity using gamma-radiation monitoring and energy resolution analysis; environmental sampling and analysis of samples; passive seismological monitoring for aftershocks; resonance seismometry and active seismic surveys, magnetic and gravitational field mapping, and ground penetrating radar and electrical conductivity measurements; and drilling to obtain radioactive samples. Overflights are permitted "for the purposes of providing the inspection team with a general orientation of the inspection area, narrowing down and optimizing the locations for ground-based inspection and facilitating the collection of factual evidence."
The approval process and allowance for transportation and site access are such that inspection operations could begin as late as 13 days after the Executive Council receives a request from a State Party. The time elapsed from the occurrence of the event of concern to the start of the inspection could be considerably longer, depending on the internal decision-making processes of the requesting State Party. The inspection team can remain on-site through the twenty-fifth day following the Executive Council's approval of the On-Site Inspection request without further action by the council. The Executive Council may then decide if the inspection is to continue, based on the contents of a report submitted by the inspection team. If the Executive Council does not vote to terminate the inspection at that time, the inspection may continue for up to 35 more days. The inspection may be extended beyond this time by a maximum of 70 days if the team requests an extension and the Executive Council approves it.
The technologies and procedures provided for On-Site Inspections are intended to detect artifacts associated with the conduct of and diagnostics for the explosion, the radioactive evidence left from the explosion, and/or the effects of the explosion on the surrounding media. The artifacts could include any piece of equipment or other physical evidence consistent with nuclear explosion operations. In addition, evidence of recent activity in the area (e.g., roads, drill pads, drill holes, tunnels), although not conclusive evidence of a violation, can serve to focus inspection assets on specific sites. Radioactive evidence includes particulates deposited on the surface by venting, gases that
escape to the atmosphere by venting or seepage, and residual radioactive material that is trapped in the emplacement medium after the occurrence of an underground or underwater nuclear explosion.
The effects of the explosion on the surrounding material (Figure 2.6) vary depending on material properties, emplacement conditions, and size of the explosion. They range from craters and rubble in chimneys above the point of explosion, to radioactive gases and aftershocks, to effects on the gravity and magnetic fields, the water table, plant life, surface features, and the velocities and attenuation of the seismic waves propagating in the material. For a 1 kt explosion detonated underground, most of these phenomena are concentrated within about one hundred meters of the emplacement point and most are concentrated within the radius of the cavity (roughly 25 m) that would be produced by a well-coupled explosion. (Radioactive materials and gases that reach the surface may be dispersed over a larger region by local winds.)
These effects have different temporal distributions. Collapse craters, if they appear at all, usually do so within an hour but may not appear until long after the occurrence of the explosion. They and any (underground) rubble persist for hundreds or thousands of years. Radioactive materials appear in various time frames. If an underground explosion vents dynamically or the explosion is conducted in the air, gases and particulates may appear on the surface within minutes. If gases reach the surface by traveling along fractures in the rocks, they may take minutes to months to reach levels that are detectable at the surface. They may come to the surface several hundred meters from the explosion by propagating along faults. The significant noble gases have short half-lives (e.g., xenon-131m [12 days], xenon-133m [2 days], xenon-133 [5 days] and xenon-135 [9 hours]) and dissipate in the atmosphere, whereas long-lived radioactive particulates may persist in the vicinity of the explosion for years. Wind, of course, could cause widespread distribution and dilution.
Deformation of the material surrounding the explosion or alteration of its properties in the course of the emplacement might create measurable anomalies. Voids created by the explosion or by the removal of material in the creation of a cavity distort the local gravitational and magnetic fields. Displacement of material and cracking of the rock can affect the water table in the vicinity of the explosion. The displacement of the water table itself may be detectable as may the electric currents generated as the water table returns to an equilibrium state. Distortions of the gravitational and magnetic fields are long-term effects, and displacement of the water table and the return flow can persist for years. In addition, the cavity and any deformation of the material may be detectable by active seismic or electromagnetic probing. It may also be possible to excite a resonant response in the cavity by generating strong seismic signals from surface sources.
If the explosion generates an appreciable shock wave, that wave could interact with the free surface and cause a variety of mechanical (e.g., overturned rocks, cracks, landslides) and biological (e.g., disturbance of the root structure of plants and thus their ability to take up water) effects. These biological effects can persist as long as several months. Their detectability depends in part on weather conditions after the explosion.
The aftershocks that may occur following an explosion depend on many factors, including material properties in the immediate vicinity of the explosion, state of local tectonic stress, and conditions under which the explosion was fired. At one extreme, a fully decoupled explosion may not create any aftershocks or any permanent deformation around the cavity. At the other extreme, a tamped nuclear explosion in a prestressed region will damage the surrounding material and could trigger earthquakes, that relieve local tectonic stress. When aftershocks do occur, the largest ones tend to be 1 to 3 seismic magnitude units smaller than the original explosion and concentrated near the explosion's source region. Their rate of occurrence diminishes with time, and they may eventually become so infrequent as to lose their diagnostic value. For a 1 kt explosion, the estimated time to loss of utility may be as short as 14–21 days.
2.3 MONITORING INFRASTRUCTURE
To perform all of the necessary functions of Section 2.2., the signals collected from IMS sensors must be consolidated in a single data analysis system with little time delay. The concept underlying the IDC is one of continuous transmission
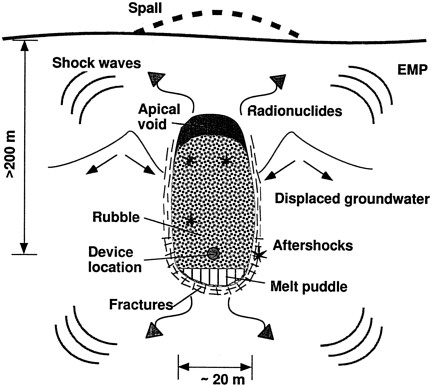
FIGURE 2.6 Near-source environmental effects of an underground explosion. Source: DOE, 1993.
of the time series signals recorded by seismic, infrasonic, and hydroacoustic stations to a single analysis center, which continuously processes the gigabytes of data collected on a daily basis to produce a list of events and event attributes that will serve international treaty monitoring activities. This involves a huge technological challenge for continuous operation of communications and automated signal processing systems, with complex fusion of results from different methodologies. Development of the prototype IDC and the associated trial run of this system during the (GSETT-3) played a key role in establishing the viability of such a global monitoring operation. This capability, largely built on the historical practices of prior seismic monitoring operations by ARPA and AFTAC, as well as operations of seismic arrays around the world, has involved extensive algorithm and computer systems development and implementation. The push for increasing automation of the data analysis has been driven both by the cost consideration of minimizing manpower and by the improved technical capabilities of each generation of computers and software. An attendant motivation is the need for timely event identification in order to initiate On-Site Inspection activities. The longer the delay, the greater are the challenges of detecting ephemeral near-source evidence of a nuclear explosion (e.g., seismic signals from aftershocks).
The U.S. CTBT monitoring effort at AFTAC has incorporated all of the capabilities of the
prototype IDC, along with additional procedures for automated event identification (which is not to be performed by the IDC). As the IMS and NTM data sources expand over the next few years, there will be continued need for augmentation of this operational system, and funding to support that activity is essential. In this report, the panel makes a distinction between this type of advanced, computer or communication system engineering development and more fundamental research. While this report emphasizes the latter, there is no question that sustained development of both the IDC and the U.S. NDC systems is required, as is allocation of resources for deployment of the actual field data collection systems. The extent to which funding is provided for these activities will strongly influence the time required for CTBT monitoring capabilities to reach the levels described in U.S. goals.


