
8
Observations
INTRODUCTION
The U.S. Global Change Research Program (USGCRP) has responsibilities to observe, document, and understand global change and to predict it to the extent possible. The USGCRP does this by concentrating on five science areas: seasonal-to-interannual variability, decadal-to-centennial variability, atmospheric chemistry and ultraviolet-B radiation, ecosystems, and human dimensions—areas described in the previous chapters. By far the largest share of USGCRP funding goes to making observations to accomplish both the aims of the science areas and those of observing and documenting global change.
This chapter constitutes the link between the scientific foundation established in Chapter 2, Chapter 3, Chapter 4, Chapter 5, Chapter 6 through Chapter 7 and the course of action now required. The scientific foundation for each of the six primary science areas—biology and biogeochemistry of ecosystems, seasonal-to-interannual climate change, decadal-to-century climate change, atmospheric chemistry, paleoclimate, and the human dimension of global change—consists of a statement of the following: scientific character of the problem, selected case studies, key unanswered scientific questions, lessons learned in the course of scientific research over the past decades, and research imperatives.
The research imperatives are central. They connect theory and observation, defining the specific observations that are required. They connect priorities and resources and science with public policy. They separate, as direct experience has shown, success and failure. Together with consideration of the lessons learned, they establish the foundation for an effective scientific analysis of the Earth system.
Several basic scientific approaches, which set observational demands, can be distinguished: testing specific hypotheses—hypotheses that seek to define mecha-
nisms, whether chemical, biological, or physical, that control the Earth system and its climate; defining the degree to which the Earth system has changed and is changing over periods of years, decades, centuries, and millennia; and (c) exploring largely uncharted regions, which may be defined geographically, mechanistically, or in other scientific terms. In the course of establishing an observational approach it is essential not to lose sight of this distinction.
There are also important distinctions in the required datasets for the different disciplines. These distinctions are the basis of fundamental “cultural” differences in the architectures selected for specific observational approaches. For example, observations are obtained in different ways to address questions about different phenomena, such as the following:
-
Ice cover changes as a function of time on seasonal-to-decadal scales.
-
Free radicals at the parts-per-trillion level in the troposphere and the stratosphere.
-
Vegetation pattern changes in terrestrial systems and oceanic systems.
-
Secular trends in atmospheric temperature with an accuracy of 0.1 K, as a function of altitude, latitude, longitude, and season.
-
Mesoscale meteorological events tied to global-scale variations such as the El Niño-Southern Oscillation (ENSO).
Observations required for each of these phenomena are not obtainable through a single solution, such as a single global network of ground-based observations or an ensemble of space-based remote sensors. While considerable intrinsic programmatic pressure exists for a “unified ” solution to Earth observations, the scientific context speaks strongly for a flexible and adaptive aggregate of techniques that attack specifics, whether of long-term trends or of mechanisms that control the Earth system.
A series of examples in Chapter 2, Chapter 3, Chapter 4, Chapter 5, Chapter 6 through Chapter 7 also represented a broad spectrum between observational constraint and theoretical speculation. The scientific method is pursued in an effective and vital manner when the fundamental design of the observational approach is matched to the calculated observables such that specific mechanisms, fundamental to the system, are tested directly. Models are very powerful when used in this context (see Chapter 10). They are central partners with observations in the course of proving or disproving fundamental assumptions.
This report approaches the problem of observations as a synthesis, working from scientific research needs to observational implementation. It has always been assumed that building a global observing system would serve the needs of most of the science components of the USGCRP. Indeed, a parallel activity is taking place (Global Climate Observing System, GCOS) to design a global observing system for climate to satisfy both scientific and monitoring needs.1 Parallel efforts are under way for the ocean (Global Ocean Observing System) and
the land surface (Global Terrestrial Observing System); the climate modules of these systems are identical to the ocean and land modules of GCOS. However, it is our impression that there is no guarantee that such an observing system, even if it could be built at this time, would (or could) satisfy research needs. By designing a multiuse observing system for research purposes and then adapting it to meet global observing and monitoring system needs, there is some assurance that both research and monitoring needs will be met in an orderly manner. The model used here depends first on satisfying the needs of the science areas of the USGCRP, transitioning those parts of the system that can be made operational and then seeing how close to a global observing system we have come.
OBSERVATIONS REQUIRED FOR THE SCIENCE ELEMENTS OF THE USGCRP
As stated, the issue of observations is approached here in a synthetic manner. Scientific research needs were examined in Chapter 2, Chapter 3, Chapter 4, Chapter 5, Chapter 6 through Chapter 7. For each element described in those chapters the observational implications of those research needs are examined. These implications are examined in this section at the level of detail representing the state of the science in each of the subject areas. Given the disciplinary breadth of the USGCRP, the requirements are quite heterogeneous in both content and method of presentation. For example, observational requirements for the Global Ocean-Atmosphere-Land Surface (GOALS) program are detailed in another National Research Council report that is in press and are only summarized here. For other elements, such as the biology and biogeochemistry of ecosystems area, arguments leading to the observational requirements are repeated here for clarity. This chapter is also limited to discussion of observational needs and not the technology to supply those needs.
Of particular interest is the degree of commonality among the observational requirements of the science elements, despite the disciplinary differences. For example, the need to observe radiatively active gases in the atmosphere is common to atmospheric chemistry, ecosystems, and decadal to centennial climate change research areas. Observations of streamflow, atmospheric and sea surface temperatures, and precipitation are emphasized across science elements. These common needs are not necessarily surprising, but they do emphasize the importance of such basic long-term measurements for the disciplines of global change.
Biology and Biogeochemistry of Ecosystems
The Research Imperatives for ecosystems research, as defined in Chapter 2, are:
-
Land surface and climate. Understand the relationships between land surface processes and weather prediction and between changing land cover and climate change.
-
Biogeochemistry. Understand the changing global biogeochemical cycles of carbon and nitrogen.
-
Multiple stresses. Understand the responses of ecosystems to multiple stresses.
-
Biodiversity. Understand the relationship between changing biological diversity and ecosystem function.
Research on global ecosystem processes motivates four broad classes of observations and experimental studies, shown below. As noted in Chapter 2, large-scale measurements in ecology tend to support all of the research imperatives above in a crosscutting fashion, with any one measurement set helping to test a variety of hypotheses. Ties of these measurement areas to the research imperatives are shown in Table 2.2. The four key measurement areas are time series observations of ecosystem state; land use and land cover change; site-based networks; and measurements of diversity, functional diversity, and ecosystem function.
Time Series Observations of Ecosystem State
Global time series of vegetation and phytoplankton state, derived from the National Oceanic and Atmospheric Administration's (NOAA) Advanced Very High Resolution Radiometer (AVHRR) and Coastal Zone Color Scanner sensors, for land and ocean, respectively, have proven their value in understanding the seasonal and spatial characteristics, interannual variability, and trends of large-scale biogeochemistry and biophysical processes.2 Space-based measurements of ecosystem state are fundamental in determining the link of terrestrial ecosystems to climate, the biogeochemistry of the land and oceans, and the impacts of climate and other disturbances. While measurements of “greenness” and ocean color are not direct ecological properties, they have proven to be highly correlated with spatiotemporal dynamics of ecosystems. Recent work3 highlights both the utility of these records and the dependence of the science on long and consistent records. Stable calibration and removal of the atmospheric signals of ozone, water vapor, and aerosols are critical to detecting ecological signals. While there is ample room for innovation in land surface remote sensing, stable calibration and correction impose stringent requirements on the sensor or sensors deployed. New instruments, while adding new capabilities, must also be “backwards compatible” to preserve time series. Atmospheric correction requires that coincident observations to quantify water, ozone, and aerosols be available for use in land surface retrieval algorithms. Spatial and temporal resolution for time series instruments are typically a compromise between sufficiently high spatial resolution to resolve ecosystem structure (0.25 to 1 km2) and swath width and data rate limitations associated with near-daily coverage. High temporal coverage is needed to ensure adequate sampling of seasonality, especially in cloudy environ-
ments. These requirements apply generally for both terrestrial and marine ecosystems; marine ecosystems add additional instrument requirements to avoid saturation by sun glint or high reflection. Data for land cover change require higher spatial but lower temporal resolution.
Land Use and Land Cover Change
Changing land use and land cover are fundamental drivers of global change and direct reflections of human activity and impacts. Land use changes have profound effects on the biogeochemistry of carbon, infrared active gases, photochemically active gases, and aerosol production (via dust and biomass burning). Land use changes also affect hydrology and erosion and, by changing surface albedo and energy exchange, can have direct effects on climate. People often create highly heterogeneous landscapes, mosaics that can encompass activities with highly divergent effects on ecological processes. The spatial arrangement of landscapes can affect exchanges of water and associated solutes and particulates in freshwater and coastal margin areas, with land cover at the land-water margins having substantial effects on water chemistry. The arrangement of landscapes also affects biological diversity, invasibility, and extinctions. Data on land cover and its change over time must thus capture the spatial scales of natural and human patterns. Space-borne sensors with resolutions from a few square meters to tens of square meters have proven to meet these needs.4 Sensors with two to seven spectral bands are adequate for land cover mapping, although new technology employing spectrometers,5 radar, or lidar has great potential. As in measuring ecosystem state, “backwards compatibility” must be preserved to continue existing time series when new technology and capability are introduced.
Site-Based Networks
In situ measurements of ecological processes tend to be highly multivariate. In terrestrial systems, understanding a measurement of CO2 flux and determining net primary productivity (NPP) require sampling multiple plant parts (leaves, wood, roots), often of several life forms (e.g., co-occurring grasses, shrubs, and trees). The plant parts are then analyzed for carbon and nitrogen. Understanding spatial variations in gradients of atmospheric CO2, 13CO2, CO18O, or O2 requires a network of measurement sites over large areas. To understand this process, leaf physiology, soil microbial processes, water fluxes, and other variables must be determined. Parallel issues arise in marine ecosystems regarding trophic dynamics and transport. At many sites, measurements are made as part of an experimental design including controls and various manipulations (e.g., of nutrients, species composition, disturbance frequency). These measurements are the essence of ecological data: the satellite and other geographic data serve to knit together disparate process studies in space and time. While there is much
interest in a common set of quantities in ecological site studies (quantities such as CO2, trace gas and water fluxes, NPP, nutrient availability, and species composition and diversity), achieving consensus on a core set of measurements, standard methods, and data formats is just beginning. No global-scale experimental design implementing such sites is in place to sample marine and terrestrial ecosystems, although such a design is proposed by the International Geosphere-Biosphere Programme (IGBP), using long baseline transects across ecological gradients. A high priority of global ecosystem science is to develop a network of appropriately sited atmospheric concentration and isotope, flux, and ecological process sites. Both the overall experimental design and the suite of measurements and methods must be decided. Minimally intrusive measurements (e.g., flux measurements) and manipulations (e.g., of CO2 concentration) must be components of such a network design.
Recent advances in hyperspectral measurements made directly and remotely have established that remote sensing of foliar chemistry will be an important element in producing large-scale spatially explicit estimates of forest ecosystem function. During the past decade, a number of studies were conducted to determine if data from the National Aeronautic and Space Administration's 10-nm spectral resolution Airborne Visible/Infrared Imaging Spectrometer (AVIRIS) could be used to make canopy nitrogen and lignin measurements. AVIRIS channels in the visible and infrared regions were correlated to field-measured foliar nitrogen and lignin.6 Estimates of canopy foliar nitrogen were used as input to the primary production model7 to determine ecosystem productivity at the Harvard Forest, in Massachusetts. At Blackhawk Island, AVIRIS-derived foliar lignin was used to determine nitrogen mineralization rates using a relationship observed by Wessman et al. (1998). These and other results suggest that direct measurement of forest canopy chemistry characteristics, based either on field measurements or via remote sensing, may provide simple, direct scalars of current forest productivity potential. In the coming decade, a space-based system will replace AVRIS, and the application of these techniques can be made at research sites globally.
Measurements of Diversity, Functional Diversity, and Ecosystem Function
The issue of diversity and species composition changes has emerged as a critical topic for global change in recent years. It is clear that the functional diversity of the Earth's biota is a first-order control over global ecosystem function, but how changes to the biota will affect global ecosystem function still is a young research topic. 8 Designing a global observing system and network of experimental studies, analogous to those described above for biogeochemical fluxes, is premature; the necessary monitoring and manipulations at global scales are currently far from obvious. But a major exploratory effort involving manipulations, studies of ecosystem function in the face of ongoing invasions, extinctions, species range shifts, and global monitoring of species diversity, invasion,
and extinction rates are all needed. These exploratory studies will lay the groundwork for a more systematic attack. The foundation for systematic study and monitoring of changing diversity and functional diversity must be laid quickly and a global research program put in place.
Key Measurements for Ecosystem Studies
Based on these considerations, the tables below present time- and space scales of critical in situ (Table 8.1) and remotely sensed (Table 8.2) measurements for terrestrial and marine ecosystem studies. These tables present examples of issues, measurements, and timescales, but they are not exhaustive.
Seasonal to Interannual Climate
Chapter 3 sets forth three broad Research Imperatives: ENSO prediction research, global monsoon research, and land surface exchanges, downscaling, and terrestrial hydrology research. These imperatives, as in other chapters, frame the observational requirements.
ENSO Prediction Research Imperative
The ENSO prediction process—predicting aspects of sea surface temperature (SST) and corollary variables—requires data to initialize the coupled models and data to evaluate the skill of the predictions. Because SST is the crucial variable to predict, weekly fields of SST at the 1° × 1° level are absolutely essential. These observations are currently provided by AVHRR, combined with in situ drifters to pin down the absolute values and gradients of SST.
The key variables for initializing the model are the state of the atmosphere and the density state of the upper ocean. The state of the atmosphere does not seem to be as critical for initialization, since the model atmospheric state rapidly adjusts to the initial SST. In any case, the state of the atmosphere is provided by the twice-daily analyses from the operational weather prediction models.
The internal state of the upper ocean can be assessed in two separate ways: directly by temperature-measuring instruments, on a line connecting a surface mooring to a bottom anchor, or indirectly by applying observed heat and momentum fluxes over the ocean component of the coupled model for a long period of time (usually exceeding 20 years). In practice, salinity is very difficult to measure and does not make a major contribution to the initial thermal state, so the direct method measures only temperature. The indirect method depends primarily on measuring the momentum fluxes with the heat fluxes parameterized, so that only the surface winds are used in the calculation.
Currently, ocean models are initialized by combining the two methods above, assimilating both the long-term history of the wind fields and the currently ob-
TABLE 8.1 Time and Space of key IN Situ Measurements for terrestrial and Marine Ecosystem Studies
|
Issue |
Measurement |
Measured or Inferred Quantities |
Temporal Resolution, Duration of Interest |
Sampling Strategy |
Technology |
|
Changes in climate forcing to ecosystems. |
Temperature, precipitation, radiation, wind speed, humidity. |
Surface climate. |
Daily to weekly, seasonal to interannual. |
Major biomes, elevation zones, climate regions, oceans. |
Automated or manned stations, data assimilation. |
|
Land surface effects on physical climate. |
Water, CO2, heat, momentum fluxes, net radiation. |
Evapotranspiration, sensible heat, albedo. |
Daily to weekly, seasonal to interannual. |
Major biomes with replication along climate gradients within biomes. |
Eddy covariance, micrometeorology. |
|
Land surface effects on global hydrological cycle and the climate system. |
Streamflow. |
Runoff, water balance, freshwater inputs to oceans. |
Daily to weekly, seasonal to interannual. |
Major biomes with replication along climate gradients within biomes. |
Gauged watersheds, major rivers. |
|
Spatial-temporal effects of climate and ocean circulation and mixing on carbon fixation. |
Water (on land), nutrients (land and sea), CO2, heat and momentum fluxes, net radiation. |
Net ecosystem exchange, carbon balance, CO2 flux-climate relationships. |
Daily to weekly, seasonal to interannual. |
Major biomes with replication along climate gradients within biomes; ocean regions. |
Eddy covariance, micrometeorology on land, short-term assays in marine and aquatic systems. |
|
Spatialt-temporal changes to the nitrogen cycle. |
Nitrogen gas emissions and deposition. |
Nitrogen inputs and losses, emission of chemically active species. |
Daily to weekly, seasonal to interannual. |
Major biomes with replication along climate gradients within biomes; ocean regions. |
Eddy covariance, eddy accumulation, chamber measurements, concentration profiles. |
|
Spatial-temporal changes to nutrients in aquatic systems. |
Streamwater nutrient and organic matter concentrations and estuarine fluxes. |
Nitrogen losses from terrestrial systems, terrestrial inputs to the oceans. |
Daily to weekly, seasonal to interannual. |
Major watersheds. |
Gauged watersheds, concentration measurements of solutes. |
|
Changes in pollution inputs to ecosystems. |
Nitrogen, sulfur, ozone deposition. |
Nitrogen, sulfur, acidity, ozone stress. |
Daily to weekly, seasonal to interannual. |
Major biomes and airsheds, ocean regions. |
Eddy covariance, eddy accumulation. |
|
Increasing CO2 effects on ecosystem processes. |
CO2 enrichment experiments. |
Response of ecosystem function and carbon storage to increasing CO. |
Daily to weekly, seasonal to interannual. |
Major biomes with replication along climate gradients in biomes. |
Open-topped chambers, free air CO2 enrichment. |
TABLE 8.2 Time- and Space Scales for Key Remotely Sensed Observations for Ecosystems Studies
|
Research Area |
Measured or Inferred Quantities |
Temporal Resolution, Duration of Interest |
Spatial Resolution and Coverage |
Technology |
|
Vegetation feedbacks to climate, |
Leaf area, light intercepted by foliage and, by inference, evapotranspiration. |
Daily to weekly, seasonal to interannual. |
0.25 to 1 km2, globally. |
Optical remote sensing, radiometry. |
|
Climate variability trends and vegetation response. |
Leaf area, light intercepted for photosynthesis and, by inference, primary productivity. |
Daily to weekly, interannual to decadal. |
0.25 to 1 km2, globally. |
Optical remote sensing, radiometry. |
|
Land cover change. |
Ecosystem type (forests, grasslands, agriculture) over time and, by inference, rates of land use change needed for calculating changes to ecosystem-atmosphere fluxes (CO2, H2O, N2O). |
Seasonal, decadal. |
1 to 100 m2, regional to global. |
Optical radiometry or spectroscopy, possibly radar or lidar in the future. |
|
Ocean color. |
Phytoplankton abundance and, by inference, marine primary productivity. |
Daily to weekly, seasonal to decadal. |
1 km2, global oceans. |
Optical radiometer. |
tained thermal state of the upper ocean, to arrive at an optimal estimate of the ocean's current thermal state. The subsurface ocean data are provided by a network of 70 moored TAO (tropical atmosphere-ocean) arrays in the tropical Pacific Ocean (providing approximately 2° of meridional resolution and 15° of longitudinal resolution) and by the ongoing XBT network. These same moorings measure winds, but, since the full TAO array has been in existence for only two years or so, historical winds must be obtained from the Comprehensive Ocean-Atmosphere Data Set, gathered from individual ship reports from volunteer observing ships.
Because the ENSO observing system described in Chapter 3 measures the quantities needed to initialize the ocean component of the predictions, it is vital that this array be continued. The ENSO observing system was designed on the basis of the scales of variability of the winds. It may turn out that either fewer or more moorings are required to optimize prediction skill.
Other quantities also prove useful for initialization:
-
Sea surface height, as measured by satellite altimetry and tide gauge stations scattered around the islands and coasts of the tropical Pacific.
-
Currents measured on the equator where geostrophy is more problematic.
-
Cloud cover and solar irradiance reaching the surface.
-
Precipitation in those areas in and surrounding the tropical Pacific (and remotely in the areas that ENSO affects) to evaluate the skill of precipitation predictions.
-
Upper-level water vapor to evaluate the effect of seasonal to interannual variability, as opposed to greenhouse feedback, of this quantity.
The overall recommendation, therefore, is to maintain global SST measurements and maintain the ENSO observing system, especially the TAO array.
Global Monsoon Research Imperative
The GOALS program has devoted much effort to defining the observational requirements for global seasonal to interannual predictions. These requirements are summarized in Table 8.3. Note that variables are listed in priority order. Not surprisingly, there is virtually complete overlap between these variables and those identified as important in pursuing the other seasonal to interannual research imperatives identified in the following section. Only the variable of land surface energy fluxes is not identified both below and in the following section.
Land Surface Exchanges, Downscaling, and Terrestrial Hydrology Research Imperatives
The primarily hydrological observational datasets needed to support research imperatives in the areas of land surface exchanges, downscaling, and terrestrial hydrology can be described as follows.
TABLE 8.3 State and External (or Forcing) Variables* That Must Be Measured for the GOALS Program
Streamflow
At the same time that the policy-making community seeks guidance and advice on interpreting the impact of global hydrological change, the basic monitoring of hydrological fluxes, through data provided by observational networks for discharge and water quality, remains fragmented at best. Developing regions of the world, by their very nature subject to the direct and immediate effects of rapid anthropogenic change, lack the infrastructure to adequately monitor the status of their water resources. Even in traditionally well-monitored regions such as the United States, there has been a substantial decline in land-based monitoring capacity.9 In addition, there has been an assault on open access to basic hydro-meteorological datasets for global change research, aided in large measure by
commercialization.10 The World Meteorological Organization's Global Runoff Data Center in Koblenz, Germany, holds information on nearly 3,000 discharge monitoring stations. However, in accordance with the wishes of the donor nations, access to this information is restricted and no transfer of the complete global dataset or substantial portions of it are possible. A recent UNESCO (United Nations Educational, Scientific, and Cultural Organization) publication and related digital data bank of approximately 1,000 discharge monitoring stations11represents the last digitized global data bank of river runoff that is freely available to the global change community (at Oak Ridge National Laboratory Data Acquisition and Archive Center). Lamentably, its last data entry is for 1991.
A set of long-term index stations should be identified, some of which should be as free from the effects of upstream regulation and diversions as possible. In the United States the logical responsible agency would be the U.S. Geological Survey (USGS). However, the funding method currently used for the USGS stream gauge network is not necessarily consistent with the needs of a climate network (e.g., only about 10 percent of USGS stations are funded from the agency's core funds; the remainder are funded cooperatively with state agencies and by other federal agencies for operational purposes). Moreover, there is a significant need for this information on a global scale, which poses a difficult operational and political challenge. This topic of in situ riverine information is important and should be addressed.
Precipitation
Station data. The United States must maintain existing long-term stations within the National Climatic Data Center (NCDC) cooperative network, particularly the subset of stations that make up the Hydroclimatic Data Network and the U.S. Historical Climate Network. Precipitation measured at first-order stations has recently undergone radical changes and considerable technical problems, making these networks even more important.
Radar precipitation data. The National Center for Environmental Prediction has recently started to archive a merged WSR88-D (Doppler radar)/gauge product (4-km resolution) that covers most of the United States. The suitability of these data for climatological purposes needs to be evaluated, and steps must be taken to ensure the security of the long-term archive of the data and to ensure that the data are freely available to the scientific community. From a more global perspective, the recent Tropical Rainfall Measurement Mission (TRMM) launch holds great promise for tropical regions.
Surface Radiation
Only a very small number of stations now operate in the continental United States that collect a full suite of surface radiation observations (the SURFRAD
network). The adequacy of this network for studies of seasonal to interannual variability should be evaluated.
Snow
Point observations. Prior to the recent National Weather Service (NWS) modernization, snow water equivalent point observations were collected across the United States at NWS stations and archived at the NCDC. Since NWS 's modernization, snow water equivalent measurements are only monitored at selected NWS forecast offices and are now considered supplementary data. This has significantly decreased data coverage.
Snow water equivalent point observations are collected primarily at Natural Resources Conservation Service Snow Telemetry sites in mountainous areas of the western United States. The suitability of these sites for long-term climate studies needs to be evaluated (the longest records from these stations date only to the mid-1980s). Snow depth measurements are collected at a few thousand NCDC cooperative stations. The feasibility of using some subset of these stations to measure snow water equivalent should be evaluated. The objective is to achieve a much more uniform spatial distribution of station-based observations.
Areal extent. The NOAA National Operational Hydrological Remote Sensing Center and the National Environmental Satellite, Data, and Information Service (among other entities) produce satellite-based snow areal extent measurements of the continental United States and the world. These products are currently used for operational purposes but could prove extremely valuable for assessing such interactions as those between the continental extent of seasonal snow cover and large-area circulation patterns. Steps should be taken to ensure that these data are climatologically useful.
Algorithms. Satellite remote sensing algorithms to estimate snow water equivalent in a manner suitable for global studies (e.g., spatial resolutions of tens of kilometers) have been improved and may be suitable for seasonal to interannual timescale studies, notwithstanding problems remaining for forested areas. These products need to be assessed and archived at (or through) the National Snow and Ice Data Center.
Wind and Humidity
Although wind and humidity data are collected at NCDC surface airways stations, many of the records are affected by station and instrument changes, and their use for climatological purposes is problematic. Nonetheless, they are critical for computing potential evapotranspiration, and they provide reference values for approaches that can lead to spatial estimates (e.g., modeling combined with atmospheric profile data or analysis fields). Thus, more attention should be given
to the climatological value of these observations. On global scales it would be extremely useful if a far richer network of wind observations, particularly over oceans, could be achieved.
Surface Air and Skin Temperature
Observations of surface air temperature are critically important to predict evapotranspiration and snow accumulation and melt. Surface air temperature measurements are routinely collected at NCDC cooperative observer stations, as well as NWS manned observing stations. Because air temperature tends to have much higher spatial correlation locally than, for instance, precipitation, maintenance of an adequate station precipitation network should assure adequacy of surface air temperature measurements, provided that these variables are coincidentally collected. Direct observations of surface (skin) temperature are much more problematic. Surface observations have generally only been collected in research projects and are difficult to interpret. Nonetheless, skin temperature is a state variable predicted by most land surface schemes (some schemes predict an effective vegetation temperature as well). Thus, these measurements might be updated also. Satellite sensors and algorithms can produce global estimates of skin temperature at time frequencies as high as daily; a ground network could play a critical role in validating and calibrating the long-term spatial records that are now being acquired. The role of Earth Observing System (EOS) PM-1 and subsequently the temperature sounding made by the National Polar-Orbiting Operational Environmental Satellite System (NPOESS) should be particularly valuable; however, there must be a consistent connection between EOS and NPOESS (and the European system of polar-orbiting platforms).
Surface Energy Fluxes
Direct observations of surface energy fluxes (latent, sensible, and ground heat flux) have been collected almost exclusively in conjunction with research programs (e.g., the First International Land Surface Climatology Project Field Experiment, the Hydrological and Atmospheric Pilot Experiment). Recent advances in instrumentation may permit routine long-term operation of eddy correlation and other systems. A commitment has been made, for example, to continue long-term operation of some of the Boreal Ecosystem-Atmosphere Study tower flux sites. The feasibility of long-term operation of surface flux sites should be assessed to represent such features as major vegetation types in the United States and perhaps globally.
Soil Moisture
Soil moisture plays a key role in partitioning net radiation into latent, sensible, and ground heat fluxes, particularly in summer. Many studies have indi-
cated the potential importance of feedbacks between soil moisture and climate, especially in the interior of the northern hemisphere continents in summer. Therefore, observation of soil moisture is of great importance, through ground- or satellite-based observing systems or both. A few networks in the continental United States collect ground-based point observations of soil moisture, including networks of the Illinois Water Survey and the Oklahoma Mesonet. While there are questions about how point observations of soil moisture can be interpreted in the context of small-scale spatial variability and about the lack of standard instruments, synoptic-scale events are well captured. With regard to remote sensing, both active and passive microwave sensors have shown potential in estimating near-surface soil moisture. Furthermore, in combination with modeling, these surface observations might be extended to greater depth. Many issues remain, and problems of soil moisture estimation from satellite sensors are themselves the subject of ongoing research. Nonetheless, the success of these efforts is critically important for seasonal to interannual prediction and should be highlighted.
Vegetation
Knowledge of seasonal and interannual variability in vegetation properties is critical to understanding links between the land surface and climate at seasonal to interannual timescales. Satellite-based estimates of vegetation properties, such as leaf area index and greenness, are now fairly widely used in numerical weather prediction models. EOS-era developments (e.g., the Moderate Resolution Imaging Spectroradiometer, MODIS) will almost certainly improve the quality of these products. Again, however, it is essential that a consistent transfer of observing be achieved as we move from NASA (morning and afternoon observations from MODIS) to NOAA and EUMETSAT (European Organization for the Exploitation of Meteorological Satellites)-provided observations. There must be sufficient stability and accuracy in the operational instruments to maintain the time series begun by MODIS, and there must be adequate instrumental overlap to ensure that the operational measurement systems are calibrated against the EOS measurements. Furthermore, a long-term global archive of seasonal variations in vegetation properties must be preserved, along with sufficient metadata to resolve questions about any effects of changes in instruments.
Decadal to Centennial Climate Change
The following Research Imperatives (Chapter 4) are required to advance most efficiently our understanding of decadal to centennial (dec-cen) climate variability and change.
-
Natural climate patterns. Improve knowledge of decade-to-century-scale natural climate patterns, their distributions in time and space, optimal
-
characterization, mechanistic controls, feedbacks, and sensitivities, including their interactions with, and responses to, anthropogenic climate change.
-
Climate system components. Address those issues whose resolution will most efficiently and significantly advance our understanding of decade-to-century-scale climate variability for specific components of the climate system.
-
Anthropogenic perturbation. Improve understanding of the long-term responses of the climate system to the anthropogenic addition of radiatively active constituents to the atmosphere and devise methods of detecting anthropogenic phenomena against the background of natural decade-to-century-scale climate variability.
-
Paleorecord. Extend the climate record back through data archeology and paleoclimate records for time series long enough to provide researchers a better database with which to analyze decade-to-century-scale patterns, specifically to achieve a better understanding of the nature and range of natural variability over these timescales.
-
Long-term observational system. Ensure the existence of a long-term observing system for a more definitive observational foundation to evaluate decade-to-century-scale variability and change. Ensure that the system includes observations of key state variables as well as external forcings.
The foundation for recent progress in ENSO research was laid by careful diagnosis of ENSO pattern variability (see Chapter 3).12 Similarly, understanding and predicting decadal-to-centennial (dec-cen) variability to a large extent depend on knowledge of climate patterns on these longer timescales. Logically, we might expect that the response of the Earth system to anthropogenic forcing would be manifested in and/or obscured by these patterns. Thus, one particular important concern is the interactions between natural variability and anthropogenic change.
For greater predictive capability it is essential to understand those processes operating in the various components of the climate system that are relevant to dec-cen variability. Because of the difficulty of directly observing phenomena of interest in dec-cen studies, in contrast to weather or seasonal to interannual studies, the importance of component process understanding is magnified.
With respect to anthropogenic perturbation, it is particularly important to closely monitor the rate and distribution of source functions of the radiatively active gases being added to the atmosphere. These external forcings, which cannot be readily predicted, can then be properly introduced and diagnosed in the predictive model studies. Such models are the primary available means for forecasting anthropogenic change and for guiding diagnostic and attribution studies and sampling efforts. It is therefore critical to adopt an incremental long-term
observing system whose characteristics and targeted variables can evolve in parallel with our rapidly improving understanding. The importance of a comprehensive long-term observing system has been endorced by several international bodies, including the World Climate Research Program (WCRP) (see Box 8.1).
Many of the issues defined here require observing systems that do not yet exist or to which no long-term commitment has yet been made. An example is the need to monitor solar irradiance: current data have come from relatively short-term satellite missions that have no operational (long-term) mandate (see the case study later in this chapter). Measurements from different missions observing simultaneously are in significant disagreement, and the magnitude of the offset is of the same order as greenhouse forcing. Addressing decadal-to-centennial solar variability, as discussed above, requires a plan for long-term calibrated solar irradiance measurements across the solar spectrum.
|
BOX 8.1 WCRP Message to the Conferences of the Parties to the United Nations Framework Convention on Climate Change and United Nations Convention to Combat Desertification “Well over 300 members of the climate research and policy communities present at the Conference on the World Climate Research Programme (WCRP) (Geneva, Switzerland, 26-28 August 1997) agreed that comprehensive observations of the climate system are critical and noted with concern the decline in conventional observation networks in some regions. This is a serious threat to continuing progress in climate research, and to detection of climate change and attribution of its causes. Without action to reverse this decline and develop the Global Climate Observation System, the ability to characterize climate change and variations over the next 25 years will be even less than during the past quarter century. In some regions, for example, drought-prone parts of Africa, climate change detection, prediction of seasonal and long term variations and reliable assessment of climate impacts could become impossible. Recognizing the obligations of the Parties to the United Nations Framework Convention on Climate Change under Article 4.1 (g) and (h) (Commitments) and Article 5 (Research and Systematic Observations), we strongly urge that, at the coming sessions of the Conference of Parties, arrangements be put in place to ensure funding and support for the essential observation networks of the Global Climate Observing System (GCOS) and its oceanographic and terrestrial counterparts [Global Ocean Observing System (GOOS) and Global Terrestrial Observing System (GTOS)], and for research involving data interpretation and analysis, as well as for retrieval and preservation of historic data in electronic form. Without such support, future assessment reports of the Intergovernmental Panel on Climate Change (IPCC), which draw heavily on WCRP research and on the observational data sets, will be significantly compromised. ” |
Finally, as previously indicated, dec-cen research is in its early stages, with new insights, findings, and directions arising rapidly. The long-term sampling strategy and optimal measurement set is evolving with these advances as well. At this stage, then, it is imperative that we begin (or in a few cases continue) consistent monitoring of the most fundamental state variables (e.g., atmospheric temperature and moisture profiles, ocean surface temperature and salinity values) and monitoring of those variables specifically relevant to climate system components to initialize (including via assimilation), force, and diagnose model components and variables.
Atmospheric Observations
The Physical System
The physical state of the atmosphere, regardless of the mechanisms influencing this state, is at the very core of what we call climate. Atmospheric temperature and moisture content, pressure, winds, and cloud cover (the main factor controlling the surface radiation balance) must all be monitored. The spatial distribution of this monitoring can be improved with time to span the globe eventually at the relevant spatial scales, but initially a concerted effort must be made to monitor those variables at current weather station locations.
As the concentration of greenhouse gases increases in the atmosphere, the atmosphere clearly must respond in some manner to accommodate the change in radiative forcing. The atmosphere may respond by warming to some degree, it may change its vertical distribution of moisture and cloud cover, or some combination of these. All of the state variables must be monitored, including their vertical distributions through the troposphere and lower stratosphere, to evaluate the nature of anthropogenic and natural changes. One of the most hotly debated topics in modern climatology is how atmospheric moisture distribution will change in response to the addition of greenhouse gases and therefore whether, or by how much, this moisture response will moderate the temperature response. Thus, it is not enough to measure temperature simply because temperature has been the initial focus of the greenhouse debate.
Atmospheric observations must be collocated with those stations established to monitor surface conditions. This need directly follows from the fact that most, if not all, dec-cen atmospheric variability and change are in response to changes in slower components of the climate system, such as land, ice, and ocean. These components represent the lower boundary of the atmosphere. In many cases, atmospheric changes strongly covary with changes at the surface. To evaluate, diagnose, and attribute dec-cen change, such covariation must be captured in a manner that facilitates analysis and evaluation of hypotheses that describe the coupled mechanisms driving and modulating long-term variability.
Process studies and related field efforts must be directed to improving our understanding and parameterization of surface-atmosphere interaction. Obviously, it is through this boundary interaction that slower-scale components communicate their influences to the atmosphere. Appropriate parameterization of these phenomena is therefore essential, since modeling efforts are the primary tool we have for forecasting future change. We also need better parameterization of clouds, including their distribution and feedback processes, because their treatment in models may prove crucial in predicting long-term climate responses to changes in radiative forcing, as well as other feedback influences associated with variability and change. These parameterizations are currently a primary limitation in existing models.
The Chemical System
The radiative effects of aerosols, direct and indirect, are poorly constrained. Cloud processes, although they occur on far shorter than decadal timescales, are a major uncertainty in predicting future radiation balances. Parameterizations need to be improved.
Carbon cycle questions require a CO2 measurement strategy that accounts for the hierarchy of scales, both temporal and spatial, inherent in ecosystem processes and their controls. Atmospheric concentration data must allow the identification and quantification of regional sources and sinks and their responses to climate fluctuations and human perturbations. This information will permit integration over regional scales of fluxes and feedback processes that can be measured, understood, and modeled on smaller spatial and temporal scales. Isotopic data allow distinguishing between oceanic and biospheric sinks on regional scales and have provided significant insight into the regional carbon balance. Ratios of O 2 to N2 in the global atmosphere provide an independent constraint on the balance between net terrestrial and oceanic sinks. The same scaling and measurement issues are almost identical for N2O and CH4, and their biogeochemical budgets can be tackled together with a measurement program suitable for CO2.
Enormous progress in assessing trace gas budgets could be achieved if a method could be developed or refined to directly measure air-sea gas exchange rates. Promising methods are air measurements with eddy correlation and/or eddy accumulation. Such measurements would eventually lead to a realistic understanding of the processes controlling the rate of gas exchange and therefore to a parameterization that could be applied with confidence worldwide. Existing climatologies of the partial pressure differences between the air and the water for many gases could then be turned into maps of gas exchange, making oceanic data into a much more compelling constraint on the atmospheric budget and closing the open boundary of surface oceanic gas budgets.
Ocean Observations
Various types of ocean observations are needed to study the dec-cen variability associated with the primary known patterns of atmospheric climate variability: periodic (decadal) temperature, salinity, oxygen, and tracer sections; velocity profile surveys and repeat sections (starting with World Ocean Circulation Experiment sections); and higher-frequency time series stations (starting with past and present weather ship stations). These measurements will allow better quantitative description of the ocean's participation in dec-cen variability, especially in light of the slowly propagating SST and subsurface anomalies that have revealed the ocean's dec-cen variability as more than stationary patterns. We must extend these surveys into southern hemisphere regions as the nature of the deccen variability begins to be revealed.
These sections and time series stations provide the baseline against which the long-term response and change of the ocean can be measured, and they provide the basic observational set from which serendipitous discoveries about the ocean's role in climate change have been realized. In addition, the time series data have been invaluable in studying the ocean's response to atmospheric forcing and its feedback to the atmosphere. These findings are of particular importance because surface layer interaction and response dictate the volume of water in direct communication with the atmosphere. Even a small change in this volume can lead to a significant change in SST, given the same magnitude of surface forcing. The time series stations are the only series available that allow appropriate development, diagnosis, and improvement of these parameterizations.
Continued satellite data are needed for global coverage of sea surface height, SST, winds, and ocean color, but for these data to be useful, corresponding ground-truth ocean observations also are needed. Particular data of interest concern the heat budget. A concerted effort is required to improve estimates of heat flux divergence and heat storage and their variabilities from subsurface ocean data, eliminating disparities between those estimates and air-sea heat exchange estimates. Various subsurface floats and moorings are particularly helpful to supplement shipboard measurements for this study.
Sea level change is another important observational challenge. The Intergovernmental Panel on Climate Change (1996) estimates that sea level in the year 2100 will be 46 to 72 cm higher than today (36 to 53 cm when the effects of sulfate aerosols are included). A range is given because each projection presumes a specific scenario for increase in greenhouse gasses. To validate these predictions, better monitoring of global sea level change and its components will be needed. The prospects for sea level monitoring are good. A global network of sea level stations (Global Sea Level Observing System) is being implemented. Land movements will be measured at some of these stations with satellite geodesy and gravimetric techniques. Satellite altimetry is another important tool coming into use to measure global sea level rise.
Cryosphere Observations
Critical cryosphere-related observations for climate patterns on decadal to centennial timescales include long-term monitoring of surface salinity along with SST, since salinity represents the dominant control on the density of seawater in high-latitude regions. Also, measurements of the sea ice fields themselves, including motion fields and ice thickness, are required to determine the freshwater transports and buoyancy fluxes associated with the ice fields. This freshwater transport has been implicated in driving major changes, even mode shifts in the global thermohaline circulation. Finally, consistent monitoring of iceberg calving and an observational system for determining ice basal melt or growth (e.g., through temperature/salinity moorings across the floating ice shelves) must be established to better determine the freshwater budget. Both field and satellite studies are needed to refine the mass budgets of the Greenland and Antarctic ice sheets. Onsite studies that have focused on ice flow, melting, and calving should be continued and extended. Water vapor flux divergence observations will help pin down the source of the ice sheets' mass. A laser altimeter on a polar-orbiting satellite is needed to augment existing radar altimetry. These satellite data will provide accurate estimates of ice sheet volume and give early warning of possible ice sheet collapse. As in the case of ice, the distribution of snow fields, including thickness and spatial extent, must be monitored. The response of snow distribution to climate change has been hypothesized as being important in surface-climate feedbacks as well as in climate change diagnostics.
Finally, the ocean-atmosphere-ice interaction, particularly the ice or snow surface energy balance (including surface albedo and ocean-ice, ice-cloud, and snow-cloud feedbacks), must be addressed through detailed process studies to improve parameterizations of these processes in climate models.
Land and Vegetation Observations
Observations of changes in land surface characteristics, including surface vegetation, are essential for research goals in both ecosystems and dec-cen climate. Observational requirements are discussed in detail in the section on ecosystems earlier in this chapter. Changes in land surface properties alter not only the distribution of surface reservoirs and the surface-atmosphere exchange of radiatively active gases but also albedo and even surface stress and evapotranspiration efficiency, and the last two both influence the hydrological cycle. This serves as an external forcing to the planet that cannot be predicted and must be introduced into the models as they occur to properly maintain the models' surface forcing conditions.
Long-term monitoring of near-surface aerosol distributions is also needed; these distributions may induce stationary changes in the surface radiation bal-
ance, which may lead to large-scale circulation moderation through stable gradient perturbations.
Hydrological Observations
Precipitation is the key hydrological variable. For most studies of dec-cen variability and its effects, global fields of precipitation over timescales of 10 to 100 years are essential. We have no such global instrumental records currently. TRMM is an important first step, but global data are needed. To relate precipitation to global boundary conditions, it is necessary to simultaneously measure SST, vegetative ground cover and soil moisture, and sea and land ice and snow. Nearly every theory of anthropogenic warming finds an increased rate of the hydrological cycle and possible alteration of atmospheric distributions of moisture and of the frequency, intensity, and distribution of rainfall (including severe rainfall events). Thus, monitoring of the surface distribution of precipitation and evaporation must begin. This monitoring includes that over the oceans, where changes in the precipitation minus evaporation balance alter the surface salinity budget, which in high latitudes has been implicated in altering the thermohaline circulation (and driving internal oscillations on dec-cen timescales in ocean models).
Atmospheric Chemistry
Four primary Research Imperatives set the observational demands for this area:
-
Secular trends in the intensity of ultraviolet radiation that the Earth receives.
-
Source molecules for climate change.
-
Secular trends in photochemical oxidants.
-
Aerosol radiative forcing and climate change.
Stratospheric Ozone and Ultraviolet Radiation Research Imperative
A central issue of atmospheric chemistry is to define and predict fluctuations and secular trends in the intensity of ultraviolet radiation that the Earth receives. Along with temporal trends in ultraviolet intensity reaching the ground, it is also imperative to address the mechanisms and processes responsible for controlling the transport, photochemical production, and catalytic loss of ozone in the global stratosphere. (The issue of tropospheric ozone is treated below.) The observational priorities in this area, therefore, are observed changes in column ozone itself, transport of chemical species, photochemical transformations, and fundamental laboratory diagnostics of molecular processes.
Define the Intensity of Ultraviolet Radiation that the Earth Receives
Priority: Observe the total column density of ozone from orbit with daily global coverage and accuracy of ±5 percent, such that an uninterrupted record is sustained. These observations must have a precision adequate to detect a trend of 1.5 percent change per decade. Observe the concentration of ozone with altitude resolution of 3 km between 10 and 25 km, such that secular trends in upper-tropospheric and lower-stratospheric ozone can be tracked with an accuracy of 3 percent per decade. From the ground, obtain observations of ultraviolet-B flux, accurate to ±2 percent and precise to ±1 percent at 30 stations worldwide, strategically placed, with 20 in the northern hemisphere, and 10 in the southern hemisphere.
Predict Fluctuations and Secular Trends in Ultraviolet Radiation
Priority: Determine, via tracer and meteorological observations, the residence time and trajectories of air parcels at different altitudes, latitudes, and seasons in the stratosphere, using tracers CO, SF6, CFC-11, N2O, N2, CO2, O3, NOy, and H2O, obtained simultaneously, with spatial resolution of 0.1 km, accuracy of ±2 percent, precision of ±1 percent, and a grid size the same as spatial resolution.
Priority: Determine the mechanisms responsible for exchange of material between the troposphere and stratosphere. Understanding of the exchange of mass and chemical constituents between the stratosphere and troposphere is essential for identifying the relevant chemical processes and relationships among chemistry, dynamics, and radiation that dominate processes in both the stratosphere and the troposphere. Significant progress has occurred in the theory of stratospheretroposphere exchange in the past several years,13 but this advance has served primarily to clarify what must be done to analyze this key transitional region scientifically and to demonstrate that further progress will depend largely on critical observations, particularly in the tropics. Such observations will require high spatial resolution (0.1 km in horizontal and vertical) simultaneous measurements of H2O resolved into its three phases and the isotopes of H2O, O3, CO2, CO, N2O, CH4, upward- and downward-looking lidar for detection of aerosols and cirrus, the upward and downward radiance in the visible and infrared at 1 cm-1 spectral resolution with the ability to scan the view direction to any angle in the plane perpendicular to the platform velocity vector, solar tracking that allows absorption measurements in the visible and infrared, upward- and downward-looking polarimetry, microwave temperature profiling above and below the platform, and simultaneous observations of meteorological fields and a complete suite of particle measurements. These observations must be focused first in the tropics, using long-duration (24- to 40-hour) trajectories that span the altitude
region from 10 to 22 km, which can lock to surfaces of constant potential temperature (constant entropy) and then to surfaces of maximum gradient in species such as CO observed in real time.
Priority: Determine the destruction rates for ozone in the stratosphere as a function of altitude, latitude, and season by observation of the rate-limiting radicals (NO2, NO, HO2, OH, CIO, BrO) and determine the response of the atmosphere to imposed changes by obtaining the derivative of each rate-limiting radical with respect to changes in nitrogen, hydrogen, chlorine, bromine, aerosol reactive surface area, water vapor, and temperature through 80 percent of the ozone column (i.e., up to 26 to 28 km). This goal requires simultaneous observations of reservoir species (HONO2, N2O2, ClONO2, HCl, H2O, BrONO2), long-lived tracers (CO2, N2O, CH4, SF6, chlorofluorocarbons [CFCs], CO), ultraviolet fluxes into the volume element observed, infrared radiance and flux, particle number, surface area and mass as a function of size, chemical composition as a function of size, and meteorological variables, including pressure, temperature, wind velocity, potential temperature, and potential vorticity. As described in Chapter 5, these observations must be obtained with a spatial resolution of 0.1 km, with simultaneous observation of tracers, reservoir species, and ultraviolet flux. It is critical to extend these observations to extreme conditions, such as the polar winter and tropical tropopause. The accuracy of these observations should be ±5 percent for radicals and ±1 percent for tracers. Grid size should be the same as spatial resolution.
Priority: Make observations of the Arctic. In the past five years the loss of ozone in the late-winter/early-spring Arctic vortex has grown rapidly worse, reaching levels of depletion approaching 30 percent in column ozone, as discussed in Chapter 3. This observed behavior is similar to that of the Antarctic in the early 1980s. Analysis of the cause of this rapid erosion requires high-resolution observations (0.1 km in the horizontal and vertical) between the altitudes of 10 and 25 km of radical and reservoir species (OH, HO2, NO, NO2 NO2, Cl, ClO, BrO, ClONO2, ClOOCl, HCl, HONO2, N2O5, H2O, O3); tracers (CO2, CO, N2O, CH4, CFCs, SF6, NOy); aerosol and particle composition, surface area, and mass as a function of size; spectrally resolved upwelling and downwelling radiation in the ultraviolet, visible, and infrared; continuous absorption measurements in the ultraviolet, visible, and infrared ranges by tracking of the Sun from the platform; and microwave temperature profiling above and below the platform. The trajectories of the experiments are critical. The platform must operate for long durations (24 to 40 hours) in regions of very cold temperatures (down to 170 K) under nighttime conditions and must follow Lagrangian trajectories through the cooling and warming cycles of the volume element on surfaces of constant potential temperature. The data analysis must be executed in real time and used to direct the aircraft trajectory.
Priority: Determine by a combination of laboratory and in situ observations the mechanisms and rates for the homogenous and heterogeneous chemical reactions and the photolysis processes that dictate the rates of chemical transformation in the stratosphere.
Greenhouse Gases Research Imperative
A dominant issue for global change is to characterize the origin, transformation, and removal of infrared active species in the atmosphere, the source molecules for climate change, requiring the following observations.
Priority: Determine the flux of CO2 from the primary systems (ocean, tropical, temperate, high-latitude terrestrial, Arctic, Antarctic, industrial, agricultural) as a function of season, with spatial resolution of 0.5 km. Grid density is a function of region. Over oceans, ice sheets, and arid regions, resolution should be 50 km in the horizontal, with monthly sampling, except for over the oceans, which should be sampled weekly. Tropical regions should be sampled at 10-km horizontal resolution monthly, except during transition seasons. Industrial regions should be sampled at 5-km horizontal resolution twice monthly. Vertical resolution should be 1 km in all regions.
Priority: Determine the concentrations of CO2, CH4 (including its carbon isotopes), O2, and tracers from ground level to the tropopause as a function of latitude, altitude, and season over each of the primary regions of the globe (oceans, jungles, industrial, agricultural, arid, polar, etc.). Measurements should be taken at 30 ground sites worldwide, with accuracy of ±0.25 percent for CO2, ±1 ppm for isotopes of CO2, and ±0.25 ppm for O2. Airborne measurements of CO2 should be taken for the tropopause, with an accuracy of ±0.5 ppm, at 1 km resolution.
Resolution of these measurements would vary from 1 km in tropical, industrial, and agricultural regions to 5 km over the oceans and arid regions to 10 km over the ice sheets. The vertical resolution required would be 0.1 km throughout, with weekly sampling.
Priority: Pursue a consistent strategy for observations of O3 from the ground to the lower stratosphere as a function of altitude, season, and characteristic region.
Required resolution of these measurements should be 0.5 km in industrial regions (weekly sampling); 1 km over agricultural regions (generally weekly but monthly during the winter); 1 km over tropical regions (weekly); 5 km over arid regions (monthly); 10 km over the ice sheets (monthly); and 50 km over the oceans (twice monthly). Vertical resolution required would be 1 km throughout. Accuracy of these measurements should be to ±5 percent and precision to ±2 percent.
Priority: Establish the distribution of H2O and, through tracers that include the isotopes of water, the mechanisms that control the distribution of H2O in the middle to upper troposphere as a function of altitude, season, and characteristic region. These observations should have a spatial resolution of 0.1 km, accuracy of ±5 percent, and precision of ±2 percent.
Horizontal grid scale should be 5 km in the tropics, 10 km in the subtropics, 50 km in the midlatitudes, and 100 km in the high latitudes. Vertical resolution should be 1 km in all regions, with weekly sampling.
Photochemical Oxidants Research Imperative
There are three types of pressing problems about the photochemistry of oxidants in the troposphere. The first is the problem of fundamental oxidation pathways. Critical unanswered questions concern the oxidation of organic compounds to stable products, the oxidation of reduced sulfur to sulfates that are central to acidity and to particle formation and growth, the oxidation of nitrogen compounds to nitrates, the direct oxidation of organisms and subsystems of organisms, and the oxidation of biomass. The second issue is the production of infrared active gases that control the Earth's climate. A significant component of this problem centers on ozone in the troposphere, but because of the coupling between chemical and dynamical time constants in this region, the problem involves other species, such as water in all its phases and isotopes, aerosols (the subject of the fourth research imperative immediately below), methane, and nitrous oxide. Still, a third problem is the control of oxidant export/import across international boundaries, that is, the coupling between regional and global scales. We address the three categories in order.
Oxidation Pathways in the Troposphere
Priority: Establish the sources, photochemical transformations, meteorological control, and deposition of trace oxidants (notably OH, NO3, O(1), Cl, O3, Br) in various regions of the troposphere (e.g., boundary layer, continental regions, industrial regions, biomass-burning regions, western tropical Pacific, Arctic).
Priority: Analyze the sources, photochemical transformations, meteorology, and deposition of the chemical species that control the relationships among volatile organic compounds (VOCs), NOx, and ozone in the major urban centers of the United States. Obtain simultaneous observations of the moderately long-lived species with a chemical lifetime between 1 hour and 1 year (NO, NO2, O3, CO, SO2, H2O2, DMS [dimethyl sulfide], HONO2, VOCs, peroxyacetylnitrate (PAN), and aerosols), short-lived species (OH, HO2, NO3, CH3O2), long-lived tracers (CH3Br, CH3CCl3, CH4, N2O, CFCs), and meteorological variables (temperature,
relative humidity, wind speed and direction), with required spatial and temporal coverage. Data on aerosol chemical composition are essential and must include particle carbon, particulate matter, sulfate, organic carbon, and elemental carbon. The requirements for spatial and temporal resolution will be specific to a given urban area because they are a sensitive function of topography and chemical composition, but diurnal data must be routinely secured as a function of altitude from the ground to above the boundary layer, with airborne platforms that are guided by real-time observations and the associated trajectory calculations defining air mass motion and residence times.
Production of Infrared Active Gases that Control Climate
Ozone is recognized to be an important component in the radiative balance of the Earth in the critical region of the tropopause.14 It is also recognized to be increasing in the upper troposphere 15 and to be strongly linked to photochemical production via hydrogen and nitrogen radicals.16 The upper troposphere is thus central to the link between the production of infrared gases and climate. From the perspective of scientific strategy, the upper troposphere is ideally suited for critical photochemical experiments because it provides an in situ laboratory with chemistry representative of the troposphere and yet is simple enough to reach closure on a range of experiments testing key hypotheses. There are several regions that should receive particular attention in the selection of trajectories. For example, the region that lies between Africa and Brazil, dominated by biomass-burning products, constitutes a profoundly different source region than the largely pristine region of the western tropical Pacific. The polluted continental regions and their wake regions in the Pacific rim are distinct from the Arctic upper troposphere. It has been clearly demonstrated that using the large dynamic range in species afforded by these regional differences, with the proper complement of tracers and careful real-time analysis of the meteorological fields, provides decisive causal links to be tested and established.
Priority: It is currently hypothesized (1) that ozone is catalytically produced in the upper troposphere via cycles involving radicals in the nitrogen and hydrogen families; (2) that NOx is supplied by organic nitrates (PAN, etc.) and converted to nitric acid on roughly the overturning timescales of the upper troposphere; and (3) that HOx is supplied by photolysis of relatively insoluble organic precursors such as acetone and methyl hydroperoxide. These hypotheses must be tested. Observations are therefore required of the short-lived and catalytically active radicals (OH, HO2, CH3O2, CH3C(O)O2, NO, NO2, and NO3); the precursor species that may also be products (H2O, acetone, CH2O, CH3OO3, PAN, CH4, and solar ultraviolet spectrally resolved); the product/reservoir species (HOOH, HONO, HONO2, HOONO2, N2O5); the sink species that are also local tracers
(CO, CO2); the lower-tropospheric tracers (ethane, propane, biomass-derived CH3Cl, C2H2, CO, CO2, soot, pollution-derived C2Cl4, CFCs, lightning-derived NOy, aircraft-derived CO2, NOy); and stratospheric tracers (N2O, CO2, NOy, SF6, CFCs, condensation nuclei).
These observations are required with a spatial resolution of 0.1 km in both vertical and horizontal dimensions, over trajectories that scan from sea level to the lower stratosphere. The observations must track specific air masses linking the source regions to the upper-tropospheric domain. This need demands supporting dynamical calculations that set the meteorological context and real-time analysis of the simultaneously obtained data to locate the boundaries of the air mass. This experimental strategy is Lagrangian but also contains an Eulerian component for vertical transections. Companion studies in the laboratory are a critical component of this research. A broad class of both homogeneous and heterogeneous molecular processes must be studied over the temperature range of 150 to 280 K in the 100-to 500-Torr pressure range.
Priority: These observations in the upper troposphere must be extended downward, first to include the midtroposphere and then to tie the analysis to the boundary layer. The observational array shares a great deal in common with that of the upper troposphere/lower stratosphere: observations of the short-lived and catalytically active radicals (OH, HO2, CH3O2, CH3C(O)O2, NO, NO2, and NO3), the precursor species that may also be products (H2O, acetone, CH2O, CH3OO3, PAN, CH4, and solar ultraviolet spectrally resolved), the product/reservoir species (HOOH, HONO, HONO2, HOONO2, N2O5), and the lower-tropospheric tracers (ethane, propane, biomass-CH 3Cl, C2H2, CO, CO2, soot, pollution-C2Cl4, CFCs, lightning-NOy, aircraft-CO2, NOy), stratospheric tracers (N2O, CO2, NOy, SF6, CFCs, condensation nuclei). These observations require a spatial resolution of 0.1 km in both the vertical and the horizontal dimensions, over trajectories that scan from sea level to the lower stratosphere.
Regional-Scale Links Across International Boundaries
International relations are increasingly entangled in disputes over the transfer of airborne pollutants across boundaries, transfers that initiate profound changes in oxidant, aerosol, acidic, and particulate deposition rates as a function of economic development, economic cycle, season, meteorological, and other conditions. These disputes are both acute and complex, involving the coupling of chemical, biological, and physical processes and demanding a high level of scientific proof under legislative or judicial scrutiny.
Priority: The high concentrations of ozone, sulfur, reactive nitrogen, VOCs, soot, PAN, and so forth are created both in focused urban regions and in more
distributed regions (metro-agro-plexes) that depend sensitively on the particular blend of industrial activity, agricultural product, moisture level, temperature, and national and local infrastructure and priorities. The observational requirements are specific for the species and the trajectories, though the specifics may vary for specific national boundaries. The canonical suite of simultaneous in situ observations obtained with 0.1-km resolution is O3, NO, NO2, OH, VOCs, HONO2, HO2, CH3OCH3, PAN, DMS, SO2, H2SO4, HCl, aerosol composition, number, size, and mass as a function of size, and tracers, specifying the region of origin of the air mass.
Aerosol Radiative Forcing and Climate Change Research Imperative
This imperative requires definition of the production and loss mechanisms, distribution, and optical properties of aerosols. Observations must be directed at processes that control aerosols from the fine scale to the global scale. Specifically, observations must clarify the following: (1) mechanisms controlling the rates of production of aerosols from those gases that are relevant to both direct and indirect forcing; (2) processes controlling the evolution of aerosols, including growth, activation to cloud drops, and wet and dry removal; (3) relations between aerosol optical depths and aerosol properties; (4) roles of specific chemical classes of aerosols, such as organics, in direct and indirect forcing; and (5) cloud-activating properties of different classes of ambient aerosols.
The character of scientific analysis in addressing the aerosol problem is critical to achieving progress because of the close but complex linking among chemical, biological, and physical processes. In particular, a critical strategy is to establish the relationship between key dependent variables (such as aerosol light scattering and absorption coefficients, number concentration of cloud condensation nuclei [CCN], etc.) and the major independent variables and then to test that functional dependence over a large dynamic range of variables. This strategy shares much in common with the approach of analyzing the structure of stratospheric ozone photochemistry, taking the form of the systematic analysis of partial derivatives linking dependent and independent variables. The explicit observation of these derivatives, or response function, provided the key evidence that overturned central tenets in ozone chemistry; it is the approach required in the field of aerosol chemistry.
This point is directly addressed in another report, Aerosol Radiative Forcing and Climate Change,17 which casts the problem in terms of carefully designed “closure experiments”—experiments in which an overdetermined set of observations is obtained, and the measured value of a dependent variable is compared with the value calculated from measured values of the independent variables. This approach requires fundamental restructuring of both the observations and the architecture of the modeling effort. The key point is that, through a sequence of these analyses comparing calculated and observed variables and their associ-
ated derivatives, the fundamental mechanisms hypothesized to control the system can be tested.
Priority: Develop closure experiments with selected temporal and spatial resolution. For example, point measurements of aerosol number concentration and chemical composition as a function of particle size can be used to calculate simultaneously observed aerosol light scattering and absorption coefficients and the number concentration of CCN; and column measurements of the vertical profile of aerosol light scattering and absorption coefficients with simultaneously observed radiative fluxes that can be tested against measurements of aerosol optical thickness of the entire column and aerosol optical properties and with radiative fluxes at the top of the atmosphere.18
Priority: Pursuit of vertical column experiments that link nadir-viewing satellite observations of spectrally resolved absolute radiance with surfaced-based, column-integrated radiation measurements and in situ observations of aerosol chemical composition as a function of size, spectrally resolved upwelling and downwelling radiance (solar and infrared), light scattering (total and hemispheric backscatter), vertical distributions of aerosol backscattering, and meteorological/ state variables as a function of altitude.19
Priority: Development of the Lagrangian approach to testing closure between dependent and independent variables, where the observing platform moves with the volume element under analysis. Specifically, the evolution of aerosols in an air mass tagged with inert chemical tracers should be tracked with defined initial conditions, boundary conditions, and reaction rates, with the dependent variables being the time-dependent chemical and microphysical properties of the aerosol particles. Obtain simultaneous in situ observations of deviations of aerosol size, surface area, and chemical composition, SO2, DMS (dimethyl sulfide), OCS (carbonyl sulfide), OH, HONO2, H2O, temperature, infrared and visible radiation field at 1 cm-1 resolution in selected trajectories that define the evolution of aerosols, from the source region to regions characterized by large and small aerosol optical depths, such as biomass burning, pristine, and industrial regions.
Priority: Obtain aerosol fields on a global basis from orbit, including the tropospheric distribution.
Priority: Map the size distribution, phase, and gas-phase environments of liquid/ solid particles in the upper troposphere and lower stratosphere, with simultaneous observations of SO2, H2SO4, DMS, OCS, OH, HONO2, NO2, NO, H2, temperature, and the radiation field, as a function of angle at 1 cm-1 resolution. These observations should be obtained in a Lagrangian reference frame.
Priority: Use multiplatform field campaigns that can effectively span the required dependent and independent variables in question, for example, the link between sources of anthropogenic SO2 and sulfate aerosol or between organic aerosols and soot from biomass burning and radiative forcing—subjects also addressed by another NRC (1996) report. The oxidation rates and conversion efficiencies of SO2 should also be observed. The necessary measurements include the following:
-
SO2 and H2SO4, nitrates, soot, organics, and trace metal concentrations.
-
Photochemically active trace species concentrations.
-
Short-timescale measurements of both sub- and supermicron nonsea salt sulfate and organics.
-
Mass size distributions of aerosol chemical species.
-
Number size distributions from 3 nm to 10 nm in diameter.
-
Dynamic factors such as entrainment rates, turbulent transport to and from the surface, and mixing depths (see NRC, 1996).
Priority: Marine sulfur chemistry is directly tied to the formation of global-scale aerosol fields. These fields in turn are tied to both planetary albedo in the lower-troposphere boundary layer and the genesis of subvisible cirrus and visible cirrus, which are critical to the trapping of thermal infrared in the middle/upper troposphere. A nested set of hypotheses constitute the foundation of our understanding of marine sulfur chemistry:
-
Climate is substantially affected by the radiation budget.
-
The radiation budget is substantially influenced by atmospheric aerosols, both directly by scattering and indirectly by the influence of condensation nuclei on cloud radiative properties.
-
Aerosols in the marine atmosphere are largely of natural origin.
-
The source of natural marine aerosol is the oxidation of reduced sulfur species.
-
DMS is the primary marine-reduced sulfur species.
-
New particle formation occurs mainly in convective outflow regions above the marine boundary layer (MBL).
-
DMS is oxidized in the marine atmosphere largely by OH, with a contribution from NO3 in high NOx environments.
-
DMS oxidation leads to SO2 with varying efficiency; SO2 in turn is oxidized to H2SO4, which can homogeneously nucleate to form new particles.
While these tenets are plausible, they must be tested to establish the foundation of marine sulfur aerosol chemistry, its coupling to climate, and thus its link to human activity. Critical observations include the following:
-
Direct spectrally resolved measurements of the flux divergence in the atmosphere, coupled with simultaneous aerosol and condensation nuclei measurements in clear air, cloudy air, and regions of cloud formation.
-
Observations of new particle formation and identification of the major regions of new particle formation.
-
Observations of reduced sulfur oxidation, including key intermediates and radical species, demonstrating quantitatively the coupling between DMS and aerosol precursors.
-
Laboratory observations of the DMS oxidation mechanism, including direct observation of key radical intermediates under the conditions of temperature, pressure, and composition covering the range found in the marine atmosphere. In addition, continued developments in observational technology are critical to advancing the understanding of atmospheric chemistry (see Box 8.2).
|
BOX 8.2 Priority: Technological Developments Developments in technology cut across the observational needs for atmospheric chemistry. Aircraft platforms are critical. Individual platforms or combinations of platforms must be capable of finding and following air masses over the timescale of the chemical processes under study (about one day). Lightweight fast-response instruments will be key components, as will fast data analysis to permit real-time decisions about flight trajectories. Observations of both radical and molecule species are essential to put limits on the rate of oxidation. The following set of species, observed in outflow regions of convecting clouds (below and above the trade inversion) in a Lagrangian experiment would permit testing of the key hypotheses that DMS oxidation leads to new particle formation: OH, HO2, NO, NO2, DMS, DMSO, SO2, H2SO4, CH3S(O2)OH, CH4, CO, HOOH, O3, H2O, CH3OOH, CH2O, CH3O2, ultraviolet spectrum, aerosol size and composition as a function of size, Lagrangian tracers, and DMS eddy flux for MBL experiments. Requirements:
|
Paleoclimate
Paleoclimate research over the past several decades has been essential in establishing the context of global changes observed during the course of the instrumental record. It has also pointed to the following research streams.
Research Imperatives
-
Global changes of the past. Document how the global climate and the Earth's environment have changed in the past and determine the factors that caused the changes. Explore how this knowledge can be applied to understand future climate and environmental change.
-
Anthropogenic influences. Document how the activities of humans have affected the global environment and climate and determine how these effects can be differentiated from natural variability. Describe what constitutes the natural environment prior to human intervention.
-
Limits of the global environment. Explore the question of what the natural limits are of the global environment and determine how changes in the boundary conditions for this natural environment are manifested.
-
Climate forcing factors and controls. Document the important forcing factors that are and will control climate change on societal timescales (season to century). Determine what the causes were of the rapid climate change events and rapid transitions in climate state.
Observational Implications
To pursue these research streams implies several directions for the observational efforts in paleoclimate research. Insights from such records as ice cores, coral bands, and tree rings have led to a number of principles related to observational stategy:
A global array of highly resolved continuous, precisely dated, multivariate paleoclimate records that sample the atmosphere, ocean, cryosphere, and land should be developed. For the identification of environmental change over the past two millennia, annual to decadal resolution will be required and for longer timescales decade-to-century-scale resolution. Continuously sampled and precisely dated records are essential. Tree ring and more recently ice core studies have set a standard of annually resolved dating that should be adhered to wherever possible. Multiproxy paleorecords should be developed wherever possible to maximize interpretations. The primary purpose of this global array should be to specify change over critical regions and during critical periods. For example, a major focus should include investigation of the frequency and extent of rapid
climate change events (millennial to ENSO range) and to identify the controls on them.
Long paleodata series (centennial to millennial scale) should be complemented by spatial arrays of shorter records (decades) to enhance record interpretations and allow differentiation of local versus regional and wider environmental signals.
Integration and detailed calibration of paleodata and observational series will be essential. This approach will allow hindcasting of the relatively short timescale observational series. With coupled instrumental/paleodata series it will be possible to specify the frequency and magnitude of variability for major atmospheric circulation systems (eg., ENSO, North Atlantic Oscillation, North Pacific Oscillation) and extreme events (e.g., droughts, floods).
Paleoclimate and observational series should be coupled with process studies to specify controls on climate behavior. Ground-based and remote observing systems afford a unique tool for studying process. Such studies should be closely integrated with existing observational sites and regions from which valuable paleodata series may be collected. Future ground-based stations and satellite observations should be planned with paleodata in mind.
A clear demonstration of the “natural state of environmental variability” is needed as a baseline for assessing the influence of anthropogenic forcing on climate change. This will require the collection and interpretation of a broad array of paleodata series that capture variability in the physical, chemical, and biological boundary conditions down to regional and in some cases locally specific areas over several timescales.
Human Activities
Social, economic, and health observations are critical to global change research. Because human activities drive and are affected by global change, accurate observation (at different timescales) and understanding of these activities provide critical inputs to various fields of physical, chemical, and biological research on global change, as well as a basis for developing the end-to-end understanding of global change processes needed to inform policy decisions.
Current Uses of Observations of Human Activity
Observations of human activity are already in use in several fields of global change research. An important example is in research on the determinants and consequences of land use and land cover change. This has been designated a core research topic by the IGBP and the International Human Dimensions Programme on Global Environmental Change and was a NASA research initiative in 1998. Most land use research teams are using satellite data to provide biophysical measures of land cover. In addition, ground-based observations of human activ-
ity from a variety of sources are being linked to satellite data. 20 For example, district-level data from the Brazilian population and agricultural censuses are being used to model the causes of deforestation, 21 and combinations of individual-, household-, and village-level longitudinal data are being joined to biophysical data at the village level to study how deforestation in Northeast Thailand is linked to household-level human activities, including migration.22 Each such research approach makes sense in the context of the region under examination and the substantive questions being addressed, but the diversity of social and economic data makes comparison and aggregation across regions difficult.
Data on agricultural inputs and management (e.g., tillage practices) are important to understanding such global change processes as carbon sequestration in soils. In the United States these data are reported at a county or state scale, so they cannot be reliably matched with spatially referenced soil and climate data in order to model the effects of agricultural practices on carbon sequestration or to examine the determinants of these agricultural practices. More spatially explicit data on the relevant human activities are collected in some European countries but are virtually nonexistent in developing countries.
Data on energy production and consumption have provided a critical input to the past decade of global change research. Detailed annual data on fossil fuel production for all of the countries of the world, developed primarily by the fossil fuel industries, are translated into carbon emissions based on measured and estimated values of energy content and carbon to energy ratios of each fuel. Uncertainty in global estimates of the total annual carbon emissions is estimated to be a few percent, while errors in year to year differences are much smaller.23
A similar key role is being played by data on the production of CFCs and nitrogen fertilizer and on nitrogen and sulfur oxide emissions in fossil fuel combustion. Many of the human source terms, however, are not well understood. Among these are carbon dioxide emissions associated with natural gas production, leakage rates of methane from the global natural gas production and distribution system, sources of methane arising from animal husbandry and rice cultivation, and sources of atmospheric nitrous oxide arising from managed ecosystems.
As the above examples and others in Chapter 7 indicate, efforts are increasing to link social, economic, and health data to biophysical data to improve understanding of the human dimensions of global change. However, a number of important observational issues must be addressed in the next decade. Some of these are similar to those in the biophysical sciences, and some are unique to human dimensions. This section focuses on those that are unique to human dimensions research, including the lack of involvement in USGCRP participation by key federal agencies, data comparability across political boundaries, georeferencing of social science data, and confidentiality issues that arise with human observations.
Observational Issues for the Next Decade
USGCRP Participation and Data on Human Activities
In the United States the lead federal agencies involved in collecting domestic social, economic, and health data are the Bureau of the Census, the Department of Education, the Labor Department, the Department of Agriculture, and various branches of the Department of Health and Human Services, such as the Centers for Disease Control and the National Institutes of Health. The U.S. Agency for International Development (USAID) has been the lead U.S. agency funding social data collection in many parts of the developing world. For all of these agencies their primary reasons for collecting social, economic, and health data do not involve issues central to global change research, nor did many of these agencies participate in the USGCRP during the first decade. This disconnect between those responsible for collecting (or funding the collection of) social, economic, and health data and those designing and maintaining global change observational facilities is present in many other countries around the world; the United States is not unique.
One result is that the vast majority of research on the human causes and consequences of global change has used social, economic, and health datasets that were not developed with global change scientific questions in mind. There are exceptions, of course, but the vast majority of scientists working on the human dimensions of global change have had to do the equivalent of repeatedly retrofitting remote sensors. There are numerous examples of scientific ingenuity involved in these efforts, and we anticipate this will continue. However, it is now time to take stock of the situation. Are the present social, economic, and health observational systems adequate for understanding the human dimensions of global change? What are the costs and benefits of bringing the federal agencies responsible for the bulk of the social, economic, and health data into the USGCRP? What human dimensions of global change research needs are not being met by current observational strategies? What is the potential for combining the collection of data on human activities and biophysical processes in the same settings, such as the NSF-funded Long-Term Ecological Research sites? In short, the time is ripe for an end to end review of the current situation and the observational needs for research on the human dimensions of global change.
Data Comparability Across Political Boundaries
Atmospheric and oceanic observational systems tend to impose a common data-gathering protocol across political boundaries, but for many reasons comparability issues often arise with social, economic, and health data. Perhaps the
most obvious is language. With few exceptions, social, economic, and health data are obtained from human beings, using verbal or written communications to convey crucial concepts. As one moves from one language to another, some concepts become easier to convey and some more difficult. If a concept is difficult to convey in a given language, the quality of data collected in that language will be reduced. This is not a matter of poor translations, although that is sometimes an issue. Rather, it is embedded in the structure and nature of language. Since global research on human activities necessarily involves crossing language boundaries (which often overlap with political boundaries), additional effort is required to ensure comparability.
Social, economic, and health data are not collected by a global agency. Rather, they are collected by countries, organizations (such as hospitals or businesses), or by local nongovernmental agencies. To ensure comparability across collecting units, there must be coordination and a willingness on the part of everyone to cooperate. Frequently, local interests and the goal of comparability diverge. In the United States, for example, the collection of such basic demographic data as births and deaths is the responsibility of states, with the National Center for Health Statistics being responsible for coordination. For a variety of state-level reasons, there is variation across states in the collection of various items on birth and death certificates.
Comparability typically increases if one organization is paying for data collection and works to ensure comparability. The experience of the World Fertility Survey (WFS) is instructive. In the 1970s, when global population growth rates were substantially higher than they are today (resulting from substantial mortality declines but lagging fertility declines), an effort was launched to collect and analyze comparable data to further understanding of the determinants of fertility levels and variation. A total of 61 countries completed fertility surveys under the direction and coordination of the International Statistical Institute. The effort was the first attempt to collect global data on such an important issue using survey approaches. Funding for this effort came primarily from USAID, which restricted its use to developing countries. Low-fertility countries were expected to pay for their own surveys, and 20 low-fertility countries participated. The effort in developing countries produced datasets that were remarkably comparable, but comparability in developed countries was inadequate. 24
The implications of the WFS experience need to be carefully considered in the context of global change research. It is now a given that better understanding is needed of the role of human agency in global change, and the word “global” needs to be emphasized. At present, relevant human dimensions data are being collected locally. Sometimes, local data are being used for local case studies; sometimes, local data are aggregated to the global scale, with various forms of imputation for those local areas not providing the relevant data. Both approaches can have problems, and it is time to systematically assess the strengths and weaknesses of the current situation.
Georeferencing Social, Economic, and Health Data
At its core, studying global change requires acknowledgment of the complexity of the global system and linking data across the various subsystems. Geographic information systems (GISs) have been providing an increasingly powerful tool for such linking.25 Coordinate systems (e.g., longitude and latitude) provide a mechanism for linking across datasets, or GIS layers, that may have been collected at different times or with different observational techniques.
Historically, obtaining precise locational information has not been a high priority for those responsible for collecting social, economic, and health data. Typically, locational data have come under the purview of those responsible for the operational aspects of data collection. For example, census takers need addresses of dwelling units in order to conduct the census. By georeferencing social, economic, and health data, such human dimensions data could be more meaningfully linked to biophysical data. For example, modifying disease statistics (e.g., those supplied by the World Health Organization or the Centers for Disease Control) to include precise observations of spatial (e.g., longitude, latitude, altitude) and temporal (month and season) parameters for geotemporal referencing would allow integration of those observations with other observations of global change. The recent debate on the implications of global warming for the spread of infectious diseases would be resolved scientifically at a quicker pace if such spatial and temporal health data were already available.
Georeferencing social, economic, and health data would involve changes in the manner in which such data are collected and distributed. Some changes might be relatively minor. An example would be releasing the exact geographic boundaries for data that refer to an administrative unit, such as a district or subdistrict. Others will be more challenging, such as knowing the geographical locations where an individual's behavior might have an impact. The human dimensions research community is at a juncture where a careful assessment of georeferencing needs and capabilities is needed. Both costs and consequences need to be assessed. One possible consequence, breaching confidentiality, is addressed below.
Confidentiality Issues in Social, Economic, and Health Data
Data collection from humans often raises issues of confidentiality that may not arise with other global change observational systems. Sometimes confidentiality is protected by law. For example, information collected from specific individuals and households in the U.S. census cannot be publicly released until there is a reasonable expectation that most or all of those who participated in the census are dead. Thus, there is public access to the manuscript forms from the 1890 census but not the 1990 census. Alternatively, sometimes confidentiality is protected by an explicit or implicit agreement between those collecting the data
and those providing the data. Either way, maintaining confidentiality is a characteristic of most social, economic, and health data systems, and without continued provision of confidentiality in human observational systems, the ability to collect human dimensions data would be severely compromised.
Confidentiality is maintained by a variety of mechanisms. One approach is to not make the data publicly available. Another is to strip away all identifying information, including georeferencing information. Yet another is to aggregate to levels sufficient to protect confidentiality beyond a reasonable doubt. Putting precise locational information into public use microdatasets would make it very easy for anyone to know the identity of specific individuals, households, or organizations. It would, in essence, provide a road map. Such activities by U.S. government data agencies would be unacceptable. Yet the scientific case for providing locational information so that human dimensions data can be linked to other global change observational systems is compelling. A careful review is needed to see if the confidentiality of individuals, households, and organizations can be protected while simultaneously advancing the scientific needs of the global research community.
Overview
The past decade has witnessed considerable scientific progress in understanding the human dimensions of global change (see Chapter 7). A major impediment to progress in understanding of the human causes and consequences of global change is the inadequacy of the observational base for the needed research. The time is now ripe for a systematic assessment of the role and needs for social, economic, and health data in global change research. Such an assessment should pay particular attention to issues of comparability, georeferencing, confidentiality, and relevance. Are current observational systems adequate and, if not, what is needed?
A MULTIPURPOSE, MULTIUSE OBSERVING SYSTEM FOR THE USGCRP: ELEMENTS OF SYSTEM DESIGN
Up to now, the observations taken for the six science areas have not been coordinated among themselves to form a single unified multiuse observing system. Nor has the path been clear from such a multiuse observing system to a permanent global monitoring system. Here, we describe the rationale and process by which an integrated multiuse observational system can be designed to serve the four science areas and explore the problems and opportunities involved in moving to the design and implementation of a permanent global observing system. We begin first with some overarching remarks that set additional constraints on or add information to the system design process.
Style of Observation
An observation can be taken for many different purposes. An exploratory observation is one taken in the spirit of exploration—no firm scientific rationale can be given for it because there are not enough data to make a scientific argument for a measurement. Such observations are very hard to come by (it is almost impossible for an investigator to propose such a measurement), yet all knowledge begins with exploratory measurements and every research program should include them. There are regions of the ocean that have never been measured, as well as parts of the upper atmosphere, and the land surface.
A critical measurement is one that tests a specific hypothesis. While common in particle physics, in which most accelerator experiments are specifically designed to test aspects of the current theory, these measurements are relatively rare in geophysics and even more rarely successful. Contradictory as it may seem, a program of observations can be hypothesis driven, even though a critical measurement may not exist.
A measurement can be made to document the secular change of some relevant climatic quantity, such as global surface temperature or upper-tropospheric humidity, for the purpose of documenting some aspect of global change and for providing the data to compare to models. Such a measurement could be critical if a prediction of such changes has been precise and unambiguous, but this rarely happens in geophysics because it is hardly possible to control the surroundings of a measurement.
Measurements can be taken as part of a forecast-analysis cycle, and these would generally be classified as an operational measurement. These measurements tend to be taken in a regular and systematic manner as input to an ongoing prediction system. While not performed (or funded) as research, such measurements can be extremely valuable since they make available to the research community observations that could (or would) not be supported through research—the upper-air observing network is a good example of this.
Some measurements are taken mainly to validate other measurements. Examples are measurements of SST from drifting buoys taken to calibrate the operational AVHRR satellite measurements of surface radiance. Because the satellite measurements are subject to cloud obscurations and are affected by aerosols in the atmosphere, which are not carefully measured, the in situ measurement of SST provides an absolute measure from which the satellites can derive global SST on a regular basis.
Some measurements are taken in a regular and systematic manner and, while serving the purpose for which they are taken, do not have the accuracy or reliability for some different purpose. An example is the upper-air network, which by itself has been incapable of documenting small temperature changes in the upper atmosphere. Increasing the accuracy or reliability of such measurements leaves
them acceptable for their original purpose while making them useful for a different purpose.
Finally, there are proxy measurements of climate, usually from remnants of organic or inorganic materials stored in isolated natural formations, preserving records of past climates. Examples are deep-sea sediment cores, coral cores, ice cores, boreholes, and materials from old packrat middens. These kinds of records require great care in application to produce a record of physical quantities—a record that is often hard to interpret because the records (may) represent a single site but are invaluable because of the window they provide to the past.
Research Observations and Operational Observations
An operational system is one that is put in place to fulfill a specific societal purpose, generally requiring the regular and systematic delivery of a product in a specified cycle that has time constraints on its delivery. The purpose of the operational system may be the most commonly recognized one—weather prediction—or it may be for security (both civilian and military), resource discovery and management, disaster discovery and management (e.g., for fires and earthquakes), or various other commercial or societal purposes (the stock market ticker is a rapid operational measurement; the decennial census is a slow one). The measurement part of the system can be sited on a single platform or facility (e.g., a satellite), an aggregation of platforms (the upper-air rawinsonde network or the oceanic mooring array), or a complex combination of both.
A research measurement is usually designed to answer a specific scientific question and is usually finite in duration. What distinguishes an operational measurement from a research measurement is the absolute operational need to deliver a measurement regularly in a given time. This requirement has a number of consequences: there must be redundancy in the system in case a link or platform fails; there must be ongoing calibration, since the observation is to be used continually as part of a system and the consequences of incorrect information are serious; and there are changes in the system only as an improvement in response to the purpose for which it is taken. There can also be less emphasis on the longer-term absolute accuracy because forecasts may be based on relative accuracy or simply not require as great an accuracy of measurement as certain scientific measurements might demand. This tension or difference in purpose can be seen in the measurement program for weather forecasting versus the issue of detecting climate change.
Nature of an Observing System
An observing system consists of an architecture composed of various observational components and the interfaces connecting them. The design of the system reflects its purpose, the resources required to fulfill that purpose, and the
resources available to implement the system. The design of the observing system is established by its users to maximize the system's utility in accomplishing the various purposes of its users. The system may be subject to various constraints, the most common being cost.
The purpose of the observing system may be unique, satisfying the needs of a single user or having the same purpose for a number of users. In the latter case (a single-purpose multiuser observing system), the design, implementation, and evaluation of the observing system proceed according to a common objective requiring cooperation among the users for funding and management but not requiring tradeoffs depending on differing objectives.
An observing system having multiple purposes is much more complex, generally requiring a cyclic design-implementation-evaluation procedure. This procedure only makes sense when the observing system is to be in place for long periods of time, so that a number of repetitions of the cycle can take place. The USGCRP has a set of scientific challenges; it has monitoring requirements with multiple-agency participation, and a research enterprise involving hundreds of university, government, and private-industry scientists—any observing system it puts into place is clearly a multipurpose, multiple-user observing system.
Design of an Observing System
The purpose of designing a system, rather than simply letting it grow haphazardly, is to optimize its utility among the users and minimize its cost—most likely some combination of the two. The complexity of the design increases as the objectives and number of users increase. Without such a design, it is likely that large amounts of money will be invested in taking observations, with no guarantee that the research objectives of the USGCRP are fulfilled or that the community of users feels satisfied in having their needs respected. The observing system needed to satisfy the stated aim of the USGCRP for monitoring is an even more difficult problem because the timescale of monitoring is effectively infinite: the monitoring system is to be considered a permanent observing system. To optimize the scientific utility of the observations needed by the many participants in the USGCRP, a rational process should be undertaken—the system design of a multiuser, multipurpose observing system.
A central aim in the design process is to achieve “maximum” scientific utility, subject to the inevitable constraints of funding, while being responsive to other demands for observations. The penalties for failing to design such a system are the loss of public trust; excessive costs and fragmentation of the observations that are taken; loss of vision of the scientific enterprise seeking to solve deeply interrelated problems; and, ultimately, scientific opportunities missed by the lack of cooperation among the different science areas. If there is one thing that a system design does ensure it is cooperation: every stage of a system design requires cooperation among scientists, engineers, and funding agencies.
The elements of a system design process are as follows:
-
Determine the quantities needed based on the scientific research objectives of the USGCRP. The quantities to be measured for the science areas of the USGCRP must be identified, and the accuracies to which they must be measured must be stated in terms of the scientific questions and objectives. A specific scientific rationale must be given for each measurement proposed, so that the scientific importance of the measurements can be recognized. All of the scientific users must be represented in this process and their needs evaluated on the basis of scientific priorities alone.
-
Conduct a system engineering design study based on the scientific requirements of all users. The possible instruments, platforms, strategies, and architectures for the system should be identified and the commonalties and conflicts among the users analyzed, using a consistent set of scientific criteria based on the scientific rationale presented by the users. The engineering design must take into account the possibilities of improved or lower-cost instruments and platforms over the lifetime of the observing system. The final design must ensure that the totality of the observations does indeed respond to the totality of the scientific needs.
-
Develop an implementation process and priorities based on the engineering design and the practicalities imposed. Once the engineering design is completed, the next step is beginning a consistent implementation process, consisting of the assignment and acceptance of responsibilities for the different parts of the system, a set of priorities by which the different parties can make implementation decisions, a set of incentives and disincentives for encouraging successful performance and punishing poor performance, and a management or coordination structure whereby the entire process is kept moving and decisions can be made. The implementation process is subject to practical constraints. Practicalities can be imposed externally (funding, infrastructure) or internally (lack of vision, aversion to cooperation), but only players not subject to internal constraints should be players in the implementation process.
-
Appraise how well the implemented system meets scientific objectives in its actual performance. A set of performance measures and evaluation criteria should be decided on in advance. Evaluation of the observing system must be carried out with reference to how the actual observing system as deployed meets the objectives of the science areas, subject to the practical constraints imposed on the system.
Changes should be considered in the implemented observing system reluctantly and only under well-defined circumstances. The reasons for changing a research observing system are that the original system is not meeting its design
criteria, that newer and better technologies make some components obsolete, that scientific problems get solved to such an extent that the full suite of measurements originally proposed is no longer needed, or that new opportunities present themselves.
CASE STUDIES
Some perspective on the nature of multiuse observing systems can be gained by examination of the history of monitoring several crucial global change variables. While there have been some notable successes in long-term monitoring, such as the flask sampling network for CO 2 and other greenhouse gases, there are also examples of disappointing results in trying to obtain long-term consistent climate records. Two cases are examined here—that of the monitoring of solar output by satellite and that of recording cloudiness over the United States.
Solar Output
The ultimate source of energy for the entire climate system is the output of energy from the Sun. While the mean solar irradiance at the position of the Earth is about 1,367 W/m2, the output of the Sun is variable over both long and short timescales. Much of the short-term variability is in the ultraviolet and is strongly absorbed by ozone in the stratosphere. This directly affects the temperature of the stratosphere, which in turn affects the rates of the chemical reactions that determine the concentration of ozone. Other parts of the spectrum are absorbed lower in the atmosphere by clouds, aerosols (both sulfate and carbonaceous), water vapor, and other minor constituents. Because the variability of these constituents affects the solar beam as it traverses the atmosphere, only by measuring the solar constant at the top of the atmosphere can the solar beam 's true variability be known.
On longer timescales—say, over an 11-year sunspot cycle—the variability in the solar constant is on the order of 1 W/m2. On still longer timescales, the variability in the solar constant can be as large as 4 to 5 W/m2, as gauged by comparison to other Sun-like stars, which translates to less than 1 W/m2 at the top of the atmosphere (irradiance must be multiplied by albedo and divided by four, since the area of the Earth is one-quarter the intercepted disc). The effect of such variability on the Earth's climate is not completely known, but if the sensitivity to radiative variations at the tropopause is 1.5 to 4.5 K for a 4 W/m2 change (corresponding to a doubling of CO2), variations on the order of a few tenths of a degree of global temperature can be forced by solar output variations on decadal timescales. Because globally averaged temperature is of this order, one cannot exclude the possibility that solar variability is the cause of decadal climate variations. Precise long-term measurement of the solar constant, accurate to 1 W/m2 or less, is essential for testing this hypothesis. The case for accurate long-term measurements of the solar output is overwhelming and has been argued for by the
USGCRP and by every major intemational climate program. For example, an NRC panel26 recently gave as its prime recommendation: “Monitor the total and spectral solar irradiance from an uninterrupted, overlapping series of spacecraft radiometers employing in-flight sensitivity tracking.”
In commenting on this recommendation, the report provided the following illuminating discussion:
This primary recommendation is particularly challenging and probably will not be achieved because of the dearth of access to space. A series of small spacecraft dedicated to solar monitoring could provide the necessary data. Overlapping observations are required to cross-calibrate measurements by different instruments whose inaccuracies typically exceed the true solar variability. Simultaneous observations from different instruments provide important validation that real variability, rather than instrumental degradation, is being measured and provide the redundancy needed to preserve the database in the case of instrument failure. Improved radiometric long-term precision and calibration accuracies would contribute to a more reliable solar forcing record. In lieu of spacecraft dedicated to solar monitoring, it may be possible to use NOAA or Defense Meteorlogical Satellite Program (DMSP) operational satellites, for which overlapping is a feature of the design.27
Figure 8.1 shows the current state of long-term measurements of the solar constant by satellite. Clearly, the measurement error between satellite instruments is far greater than what is needed. Commitments simply have not been made to the continuity and calibration of a series of measurements that scientists deem essential to understanding of long-term climate change.
Long-Term Variations and Changes of Clouds in the United States
Few elements of the atmosphere are more fundamental to understanding climate and its impacts on ecosystems and human systems than cloud amount and height. The specification of cloud cover is one of the most sensitive parameters in general circulation models, which are used to study climate. The legacy of measuring and reporting cloud frequency and height during the twentieth century is inconsistent with the importance of this fundamental element of the climate system.
Prior to the advent of commercial aviation, cloud amount was reported at least twice daily at several hundred NWS offices throughout the country. In these reports, observers were instructed to summarize the state of cloud amount during the night (sunrise observations) or the day (sunset observations). Most of the stations also had a sunshine switch that measured the amount of direct sunshine,28 enabling scientists to detect any systematic biases between the two measurements. The advent of commercial aviation, however, required observers to ob-
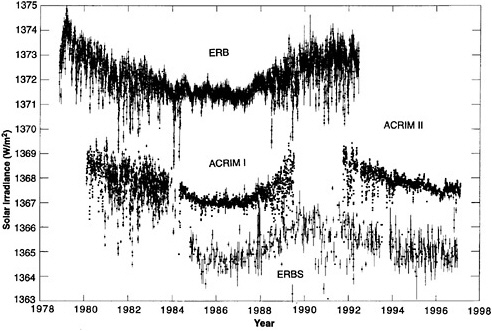
FIGURE 8.1 Total solar irradiance measurements, 1978 to 1996. Daily mean values and uncertainties shown for the Earth Radiation Budget (ERB), Earth Radiation Budget Satellite (ERBS), and Active Cavity Radiometer Irradiance Monitor (ACRIM) I and II experiments. SOURCE: Willson (1997). Courtesy of the American Association for the Advancement of Science.
serve cloud amount, type, and height of cloud bases each hour of the day. It is shown that during this transition more clouds were observed relative to the sunshine instrument,29 suggesting that observers noted more clouds when they were required to search the skies each hour, compared with summarizing cloud amount during the previous 12 hours. Simultaneous with the hourly reports, the observers often moved from city offices to airport locations. At some locations a city office remained open, enabling cross-comparisons of cloud reports. During the time of rapid transition of stations to airport locations, a new sunshine recorder was introduced, with substantially different characteristics than the previous instrument, 30 thereby making it more difficult to quantify the effect of station relocations and changes in observing procedures.
At the outset of the USGCRP, another major change in cloud observing occurred. Automated lidar measurements were replacing human observers. These automated measurements were unable to detect clouds above 12,000 feet, which introduced a major discontinuity in the cloud observing network. A potential solution was to use geostationary satellites to detect clouds above 12,000 feet. Although methods were developed to identify broad categories of cloud amount—
such as clear, scattered, broken, and overcast—these categories were much broader than those typically reported by human observers. Moreover, the combination of automated lidar reports and geostationary satellite estimates indicated fewer overcast and more clear conditions compared with human observers. This result may have been overcome with appropriate transfer functions, but the cloud algorithm from the geostationary methods depended on an NWS “first guess” field of their operational model. A major change in this model produced still another bias in the record.
At this time, there is no suitable replacement for human observations of cloud amount at the several hundred sites across North America that had been reporting cloud amount and height for many decades. In response, the NWS has made an effort to continue both manual and automated cloud measurements at a selected number of stations for an indefinite period. Unfortunately, these cloud reports appear in a supplementary coded field message and are often missing.
Conclusions from Case Studies
As the above case studies demonstrate, there are a number of instances in which observing systems have faltered in delivering a consistent and calibrated record of global change. There are also some indications that many of the same problems may continue to appear in both ground-based and satellite observations relied on by virtually all of the science elements. For example, support for NOAA's Cooperative Observing Network, which is the basis for many of the longest surface temperature and precipitation records, continues to be a matter of concern. It also appears increasingly likely, based on current plans, that there will be a substantial gap between the end of the EOS PM-1 mission and the launch of the NPOESS. Such a gap would lead to data omissions and offsets in many of the data streams important for global change.
TOWARD A PERMANENT OBSERVING SYSTEM
Clearly, the USGCRP has the responsibility to observe, document, understand, and predict, to the extent possible, future changes in the global environment. The demonstration of, for example, secular trends in the Earth's climate requires analysis at the forefront of science and statistical analysis. Model predictions have been available for decades, but a clear demonstration of the validity of such predictions—a demonstration that would convince a reasonable critic on cross-examination—is not yet available. This lack is not in itself either a statement of failure or a significant surprise. It is, however, a measure of the intellectual depth of the problem and the need for carefully orchestrated long-term observations. The requirements for accuracy, continuity, calibration, in-flight standards, documentation, and technological innovation of long-term trend analysis are elsewhere described31 and are endorsed by this report. See Box 8.3 for a summary of
|
BOX 8.3 Many of the observational issues raised in this chapter follow recommendations made over a number of years by other NRC reports. Below are some examples:
|
|
observational issues raised over a number of years in other NRC reports. While a complete discussion of observing selected variables is given in a collection of papers,32 we extract 10 principles that have emerged to provide the guiding considerations that underlie the USGCRP's responsibility for observing, documenting, and understanding global climate change.
Principles of Long-Term Climate Monitoring
-
The effects on the climate record of changes in instruments, observing practices, observation locations, sampling rates, and so forth must be known prior to implementing the changes. This information can be ascertained through a period of overlapping measurements between old and new observing systems or sometimes by comparing the old and new observing systems with a reference standard. Site stability for in situ measurements, in terms of both physical location and changes in the nearby environment, should also be a key criterion in site selection. Thus, many synoptic network stations, primarily used in weather forecasting
-
but that provide valuable climate data, together with all dedicated climatological stations intended to be operational for extended periods, must be subject to such a policy.
-
The processing algorithms and changes in these algorithms must be well documented. Documentation of these changes should be carried along with the data throughout the data-archiving process.
-
Knowledge of instrument, station, and/or platform history is essential for data interpretation and use. Changes in instrument sampling time, local environmental conditions for in situ measurements, and any other factors pertinent to the interpretation of observations and measurements should be recorded as a mandatory part of the observing routine and archived with the original data.
-
In situ and other observations with a long uninterrupted record should be maintained. Every effort should be applied to protect the datasets that have provided long-term homogeneous observations. “Long term” with regard to space-based measurements is measured in decades, but for more conventional measurements long term may be a century or more. Each element of the observation system should develop a list of prioritized sites or observations based on their contribution to long-term monitoring.
-
Calibration, validation, and maintenance facilities are a critical requirement for long-term climatic datasets. Climate record homogeneity must be routinely assessed, and corrective action must become part of the archived record.
-
Wherever feasible, some level of “low technology” backup to “high-technology” observing systems should be developed to safeguard against unexpected operational failures.
-
Data-poor regions, those variables and regions that are sensitive to change, and key measurements with inadequate spatial and temporal resolution should be given the highest priority in the design and implementation of new climate observing systems.
-
Network designers and instrument engineers must be provided with long-term climate requirements at the outset of network design. This step is particularly important because most observing systems have been designed for purposes other than long-term climate monitoring. Instruments must have adequate accuracy, with biases small enough to document climate variations and changes.
-
Much of the development of new observational capabilities, as well as much of the evidence supporting the value of those observations, stems from research-oriented needs or programs. The lack of stable long-term commitment to these observations and the lack of a clear transition plan from research to operations are two frequent limitations in the development of adequate long-term monitoring capabilities. The difficulties of
-
securing a long-term commitment must be overcome if the climate observing system is to be improved in a timely manner with minimum interruption.
-
Data management systems that facilitate access, use, and interpretation are essential. Mechanisms that facilitate user access (directories, catalogs, browse capabilities, availability of metadata on station histories, algorithm accessibility and documentation, etc.) and quality control should guide data management. International cooperation is critical for successful management of data used to monitor long-term climate change and variability.
The remainder of this section concentrates on the transition from a research-focused observing system to a permanent operational component within the observing system of the USGCRP for global environmental monitoring. This transition is an essential objective for the next decade of the USGCRP.a Some of the considerations below are relevant to all observing systems, whether space based or in situ, and are independent of platform. However, there is a particular challenge—the transition from the NASA polar platform series to the NOAA NPOESS series—that raises certain unique challenges that must be recognized.
The Essential Transition: From Research to Long-Term Monitoring
A monitoring system is needed to detect secular change in the global environment. Even for research purposes alone, the system must be in place long enough to see a few cycles of the changes. For the dec-cen and biogeochemical components of the USGCRP, this implies an observational system with a very long lifetime. Moreover, from an operational point of view of tracking changes in the environmental state of our planet, a system is needed essentially for the duration of the perturbations and responses. Obviously, such a multipurpose monitoring system would fulfill important research needs; however, its cost is likely to be significant, particularly when integral costs are considered and not just annual costs. Therefore, it must satisfy operational purposes if it is to be sustained. An essential shift is needed within the federal government: the federal government must recognize that monitoring the changes in the global environment on significantly longer timescales than demanded by operational meteorology is in the forefront of the national interest.
For an observing system to be permanent, then, it must have some operational requirement. While in theory it is conceivable that some agency will adopt the rigors of accepting climate monitoring as an operational requirement, in
|
a |
The ENSO observing system, an oceanographic array for initializing predictions of aspects of ENSO, is undergoing this transition from research to operations now. The process is described in detail in NRC (1994b). |
practice the monitoring of climate variability is not currently an operational requirement of the USGCRP nor is there an agency of the U.S. government that accepts climate monitoring as an operational requirement and is committed to it as a goal. The current designs for a global observing system by the GCOS and the Global Ocean Observing System33 seem unattainable in practice because of the lack of such an operational mandate for any existing agency or the USGCRP.
The prospects for a permanent observing system therefore seem to rest on three possibilities:
-
The USGCRP accepts environmental global change-focused monitoring as an operational necessity and makes the institutional changes needed to enforce the discipline that operational requirements demand.
-
A new coordinating mechanism is created that has operational climate monitoring as a founding requirement.
-
The permanent observing system is built using a quite different paradigm —that of coherence and evolution.
This paradigm sees individual components of the observing system growing out of research but being shifted into operations, each for its own purpose. As the system evolves, different parts of it may be operationalized for entirely different reasons. Thus, some parts of the ocean may be monitored for seasonal to interannual prediction, some for fish management, some for fish detection, some for pollution detection, and so on. The evolution process may take many years and only at some time in the future will it be appropriate to see what capabilities it has and what incremental measurements are needed to go from a congeries of individual measurements to an ocean observing system.
One of the difficulties in implementing the new paradigm is the necessity of converting research funding to operational funding. A research program can maintain a permanent observing system only when the system is relatively cheap and does not inhibit other research objectives. When there is an operational need for a system, funding must not come from research sources, else the building of a permanent observing system could gradually impoverish the research enterprise.
The paradigm still requires an institutional commitment to coordinate the various elements into the ultimate observing system, but it postpones the need for coordinated funding and thus allows (but does not guarantee) the coordination to evolve over the many years that would undoubtedly be required for this to occur. If we evolve the needed observational system as recommended, a system design study still will be needed.b There is a danger that without careful planning the system might contain a collection of instruments that do not together yield an adequate observing system to the scientific challenges, particularly those on the
|
b |
See again the section on a multipurpose, multiuse observing system. |
longer-term issues like ecosystems and climate from decades to centuries. A system design will give at least one measure of what is needed and, importantly, what is not.
A key issue that initializes both the system design and beginning the evolution process is the current and forthcoming satellite research missions: the EOS AM-1 and EOS PM-1 NASA polar platforms, the Advanced Earth Observing Satellite platforms from Japan, and the current ERS-1, ERS-2, and the future ENVISAT polar platforms from Europe as well as several more specialized research missions (e.g., TOPEX-Poseidon [Ocean Topography Experiment], TRMM, and the future Earth System Science Pathfinders). Another force on the process is the convergence discussions in which NOAA and the U.S. Department of Defense (DoD) (the Air Force) are converging the current Television and Infrared Observation Satellite (TIROS) and Defense Meteorological Satellite Program (DMSP) systems, respectively, in which they will go from a four platform system in sun-synchronous orbits (equatorial crossings at early morning, midmorning, and two in the afternoon) to a two-platform system (an early morning and an afternoon equatorial crossing). This is the planned NPOESS. Taking over the important midmorning slot will be the European Organization for the Exploitation of Meteorological Satellites (EUMETSAT) with its meteorological operational (METOP) polar platform.
There are several difficulties in going from the research missions to the operational missions.
-
The current phasing of the EOS AM-1 and EOS PM-1 and the NPOESS schedule produces a potentially significant observational gap. This gap is currently increasing because of the longevity and reliability of the current assets (e.g., the TIROS and DMSP systems on orbit and in construction). What is to be done to appropriately fill the gap is not clear.
-
The linkage between EOS AM-1 and the METOP midmorning platform of EUMETSAT is even murkier than that between NASA and the U.S. operational satellite agencies (NOAA and DOD).
It is crucial for global change research and monitoring that future operational satellites should, to the extent practical, have the qualities necessary for global change science identified in this report. To resolve these difficulties and move onto a course that is sustainable and meets the long-term observational challenge posed by global change will require political courage and strong and continued leadership by all parties. It will not be easy; it is, however, essential.
NOTES
1. Karl et al. (1995a).
2. Sellers et al. (1997), Fung et al. (1987), Myneni et al. (1997), Potter et al. (1993), Randerson et al. (1997), Braswell et al. (1997).
3. Braswell et al. (1997), Myneni et al. (1997).
4. Skole and Tucker (1993).
5. Wessman et al. (1998).
6. Martin and Aber (1997).
7. Aber and Federer (1991).
8. Vitousek et al. (1997), Braswell et al. (1997).
9. Wahl et al. (1995).
10. Kanciruk (1997).
11. Vörösmarty et al. (1996).
12. Rasmussen and Carpenter (1982).
13. E.g., Holton et al. (1995).
14. See Intergovernmental Panel on Climate Change (1995).
15. See Logan (1994).
16. See Wennberg et al. (1998).
17. National Research Council (1996).
18. Ibid.
19. Ibid., Russell et al. (1994).
20. National Research Council (1998b).
21. Wood and Skole (1998).
22. Entwistle et al. (1998).
23. Marland and Boden (1997).
24. Cleland and Scott (1987).
25. National Research Council (1997).
26. National Research Council (1994a).
27. Ibid.
28. Karl and Steurer (1990).
29. Ibid.
30. Quinlan (1985).
31. Karl et al. (1995a).
32. Karl et al. (1995b).
33. Ibid.
REFERENCES AND BIBLIOGRAPHY
Aber, J.D., and C.A. Federer. 1991. A generalized, lumped-parameter model of photosynthesis, evapotranspiration and net primary production in temperate and boreal forest ecosystems . Oecologia 92:463-474.
Braswell, B.H., D.S. Schimel, E. Linder, and B. Moore III. 1997. The response of global terrestrial ecosystems to interannual temperature variability. Science 278:870-872.
Cleland, J., and C. Scott. 1987. The World Fertility Survey: An Assessment.Oxford University Press, Oxford, U.K.
Entwistle, B., S.J. Walsh, R.R. Rindfuss, and A. Chamratrithirong. 1998. Land-use/land-cover and population dynamics, Nang Rong, Thailand. In People and Pixels: Linking Remote Sensing and Social Science, D. Liverman et al., eds. National Academy Press, Washington, D.C.
Fung, I.Y., C.J. Tucker, and K.C. Prentice. 1987. Application of advanced very high resolution radiometer vegetation index to study atmosphere-biosphere exchange of CO2. Journal of Geophysical Research92(D3):2999-3015.
Holton, J.R., P.H. Haynes, M.E. McIntyre, A.R. Douglass, R.B. Rood, and L. Pfister. 1995. Stratosphere-troposphere exchange. Reviews of Geophysics33(4):403-439.
Intergovernmental Panel on Climate Change (IPCC). 1996. Climate Change. 1995. The Science of Climate Change.Contribution of Working Group 1 to the Second Assessment Report of the Intergovernmental Panel on Climate Change,J.T. Houghton, L.G. Meira Filho, B.A. Callander, N. Harris, A. Kattenberg, and K. Maskell, eds. Cambridge University Press, Cambridge, U.K.
Kanciruk, P. 1997. Pricing policy for federal research data. Bulletin of the American Meteorological Society78:691-692.
Karl, T.R., and P.M. Steurer. 1990. Increased cloudiness in the United States during the first half of the twentieth century: Fact or fiction? Geophysical Research Letters17:1925-1928.
Karl, T.R., F. Bretherton, W. Easterling, C. Miller, and K. Trenberth. 1995a. Long-term climate monitoring by the Global Climate Observing System (GCOS). Climatic Change 31:135-147.
Karl, T.R., V.E. Derr, D.R. Easterling, C.K. Folland, D.J. Hofmann, S. Levitus, N. Nicholls, D.E. Parker, and G.W. Withee. 1995b. Critical issues for long-term climate monitoring. Climatic Change 31:185-221.
Logan, J.A. 1994. Trends in the vertical distribution of ozone: An analysis of ozonesonde data. Journal of Geophysical Research99:25553-25585.
Marland, G., and T. Boden. 1997. Global Annual Carbon Dioxide Emissions from Fossil-Fuel Burning and Cement Production: 1950-1995.Carbon Dioxide Information Analysis Center, Environmental Sciences Division, Oak Ridge National Laboratory, Oak Ridge, Tenn.
Martin, M.E. and J.D. Aber. 1997. Estimation of forest canopy lignin and nitrogen concentration and ecosystem processes by high spectral resolution remote sensing. Ecological Applications7:431-443.
Myneni, R.B., R.R. Nemani, and S.W. Running. 1997. Estimation of global leaf area index and absorbed par using radiative transfer models. IEEE Transactions on Geoscience and Remote Sensing 35(6):1380-1393.
National Research Council. 1994a. Solar Influences on Global Change.National Academy Press, Washington, D.C.
National Research Council. 1994b. Ocean-Atmosphere Observations Supporting Short-Term Climate Predictions .National Academy Press, Washington, D.C.
National Research Council. 1996. Aerosol Radiative Forcing and Climate Change.National Academy Press, Washington, D.C.
National Research Council. 1997. Rediscovering Geography: New Relevance for Science and Society.National Academy Press, Washington, D.C.
National Research Council. 1998a. A Scientific Strategy for U.S. Participation in the GOALS (Global Ocean-Atmosphere-Land System) Component of CLIVAR (Climate Variability and Predictability) Programme. National Academy Press, Washington, D.C.
National Research Council. 1998b. People and Pixels: Linking Remote Sensing and Social Science, D. Liverman et al., eds. National Academy Press, Washington, D.C.
National Research Council. 1998c. Decade-to-Century-Scale Climate Variability and Change: A Science Strategy.National Academy Press, Washington, D.C.
Potter, C.S., J.T. Randerson, C.B. Field, P.A. Matson, P.M. Vitousek, H.A. Mooney, and S.A. Klooster. 1993. Terrestrial ecosystem production: A process model based on global satellite and surface data.Global Biogeochemical Cycles 7(4):811-841.
Quinlan, F.T. 1985. A history of sunshine data in the United States. Pp. 119-1201 in Handbook of Applied Meteorology, D.D. Houghton, ed. John Wiley & Sons, New York.
Randerson, J.T., M.V. Thompson, T.J. Conway, I.Y. Fung, and C.B. Field. 1997. The contribution of terrestrial sources and sinks to trends in the seasonal cycle of atmospheric carbon dioxide. Global Biogeochemical Cycles11(4):535-560.
Rasmussen, E.M., and T.H. Carpenter. 1982. Variations in tropical sea surface temperature and surface wind fields associated with the Southern Oscillation/El Niño. Monthly Weather Review 110:54-384.
Russell, J.M., III, L.L. Gordley, L.E. Deaver, R.E. Thompson, and J.H. Park. 1994. An overview of the halogen occultation experiment (HALOE) and preliminary results. Advances in Space Research19(9):13-20.
Sellers, P.J., R.E. Dickinson, D.A. Randall, A.K. Betts, F.G. Hall, J.A. Berry, G.J. Collatz, A.S. Denning, H.A. Mooney, C.A. Nobre, N. Sato, C.B. Field, and A. Henderson-Sellers. 1997. Modelling the exchanges of energy, water, and carbon between continents and the atmosphere. Science 275:502-509.
Skole, D., and C. Tucker. 1993. Tropical deforestation and habitat fragmentation in the Amazon: Satellite data from 1978 to 1988. Science260:1905-1909.
Vitousek, P.M., H.A. Mooney, J. Lubchenco, and J.M. Melillo. 1997. Human domination of Earth's ecosystems. Science 277:494-499.
Vörösmarty, C.J., B. Fekete, and B.A. Tucker. 1996. River Discharge Database, Version 1.0 (RivDIS v1.0), Volume 10. A contribution to IHP-V Theme 1. Studies and Reports in Hydrology . UNESCO, Paris.
Wahl, K.L, W.O. Thomas, and R.M. Hirsch. 1995. Stream-gaging program of the U.S. Geological Survey. USGS Circular 1123. U.S. Geological Survey, Reston, Va.
Wennberg, P.O., T.F. Hanisco, L. Jaegle, D.J. Jacob, E.J. Hintsa, E.J. Lanzendorf, J.G. Anderson, R.S. Gao, E.R. Keim, S.G. Donnelly, L.A. Del Negro, D.W. Fahey, S.A. McKeen, R.J. Salawitch, C.R. Webster, R.D. May, R.L. Herman, M.H. Proffitt, J.J. Margitan, E.L. Atlas, R.L. Herman, M.H. Proffitt, J.J. Margitan, E.L. Atlas, S.M. Schauffler, F. Flocke, C.T. McElroy, and R.P. Bui. 1998. Hydrogen radicals, nitrogen radicals, and the production of O3 in the upper troposphere. Science 279:49-53.
Wessman, C.A., J.D. Aber, D.L. Peterson, and J.M. Melillo. 1998. Remote sensing of canopy chemistry and nitrogen cycling in temperate forest ecosystems. Nature 335:154-156.
Willson, R. 1997. Total solar irradiance trend during solar cycles 21 and 22. Science 277:1963-1965.
Wood, C.H., and D. Skole. 1998. Linking satellite, census, and survey data to study deforestation in the Brazilian Amaxon. In People and Pixels: Linking Remote Sensing and Social Science, D. Liverman et al., eds. National Academy Press, Washington, D.C.


