National Academies Press: OpenBook
« Previous: Index
Suggested Citation:"Color Plates 1-8." National Research Council. 1999. Global Environmental Change: Research Pathways for the Next Decade. Washington, DC: The National Academies Press. doi: 10.17226/5992.
×

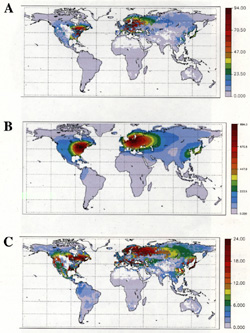
PLATE 1 (a) Spatial distribution of the 1990 carbon sink resulting from fossil fuel nitrogen deposition between 1845 and 1990. Values are in g C/m2; the simulation used fw = 0.5 and Nloss= 0.2, where total global carbon uptake was 0.74 Pg. (b) Fossil fuel nitrogen deposition on land (kg/km2) for 1990 as estimated by the GRANTOUR atmospheric transport model (Penner et al., 1991). (c) Same as (a) except that for this simulation Nloss increases with N deposition. SOURCE: Townsend et al. (1996). Courtesy of the Ecological Society of America.

Suggested Citation:"Color Plates 1-8." National Research Council. 1999. Global Environmental Change: Research Pathways for the Next Decade. Washington, DC: The National Academies Press. doi: 10.17226/5992.
×

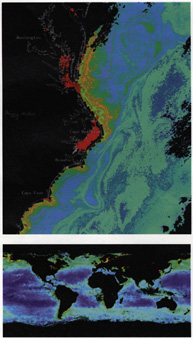
PLATE 2 New images of ocean color from the SeaWlFs instrument. The upper panel shows a high resolution of the coastal oceans off northeastern North America. The lower panel shows a global view. Ocean “color” measures the density of photosynthetic pigments in marine organisms (phytoplankton). This information, the first of its type for over 10 years, can be used to understand marine ecology, fisheries, and physical processes. SOURCE: Data from the SeaWIFs project home page (http://seawifs.gsfc.nasa.gov/SEAWIFS.html).

Suggested Citation:"Color Plates 1-8." National Research Council. 1999. Global Environmental Change: Research Pathways for the Next Decade. Washington, DC: The National Academies Press. doi: 10.17226/5992.
×

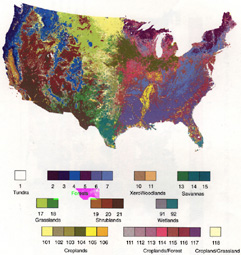
PLATE 3 Current land cover for the conterminous United States (1-km resolution). Classes under 100 are natural vegetation types (with little or some level of human management) and correspond to classes used in VEMAP (VEMAP Participants 1995; Kittel et al., 1995). Those over 100 are cover types dominated by agriculture. SOURCE: Based on Loveland et al. (1991). Courtesy of the American Society for Photogrammetry and Remote Sensing.

Suggested Citation:"Color Plates 1-8." National Research Council. 1999. Global Environmental Change: Research Pathways for the Next Decade. Washington, DC: The National Academies Press. doi: 10.17226/5992.
×

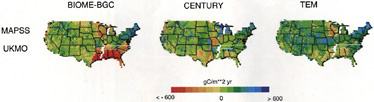
PLATE 4 Change in net primary productivity when biogeochemical models (BIOME-BGC, CENTURY, and TEM) are run using climate change scenarios from the Geophysical Fluid Dynamics Lab, United Kingdom Meteorological Office (UKMO), and OSU models and the altered vegetation distributions predicted by the biogeographic models (see Table 2.2). Results are shown for the simulations using the MAPSS biogeography model and UKMO climate. This shows patterns of change when climate change effects on ecosystem function (plant growth, respiration, nutrient cycling) and ecosystem structure (distributions of forests, grasslands, etc.) are considered together. SOURCE: VEMAP Participants (1995). Courtesy of the American Geophysical Union.

Suggested Citation:"Color Plates 1-8." National Research Council. 1999. Global Environmental Change: Research Pathways for the Next Decade. Washington, DC: The National Academies Press. doi: 10.17226/5992.
×

PLATE 5 Annual surface temperature in °C for 1975 to 1994 relative to 1955 to 1974. SOURCE: IPCC (1996). Courtesy of the Intergovernmental Panel on Climate Change (IPCC).

Suggested Citation:"Color Plates 1-8." National Research Council. 1999. Global Environmental Change: Research Pathways for the Next Decade. Washington, DC: The National Academies Press. doi: 10.17226/5992.
×

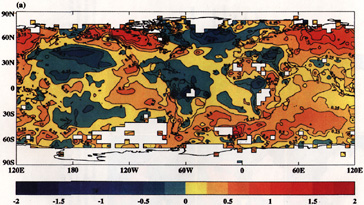
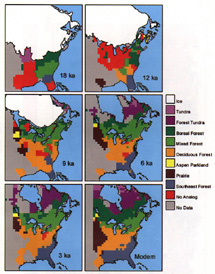
PLATE 6 Selected paleovegetation maps for 18,000 years ago (18 ka) through modern times, reconstructed using the method of modern analogs and over 13,000 samples of fossil and modern pollen (Webb et al., 1991; Overpeck et al., 1992). No vegetation is mapped in areas without fossil pollen data; “no analog” refers to vegetation without any modern analog. SOURCE: Overpeck et al. (1992). Courtesy of the Geological Society of America.

Suggested Citation:"Color Plates 1-8." National Research Council. 1999. Global Environmental Change: Research Pathways for the Next Decade. Washington, DC: The National Academies Press. doi: 10.17226/5992.
×

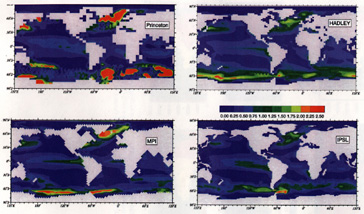
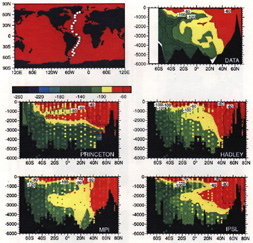
PLATE 7 Air-sea δ CO2 flux (1990) [mol m2 yr-1]. Oceanic uptake of anthropogenic CO2 by four different models; global spatial distribution. Results show that, although the models all have the same overall pattern of enhanced uptake in upwelling and convective regions and weak uptake in downwelling regions, there are dramatic regional differences, particularly in the Southern Ocean. Courtesy of the IGBP/GAIM Ocean Carbon Modeling Intercomparison Project.

Suggested Citation:"Color Plates 1-8." National Research Council. 1999. Global Environmental Change: Research Pathways for the Next Decade. Washington, DC: The National Academies Press. doi: 10.17226/5992.
×

PLATE 8 Vertical distribution of natural radiocarbon along a section in the West Atlantic, as simulated in four ocean models and as observed in a 1973 GEOSECS transect (top left). The units are in δ14C. Courtesy of the IGBP/GAIM Ocean Carbon Modeling Intercomparison Project.

Suggested Citation:"Color Plates 1-8." National Research Council. 1999. Global Environmental Change: Research Pathways for the Next Decade. Washington, DC: The National Academies Press. doi: 10.17226/5992.
×
Page 596
Suggested Citation:"Color Plates 1-8." National Research Council. 1999. Global Environmental Change: Research Pathways for the Next Decade. Washington, DC: The National Academies Press. doi: 10.17226/5992.
×
Page 597
Suggested Citation:"Color Plates 1-8." National Research Council. 1999. Global Environmental Change: Research Pathways for the Next Decade. Washington, DC: The National Academies Press. doi: 10.17226/5992.
×
Page 598
Suggested Citation:"Color Plates 1-8." National Research Council. 1999. Global Environmental Change: Research Pathways for the Next Decade. Washington, DC: The National Academies Press. doi: 10.17226/5992.
×
Page 599
Suggested Citation:"Color Plates 1-8." National Research Council. 1999. Global Environmental Change: Research Pathways for the Next Decade. Washington, DC: The National Academies Press. doi: 10.17226/5992.
×
Page 600
Suggested Citation:"Color Plates 1-8." National Research Council. 1999. Global Environmental Change: Research Pathways for the Next Decade. Washington, DC: The National Academies Press. doi: 10.17226/5992.
×
Page 601
Suggested Citation:"Color Plates 1-8." National Research Council. 1999. Global Environmental Change: Research Pathways for the Next Decade. Washington, DC: The National Academies Press. doi: 10.17226/5992.
×
Page 602
Suggested Citation:"Color Plates 1-8." National Research Council. 1999. Global Environmental Change: Research Pathways for the Next Decade. Washington, DC: The National Academies Press. doi: 10.17226/5992.
×
Page 603
Global Environmental Change: Research Pathways for the Next Decade Get This Book
×
Buy Hardback | $90.00 Buy Ebook | $69.99
MyNAP members save 10% online.
Login or Register to save!
Download Free PDF

How can we understand and rise to the environmental challenges of global change? One clear answer is to understand the science of global change, not solely in terms of the processes that control changes in climate and the composition of the atmosphere, but in how ecosystems and human society interact with these changes. In the last two decades of the twentieth century, a number of such research efforts—supported by computer and satellite technology—have been launched. Yet many opportunities for integration remain unexploited, and many fundamental questions remain about the earth's capacity to support a growing human population.

This volume encourages a renewed commitment to understanding global change and sets a direction for research in the decade ahead. Through case studies the book explores what can be learned from the lessons of the past 20 years and what are the outstanding scientific questions. Highlights include:

  • Research imperatives and strategies for investigators in the areas of atmospheric chemistry, climate, ecosystem studies, and human dimensions of global change.
  • The context of climate change, including lessons to be gleaned from paleoclimatology.
  • Human responses to—and forcing of—projected global change.

This book offers a comprehensive overview of global change research to date and provides a framework for answering urgent questions.

  1. ×

    Welcome to OpenBook!

    You're looking at OpenBook, NAP.edu's online reading room since 1999. Based on feedback from you, our users, we've made some improvements that make it easier than ever to read thousands of publications on our website.

    Do you want to take a quick tour of the OpenBook's features?

    No Thanks Take a Tour »
  2. ×

    Show this book's table of contents, where you can jump to any chapter by name.

    « Back Next »
  3. ×

    ...or use these buttons to go back to the previous chapter or skip to the next one.

    « Back Next »
  4. ×

    Jump up to the previous page or down to the next one. Also, you can type in a page number and press Enter to go directly to that page in the book.

    « Back Next »
  5. ×

    Switch between the Original Pages, where you can read the report as it appeared in print, and Text Pages for the web version, where you can highlight and search the text.

    « Back Next »
  6. ×

    To search the entire text of this book, type in your search term here and press Enter.

    « Back Next »
  7. ×

    Share a link to this book page on your preferred social network or via email.

    « Back Next »
  8. ×

    View our suggested citation for this chapter.

    « Back Next »
  9. ×

    Ready to take your reading offline? Click here to buy this book in print or download it as a free PDF, if available.

    « Back Next »
Stay Connected!