
7
Vitamin B6
SUMMARY
Vitamin B6 (pyridoxine and related compounds) functions as a coenzyme in the metabolism of amino acids, glycogen, and sphingoid bases. The primary criterion used to estimate the Recommended Dietary Allowance (RDA) for vitamin B6 is a plasma 5'-pyridoxal phosphate value of at least 20 nmol/L. Bioavailability of 75 percent is assumed from a mixed diet. The RDA for young adults is 1.3 mg. Recently, the median intake of vitamin B6 from food in the United States was approximately 2 mg/day for men and 1.4 mg/day for women; in one Canadian population study the median intake was approximately 1.8 mg/day for men and 1.3 mg/day for women. The ninety-fifth percentile of U.S. intake from both food and supplements has been estimated to be 6 to 10 mg/ day. The critical adverse effect from high intake of the vitamin is sensory neuropathy. The data fail to demonstrate a causal association between pyridoxine intake and other endpoints (e.g., dermatological lesions and vitamin B6 dependency in newborns). The Tolerable Upper Intake Level (UL) for adults is 100 mg/day of vitamin B6.
BACKGROUND INFORMATION
Vitamin B6 (B6) comprises a group of six related compounds: pyridoxal (PL), pyridoxine (PN), pyridoxamine (PM), and their respective 5'-phosphates (PLP, PNP, and PMP). The major forms in
animal tissues are PLP and PMP; plant-derived foods contain primarily PN and PNP, sometimes in the form of a glucoside. In humans, the major excretory form is 4-pyridoxic acid (4-PA).
Function
PLP is a coenzyme for more than 100 enzymes involved in amino acid metabolism, including aminotransferases, decarboxylases, racemases, and dehydratases. It is a coenzyme for δ-aminolevulinate synthase, which catalyzes the first step in heme biosynthesis, and for cystathionine β-synthase and cystathioninase, enzymes involved in the transsulfuration pathway from homocysteine to cysteine. The carbonyl group of PLP binds to proteins as a Schiff’s base with the ε-amine of lysine. For practically all PLP enzymes the initial step in catalysis involves formation of a Schiff’s base between an incoming amino acid, via its α-amino group, and the carbonyl group of PLP. Much of the total PLP in the body is found in muscle bound to phosphorylase. PLP is a coenzyme in the phosphorylase reaction and is also directly involved in catalysis.
Physiology of Absorption, Metabolism, and Excretion
Absorption and Transport
In animal tissue the major form of B6 is PLP; next is PMP. Absorption in the gut involves phosphatase-mediated hydrolysis followed by transport of the nonphosphorylated form into the mucosal cell. Transport is by a nonsaturable passive diffusion mechanism. Even extremely large doses are well absorbed (Hamm et al., 1979). PN glucoside is absorbed less effectively than are PLP and PMP and, in humans, is deconjugated by a mucosal glucosidase (Nakano and Gregory, 1997). Some PN glucoside is absorbed intact and can be hydrolyzed in various tissues.
Metabolism
Most of the absorbed nonphosphorylated B6 goes to the liver. PN, PL, and PM are converted to PNP, PLP, and PMP by PL kinase. PNP, which is normally found only at very low concentrations, and PMP are oxidized to PLP by PNP oxidase. PMP is also generated from PLP via aminotransferase reactions. PLP is bound to various proteins in tissues; this protects it from the action of phosphatases. The capacity for protein binding limits the accumulation of PLP by
tissues at very high intakes of B6 (Merrill et al., 1984). When this capacity is exceeded, free PLP is rapidly hydrolyzed and nonphosphorylated forms of B6 are released by the liver and other tissues into circulation. At pharmacological doses of B6, the high capacities for PLP-protein binding of muscle, plasma, and erythrocytes (hemoglobin) allow them to accumulate very high levels of PLP when other tissues are saturated (Lumeng et al., 1978).
PLP in the liver can be oxidized to 4-PA, which is released and excreted. The major PLP-binding protein in plasma is albumin. PLP is the major form of the vitamin in plasma and is derived entirely from liver as a PLP-albumin complex (Fonda et al., 1991; Leklem, 1991). Tissues and erythrocytes can transport nonphosphorylated forms of the vitamin from plasma. Some of this is derived from plasma PLP after phosphatase action. In tissues, conversion of the transported vitamin to PLP, coupled with protein binding, allows accumulation and retention of the vitamin. B6 in tissues is found in various subcellular compartments but primarily in the mitochondria and the cytosol.
Excretion
Normally, the major excretory product is 4-PA, which accounts for about half the B6 compounds in urine (Shultz and Leklem, 1981). Other forms of the vitamin are also found in urine. With large doses of B6, the proportion of the other forms of the vitamin increases. At very high doses of PN, much of the dose is excreted unchanged in the urine. B6 is also excreted in feces but probably to a limited extent (Lui et al., 1985). Microbial synthesis of B6 in the lower gut makes it difficult to evaluate the extent of this excretion.
Body Stores
Pharmacokinetic analyses of urinary excretion of a tracer dose of labeled PN and its metabolites have suggested a two-compartment model for body B6 stores (Johansson et al., 1966). With this approach, body stores have been estimated at 365 µmol (61 mg) or 7.7 µmol/kg in a healthy 20-year-old woman and 660 µmol (110 mg) or 8.8 µmol/kg in a 25-year-old man. Overall body half-lives were about 25 days (Shane, 1978). Intake (and excretion) was estimated to be 1.5 mg (9 µmol) for the woman and 3.4 mg (20 µmol) for the man. The two-compartment model has been questioned because muscle stores most of the body’s B6; the pool in muscle appears to turn over very slowly. This fact may have not been considered, resulting
in a substantial underestimation of body stores. Coburn and colleagues (1988a) estimated the B6 content of muscle biopsies and, by assuming that muscle represented 80 percent of the body B6 store, calculated a total body store of about 1,000 µmol (167 mg). Extrapolation of data from studies with experimental animals to assess the B6 requirement for maintenance and growth (Coburn et al., 1987, 1988b) indicates that 1 mg of PN would be an adequate intake for the adult. Modeling of human B6 pools has also led to an assessment of a minimum requirement of about 0.4 mg/day of PN (Coburn, 1990).
Clinical Effects of Inadequate Intake
The classical clinical symptoms of B6 deficiency are a seborrheic dermatitis (Mueller and Vilter, 1950), microcytic anemia (Snyderman et al., 1953), epileptiform convulsions (Bessey et al., 1957; Coursin, 1954), and depression and confusion (Hawkins and Barsky, 1948). Microcytic anemia reflects decreased hemoglobin synthesis. The first enzyme and committed step in heme biosynthesis, aminolevulinate synthase, uses PLP as a coenzyme. Because PLP is also a coenzyme of decarboxylases that are involved in neurotransmitter synthesis, defects in some of these enzymes could explain the onset of convulsions in B6 deficiency. Many studies have demonstrated that the levels of neurotransmitters such as dopamine, serotonin, and γ-aminobutyrate are reduced in B6-depleted experimental animals, especially in extreme B6 depletion (Dakshinamurti and Stephens, 1969; Dakshinamurti et al., 1991, 1993; Sharma and Dakshinamurti, 1992; Sharma et al., 1994; Stephens et al., 1971). Some of these studies were reviewed in a conference report (Dakshinamurti, 1990). However, it has not been definitely shown whether the convulsions are due to the reduced level of one of these neurotransmitters in particular. Guilarte (1993) proposed that the convulsions are caused by abnormal tryptophan metabolites that accumulate in the brain in B6 deficiency.
Electroencephalogram (EEG) abnormalities have also been reported in controlled studies of B6 depletion. In one depletion-repletion study (Kretsch et al., 1991) 2 of 11 young women placed on a diet containing less than 0.05 mg of B6 exhibited abnormal EEG patterns within 12 days. The abnormal patterns were promptly corrected by 0.5 mg/day of PN. Similar abnormalities were reported in young men placed on a diet containing less than 0.06 mg/day of B6 for 21 days (Canham et al., 1964). However, no EEG changes were detected when young men were placed on a diet containing
0.16 mg/day of B6 for 21 days (Grabow and Linkswiler, 1969). Although a longer depletion period with 0.16 mg/day of B6 may have eventually resulted in some abnormalities, diets containing 0.5 mg/ day of B6 have consistently failed to demonstrate abnormal EEG patterns or any hematological symptoms. Convulsions and dermatitis were not seen in these studies.
Inadequate intakes of B6 have also been reported to impair platelet function and clotting mechanisms (Brattstrom et al., 1990; Subbarao and Kakkar, 1979), but these effects may also be due to the hyperhomocysteinemia noted in such patients (Brattstrom et al., 1990).
SELECTION OF INDICATORS FOR ESTIMATING THE REQUIREMENT FOR VITAMIN B6
Indicators of vitamin B6 status have traditionally been described as direct (vitamin concentrations in plasma, blood cells, or urine), indirect, or as functional (erythrocyte aminotransferase saturation by pyridoxal 5'-phosphate [PLP] or tryptophan metabolites). In most instances, the concentrations of these indicators change with increases or decreases in vitamin intake. As such, they are useful as indicators of relative B6 status, especially in controlled depletion-repletion studies (Leklem, 1990; Sauberlich et al., 1972). However, there is little scientific information concerning which concentration of a particular indicator represents a clinical deficiency or inadequate status of the vitamin. Because of this, B6 requirements have often been evaluated by using a combination of status indicators. However, this does not overcome the problem of establishing absolute values reflecting impaired status. The increase in methionine metabolites after a methionine load has also been used as an indicator of B6 status (Leklem, 1994) but it has not found extensive use in B6 requirement studies.
A review of established indicators of B6 status suggests that plasma PLP is probably the best single indicator because it appears to reflect tissue stores (Lui et al., 1985).
Plasma Pyridoxal 5'-Phosphate
The plasma PLP concentration reflects liver PLP (Lumeng and Li, 1974) and changes fairly slowly in response to changes in vitamin intake, taking about 10 days to reach a new steady state (Lui et al., 1985). The plasma PLP concentration generally correlates with other indices of B6 status. PLP is the major form of B6 in tissues and
is the active coenzyme species. In animals fed graded levels of pyridoxine (PN), the plasma PLP concentration correlated well with tissue B6 (Lumeng et al., 1978).
Protein-bound PLP in the plasma is in equilibrium with free PLP. Binding of PLP to protein protects it from hydrolysis by alkaline phosphatase. Conditions of increased plasma phosphatase activity can lead to reduced plasma PLP. Hydrolysis of plasma PLP is required before it can be transported into tissues.
In the controlled depletion-repletion study (Kretsch et al., 1991) in which 2 of 11 young women placed on a diet containing less than 0.05 mg of B6 exhibited abnormal electroencephalogram patterns, plasma PLP dropped to about 9 nmol/L. Similar PLP values were also observed in the other 9 depleted but asymptomatic subjects. This suggests that PLP concentrations of about 10 nmol/L represent a suboptimal concentration associated with clinical consequences in some subjects. Although fewer than half the subjects in this study exhibited signs of deficiency, more subjects might have shown signs if the depletion diet had been continued longer than 12 days.
Leklem (1990) has suggested a plasma PLP concentration of 30 nmol/L as the lower end of normal status. Results from a large number of studies involving various population groups (Brown et al., 1975; Driskell and Moak, 1986; Lindberg et al., 1983; Lumeng et al., 1974; Miller et al., 1975, 1985; Rose et al., 1976; Tarr et al., 1981) have shown that a substantial proportion of individuals in these populations, in some cases half, have plasma PLP concentrations below 30 nmol/L, but there are no confirming clinical or other data to suggest B6 deficiency. Other investigators have proposed a cutoff of 20 nmol/L for plasma PLP as an index of adequacy (Lui et al., 1985). The more conservative cutoff of 20 nmol/L is not accompanied by observable health risks but it allows a moderate safety margin to protect against the development of signs or symptoms of deficiency. A cutoff for PLP of 20 nmol/L was selected as the basis for the average requirement (EAR) for B6 although its use may overestimate the B6 requirement for health maintenance of more than half the group.
A recent random sampling of the Dutch population indicated a 3 to 7 percent prevalence of plasma PLP concentrations of less than 19 nmol/L in various life stage and gender groups (Brussaard et al., 1997a, b). The prevalence was slightly higher in men aged 50 to 79 years. Although plasma PLP values in this population correlated with dietary variables, some of the fundamental tests for B6 status,
including the increase in homocysteine after a methionine load, did not correlate as well.
Plasma PLP concentrations decrease slightly with increased protein intake. They are very high by comparison in the fetus, decrease fairly rapidly in the first year, and then decrease more gradually throughout the lifespan (Hamfelt and Tuvemo, 1972). It is not possible to evaluate whether the higher values in newborns and infants reflect ample body stores or whether the higher concentrations reflect normal status for this age group. Because of this, it is not possible to state that a 20 nmol/L concentration in the infant reflects a status equivalent to that for a 20 nmol/L PLP concentration in the adult.
Normally, plasma PLP is measured by using an apotyrosine decarboxylase assay. This assay has been well standardized and there is usually good interlaboratory agreement with it.
Erythrocyte and Total Blood Pyridoxal 5'-Phosphate
Erythrocyte and total blood PLP concentrations have also been used as measures of B6 status but not as extensively as plasma PLP. Erythrocyte PLP concentrations are similar to those for plasma PLP in individuals on normal diets, but they increase to much higher values than does plasma PLP in subjects taking large doses of the vitamin (Bhagavan et al., 1975). This reflects the high binding capacity of hemoglobin for PLP. Erythrocyte PLP is derived from plasma pyridoxal (PL); the erythrocyte contains PL kinase activity. Because of lower kinase activity, blacks may have lower erythrocyte PLP values than do whites. The small number of studies using erythrocyte values limits the ability to derive a concentration consistent with adequate status.
Blood Total Vitamin Concentrations
Blood concentrations of total vitamers of B6 as well as individual concentrations of specific B6 vitamers have been determined in some studies. These values tend to fluctuate considerably. They also fluctuate throughout the menstrual cycle, which limits their usefulness as status indicators (Contractor and Shane, 1968).
Urinary Pyridoxic Acid and Total Vitamin B6
Urinary B6 excretion and 4-pyridoxic acid (4-PA) excretion have been used extensively to evaluate B6 requirements. Approximately
50 percent of the B6 intake is excreted as 4-PA, but this proportion can vary somewhat. 4-PA excretion responds almost immediately to changes in dietary B6 intake (Lui et al., 1985). Because it reflects recent intake, it is of essentially no value in assessing status. Leklem (1990) has suggested a value of greater than 3 µmol/day as indicative of adequate status. This is achieved with intakes of about 1 mg of B6. However, the use of this cutoff value represents a circular argument; it presupposes that 1 mg/day of B6 is an adequate intake.
Erythrocyte Aspartate Aminotransferase and Alanine Aminotransferase
The stimulation (activation) of erythrocyte aspartate aminotransferase (α-EAST) and erythrocyte alanine aminotransferase (α-EALT) by PLP has been used extensively to evaluate long-term B6 status. These tests measure the amount of enzyme in the apoenzyme form; the ratio of the apoenzyme to total enzyme increases with B6 depletion. Leklem (1990) has suggested an α-EAST of less than 1.6 and an α-EALT of less than 1.25 as indicative of adequate B6 status. Variations in values reported in different studies, which may reflect blood storage conditions and time, have interfered with the setting of a well-documented cutoff point. As described in the later section “Women Ages 19 through 50 Years,” aminotransferase activation factors stabilize slowly in response to changes in diet; this leads to an overestimation of the amount of B6 required to return values to a preset value in depletion-repletion studies.
The absolute EALT and EAST enzyme activities, both holo- and total enzyme, have also been measured in many studies, but the large variation in values limits their usefulness as indicators of status (Raica and Sauberlich, 1964).
Tryptophan Catabolites
One of the earliest markers for B6 deficiency was the urinary excretion of xanthurenic acid, which is normally a minor tryptophan catabolite. The major pathway of tryptophan catabolism proceeds via the PLP-dependent kynureninase reaction (Shane and Contractor, 1980). The xanthurenic acid pathway also involves PLP-dependent enzymes. However, under conditions of B6 deficiency, this minor pathway is used to a greater extent, leading to the increased excretion of abnormal tryptophan metabolites. Mitochondrial enzymes involved in xanthurenic acid production probably retain their
PLP more effectively than does the cytosolic kynureninase under these conditions.
The evaluation of B6 status by measuring tryptophan catabolites after a loading dose of tryptophan has been used extensively to assess B6 status. Various challenge doses of tryptophan have been used in different studies. Xanthurenic acid excretion is responsive to B6 intake in controlled depletion-repletion studies. However, as for many of the tests of B6 status, it is not clear what level of excretion represents adverse B6 status under the conditions of the tryptophan challenge dose. Leklem (1990) has suggested that a 24-hour urinary excretion of less than 65 µmol xanthurenate after a 2-g tryptophan oral dose indicates normal B6 status.
The first enzyme in the tryptophan catabolic pathway is a dioxygenase that is induced by various steroid hormones. Consequently, the flux through this pathway and the excretion of minor tryptophan catabolites can be influenced by conditions of changed hor-monal status. For example, both pregnancy and the use of highdose oral contraceptive agents increase the excretion of these catabolites (Rose, 1978) (see “Oral Contraceptive Agents”).
Plasma Homocysteine
Homocysteine catabolism proceeds via transsulfuration to cysteine and involves two PLP-dependent enzymes. Homocysteine can also be remethylated to methionine via folate and vitamin B12-dependent enzymes. Thus, plasma concentrations of homocysteine are influenced by B6 and folate and, to a lesser extent, B12 intakes (Selhub et al., 1993). Racial and gender differences in homocysteine values and response to vitamin intervention have been found in some studies (Ubbink et al., 1995). In a South African comparison of black and white subjects with similar lifestyles and folate and vitamin B12 status, plasma PLP concentrations were significantly lower in the black subjects; fasting plasma homocysteine concentration was similar. The increase in plasma homocysteine concentration after a methionine load was significantly less in the black subjects despite their lower plasma PLP values (Ubbink et al., 1995). After 6 weeks of daily supplementation with a multivitamin containing 10 mg of PN, 1 mg of folate, and 0.4 mg of vitamin B12, fasting homocysteine concentration decreased in both groups. The elevation in plasma homocysteine concentration after a methionine load was unaffected by supplementation in the black subjects whereas the elevation in the white subjects decreased to about the same level as observed in the black subjects. These data suggest that
despite apparently lower B6 status, as indicated by plasma PLP levels, the black subjects were more efficient than the whites in catalyzing the transsulfuration of homocysteine to cysteine.
The increase in plasma homocysteine concentration after a methionine load or a meal is responsive to and primarily affected by B6 status, but data are not sufficient to support using this as the criterion on which to base the EAR. Because the fasting homocysteine concentration is primarily responsive to folate status (Ubbink et al., 1996), it is not a good candidate for use in setting the EAR. Results from population-based studies using data adjusted for folate and B12 status and for age indicate that B6 status as measured by PLP is inversely correlated with nonfasting plasma homocysteine concentration (Selhub et al., 1993). At least part of the increase in plasma homocysteine concentration that occurs with aging may be due to decreased renal function (Hultberg et al., 1993) rather than B6 status.
Possible Reduction of Chronic Disease Risk
Moderate hyperhomocysteinemia was identified recently as a possible risk factor for vascular disease (Selhub et al., 1995; see also Chapter 8), and vitamin intervention can be used to reduce plasma homocysteine values. A recent prospective observational study has examined the effect of self-selection for intake of folate and B6 on the incidence of myocardial infarction (MI) and fatal coronary heart disease (CHD) (Rimm et al., 1998). After other risk factors for CHD were controlled for and vitamin intake was adjusted for energy intake, about a twofold reduction in MI and CHD was found for individuals in the quintile with the highest folate and B6 intakes compared with those with the lowest intakes. When intakes of each of the vitamins were considered separately, the multivariate analyses suggested about a 30 percent reduction in disease incidence between individuals in the highest and lowest quintiles of intake for each of the vitamins. For B6 the data are compatible with the Framingham study (Selhub et al., 1993), in which the lowest deciles of B6 intake were associated with higher circulating homocysteine. However, in the current study although multivariate analysis indicated a trend in risk reduction across the quintiles of intake, the major reduction appeared to occur between the fourth and fifth quintiles of intake (median intakes 2.7 and 4.6 mg). At these high B6 intakes, there is little effect of B6 intake on homocysteine levels, which are mainly affected by changes in intake at much lower intakes. Although these data are intriguing and suggest that self-
selection for high B6 intake may lower CHD incidence, the highest quintile of intake was associated with increased supplement use. Some of these individuals may also exhibit other lifestyle differences that influence CHD risk, some of which were not and others that could not have been considered in the analysis. In addition, vitamin intakes were normalized to energy intake, which may have had an effect.
A study of elderly patients with coronary disease indicated a significantly elevated plasma homocysteine concentration compared with control subjects; homocysteine values were inversely correlated with plasma vitamin concentrations (Robinson et al., 1995). Plasma PLP values below 20 nmol/L were seen in 10 percent of the patients but in only 2 percent of the control subjects (p < 0.01).
Studies of B6-homocysteine-vascular disease relationships were not considered in this analysis if conducted with patients with end-stage renal disease. Because homocysteine is metabolized in the kidney, this condition would exacerbate any effects of vitamin deficiency. Kidney disease may also affect B6 metabolism and turnover.
Several ongoing randomized trials are addressing whether supplementation will decrease risks of CHD. Thus, it would be premature to establish a B6 intake level and corresponding homocysteine value for lowest risk for disease.
Cognitive Function
The relationship of vitamin status to cognitive function was recently evaluated in the elderly (Riggs et al., 1996). B6 status, as evaluated by plasma PLP concentrations, was related to 2 out of a battery of about 20 tests. The usefulness of these tests for evaluating B6 status will require further validation of the putative relationships.
FACTORS AFFECTING THE VITAMIN B6 REQUIREMENT
Bioavailability
Vitamin B6 bioavailability was recently reviewed by Gregory (1997). B6 in a mixed diet is about 75 percent bioavailable (Tarr et al., 1981). A mixed diet typically contains about 15 percent pyridoxine (PN) glucoside (Gregory, 1997), which is about 50 percent as bioavailable as the other B6 vitamins. The bioavailability of nonglucoside forms of the vitamin is greater than 75 percent.
The absorption of B6 compounds in the absence of food is comparable, even at very high doses. About 70 percent of a loading dose
of 50 mg pyridoxal (PL) or the equivalent dose of pyridoxal phosphate (PLP) can be accounted for in the urine within 24 hours, demonstrating that the phosphorylated form is effectively hydrolyzed and absorbed in the gut (Shane, 1978; Snell, 1958). Under the same conditions, about 40 percent of an equivalent dose of PN can be accounted for in the urine, but PN at high doses raises the plasma PLP concentration and is retained more effectively than is PL (Shane, 1978).
Similarly, dietary pyridoxamine (PM) and PL are about 10 percent less effective than PN in raising the plasma PLP concentration, and slightly more of these vitamins is excreted in the urine as 4-pyridoxic acid (4-PA) (Wozenski et al., 1980). Most controlled B6 studies have used PN as the added B6 source, but requirements calculated from these studies would underestimate the B6 requirement by only 5 percent or less for individuals deriving most of their B6 as PLP and PMP from animal sources.
Nutrient-Nutrient Interactions
Because of PLP’s role as a coenzyme for many enzymes involved in amino acid metabolism, it has been proposed that B6 requirements are influenced by protein intake. Many studies have demonstrated that increased protein intake causes a relative decrease in B6 status as judged by a variety of B6 status indicators (Baker et al., 1964; Hansen et al., 1996b; Linkswiler, 1978; Miller et al., 1985; Sauberlich, 1964). This had led some to define B6 requirements in terms of protein intake. A number of other studies, however, have failed to demonstrate an effect of protein intake on B6 status parameters. A study in young and elderly men and women found little effect of dietary protein levels (12 and 21 percent of total energy) on B6 status as measured by plasma PLP and erythrocyte aspartate aminotransferase (Pannemans et al., 1994).
Almost all studies investigating the effects of different protein intakes have assessed the effects of graded levels of PN on status indicators to obtain a B6 requirement in milligrams. They have then adjusted this value based on the protein intake to obtain a value per gram of protein. This approach assumes a linear relationship between B6 requirements and protein intake for which there is little experimental justification. This approach may also overestimate the requirement for B6 because the requirement has been set by assuming a protein intake of 100 g for men. Thus, the approach cannot be used for setting an Estimated Average Requirement (EAR). Increased protein may cause a relative decrease in B6 status indicators
because induction of PLP-dependent enzymes may lead to tissue retention of PLP. In such a case, a decrease in a status indicator, such as plasma PLP, may not necessarily indicate a relative decrease in B6 status. Increased excretion of tryptophan metabolites seen may also partly be due to the increased dietary tryptophan content.
The relationship between plasma PLP concentrations and the amount of B6 per kilogram of protein intake (derived from a number of studies and compiled by J.Leklem, Oregon State University [Hansen et al., 1997; Huang et al., 1998; Kretsch et al., 1995; RibayaMercado et al., 1991]), is shown in Figure 7-1A. Although a good correlation is observed (r = 0.928), when the same data are plotted as a function purely of B6 intake (Figure 7-1B), the correlation appears to be equally as good (r = 0.896). Consequently, expressing B6 requirements in terms of protein intake appears to add an unnecessary manipulation of the intake data that does not substantially add to the precision of assessed requirements. Moreover, this relationship is not supported by all studies. In the assessment of requirements that follows, note is taken of effects of increased protein intakes in the setting of values for B6 requirements.
Physical Activity
A number of studies have examined the effect of physical activity on B6 status (Crozier et al., 1994; Fogelholm, 1992), metabolism (Dreon and Butterfield, 1986; Leklem and Shultz, 1983; Manore and Leklem, 1988; Manore et al., 1987), and physical performance (van der Beek et al., 1994). Effects, if any, have been small. However, these studies were not designed to quantitate the effects of physical activity on B6 requirements.
Other Factors
Drug Interactions
Drugs that can react with carbonyl groups have the potential to interact with PLP. Isoniazid, which is used in the treatment of tuberculosis, and L-DOPA, which is metabolized to dopamine, have been reported to reduce plasma PLP concentrations (Bhagavan, 1985; Weir et al., 1991).
Oral Contraceptive Agents
A number of studies have reported decreases in B6 status indica-
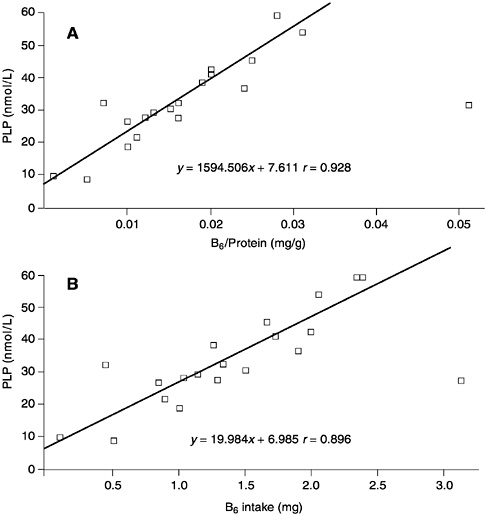
FIGURE 7-1 The relationships between (A) plasma pyridoxal phosphate (PLP) concentrations and vitamin B6 intake per gram of dietary protein and (B) plasma PLP concentrations and B6 intake. Data derived from a compilation by J.Leklem, Oregon State University and from Hansen et al. (1997), Huang et al. (1998), Kretsch et al. (1995), and Ribaya-Mercado et al. (1991).
tors in women receiving high-dose oral contraceptives (Rose, 1978; Shane and Contractor, 1975). Plasma PLP concentrations are decreased but the decrease is quite small. Normalization of the tryptophan load test in subjects receiving oral contraceptives requires very high levels of PN, up to 25 mg (Rose, 1978). This probably reflects hormonal stimulation of tryptophan catabolism rather than any deficiency of B6 per se. These studies were conducted when the
level of estrogen in oral contraceptive agents was three to five times higher than it is currently.
Alcohol
Alcoholics have low plasma PLP concentrations, and this reduced B6 status is distinct from that caused by liver disease or poor diet. Acetaldehyde but not ethanol decreases net PLP formation by cells and is thought to compete with PLP for protein binding. This may make cellular PLP more susceptible to hydrolysis by membranebound phosphatase (Lumeng and Li, 1974). The extent to which this causes an increased B6 requirement is not known.
Preeclampsia
The lowered plasma PLP concentration observed in pregnancy is lowered further in subjects with preeclampsia or eclampsia (Brophy and Siiteri, 1975; Shane and Contractor, 1980). Cord blood PLP of the newborn and placenta enzymes involved in PLP synthesis are also reduced (Gaynor and Dempsey, 1972), suggesting a potentially increased B6 requirement in preeclampsia.
FINDINGS BY LIFE STAGE AND GENDER GROUP
In controlled studies, clinical symptoms of vitamin B6 deficiency have only been observed during depletion with very low levels of B6 and have never been seen at intakes of 0.5 mg/day or more. Most studies of B6 requirements have focused on adults and have been depletion-repletion studies. Starting with the pioneering studies of the Sauberlich group (Raica and Sauberlich, 1964; Sauberlich, 1964; Sauberlich et al., 1972), studies (described below) have demonstrated the usefulness of B6 status indicators for tracking relative vitamin status. However, many of the studies are flawed in that requirements have usually been assessed by identifying the B6 intakes that return status indicators to the prestudy baseline values. Baseline values have been those of motivated healthy individuals on self-selected diets or on diets containing 1.5 to 2 mg of pyridoxine (PN). It is not surprising that the assessed requirements based on this approach of normalizing values are invariably similar to or higher than the baseline B6 intake. Normalization to baseline should require the same intake as in the baseline period, but studies generally come up with a higher value. This suggests that equilibration was not reached during the study periods for some of the indicators.
This approach of normalization to baseline is a complicated way to determine baseline vitamin intake and does not directly address the requirement for the vitamin.
In the discussion that follows, data are reanalyzed, particularly from some recent studies, to arrive at an Estimated Average Requirement (EAR) for some adult age groups. Various indicators of B6 status are used, but when possible, a plasma pyridoxal phosphate (PLP) value of at least 20 nmol/L is used as the major indicator of adequacy.
Most controlled studies on B6 requirements have used a liquid formula diet (which contains some food-bound B6) supplemented with synthetic PN. Because PN is 95 percent bioavailable whereas food B6 is only about 75 percent bioavailable, synthetic B6 is 95/75 (i.e., 1.27) times more available. Thus, dietary B6 equivalents are calculated as follows to determine the EAR:
mg of dietary B6 equivalents provided = mg of food B6 + (1.27 × mg of synthetic B6).
Infants Ages 0 through 12 Months
Method Used to Set the Adequate Intake
An Adequate Intake (AI) is used as the goal for intake by infants. Limited data are available on B6 requirements of the infant, but an AI can be set based on human milk B6 content, which varies with maternal B6 intake. West and Kirksey (1976) reported an average B6 content of 0.13 mg/L of human milk at maternal B6 intakes of less than 2.5 mg and 0.24 mg/L at intakes of 2.5 to 5 mg. However, milk B6 content was quite variable between subjects at similar B6 intakes. Borschel and colleagues (1986) reported that the milk of mothers receiving 2.5 mg/day of PN as a supplement contained 0.15 to 0.21 mg/L of B6.
Ages 0 through 6 Months. The AI reflects the observed mean B6 intake of infants consuming human milk. Thus, the B6 AI for young infants is based on mean intake data from infants fed human milk as the principal food during their first 6 months and uses the B6 concentration of milk produced by well-nourished mothers. There are no reports of full-term infants exclusively and freely fed human milk from U.S. or Canadian mothers who manifested any signs of B6 deficiency. The mean concentration of B6 in human milk of well-
nourished but unsupplemented mothers with intakes near the Recommended Dietary Allowance (RDA) is 0.13 mg/L (West and Kirksey, 1976). Using the mean volume of milk consumed of 0.78 L/day (see Chapter 2) and the average B6 content of 0.13 mg/L, the AI for B6 is 0.1 mg/day for infants ages 0 through 6 months.
Little information is available on optimal plasma B6 concentrations in the infant. Cord vein and artery PLP concentrations are very high in the fetus and in the newborn. They progressively decrease throughout the first year and then more slowly throughout life. Kang-Yoon and coworkers (1995) found lower B6 content in milk of mothers of preterm infants even when the mothers were receiving 2 mg/day of B6 as a supplement. Plasma PLP in infants correlated with their B6 intake. In infants of mothers supplemented with 2 mg/day of PN, plasma PLP fell to 32 nmol/L by 1 month compared with 270 nmol/L in plasma of infants supplemented with 0.4 mg/day of B6 directly. Formula-fed infants also had much higher plasma PLP values (about 200 nmol/L). In healthy infants, 0.3 mg of B6 prevented abnormal tryptophan metabolites (Bessey et al., 1957).
In the 1950s convulsions were reported in infants receiving formula in which much of the B6 content had been destroyed in processing. The convulsions were promptly treated by PN administration (Coursin, 1954); 0.26 mg was sufficient (Bessey et al., 1957) but 1 mg was required to correct abnormal tryptophan metabolites. The B6 content of the overly processed formula has been estimated to average 0.062 mg/L or less (Borschel, 1995). Deficiency symptoms were not observed in infants receiving other formula preparations containing 0.096 mg/L of B6, which is equivalent to an intake of 0.075 mg/day (Borschel, 1995). This level of intake is similar to the AI of 0.1 mg suggested from normal intakes and raises questions about whether an AI of 0.1 mg, which appears to be adequate on the basis of normal human milk intakes, may be slightly low. Although it is not possible to set a plasma PLP cutoff value for the infant for adequate status, one would expect it to be at least that used for the adult, if not higher. The drop in plasma PLP concentrations to 32 nmol/L, reported above, in 1-month-old infants of mothers supplemented with B6 suggests that plasma PLP values are somewhat lower than 32 nmol/L in breastfed infants of mothers who are not supplemented. These data also suggest that the infant fed human milk does not have a large reservoir of B6.
Other studies, however, have reported higher plasma PLP concentrations in infants of unsupplemented mothers. Andon and colleagues (1989) reported an average human milk B6 content of 0.12
mg/L in mothers with average dietary intakes of 1.4 mg of B6. The plasma PLP in the infants of these mothers averaged 54 nmol/L.
A plasma PLP concentration of 15 nmol/L was reported for a full-term infant experiencing B6-responsive convulsions (Kirksey and Roepke, 1981). This is the only report of a plasma PLP concentration in an infant experiencing convulsions, and the possibility could not be excluded that other factors or a B6-dependency syndrome contributed to the convulsions.
Ages 7 through 12 Months. If the reference body weight ratio method described in Chapter 2 to extrapolate from the AI for B6 for infants ages 0 through 6 months is used, the AI for the older infants would be 0.2 mg/day after rounding. The second method (see Chapter 2), extrapolating from the Estimated Average Requirement (EAR) for adults and adjusting for the expected variance to estimate a recommended intake, gives an AI for B6 of 0.4 mg/day, a value that is higher than that obtained from the first method. Because the AI for the young infants appears to be close to the requirement on the basis of studies mentioned in this section, the AI for B6 is set at 0.3 mg/day for infants ages 7 through 12 months— as the mean obtained from the two types of extrapolation.
B6AI Summary, Ages 0 through 12 Months
|
AI for Infants |
||
|
0–6 months |
0.1 mg/day of vitamin B6 |
≈0.014 mg/kg |
|
7–12 months |
0.3 mg/day of vitamin B6 |
≈0.033 mg/kg |
Special Considerations
Infant formula typically provides much higher levels of B6 to the infant than does human milk (Borschel et al., 1986), and formula-fed infants have higher PLP concentrations and lower erythrocyte aspartate aminotransferase (α-EAST) values than do infants fed human milk (Heiskanen et al., 1994).
Children and Adolescents Ages 1 through 18 Years
Evidence Considered in Estimating the Average Requirement
Information on the B6 requirements of children and of adolescents is too limited for an EAR to be established directly. For exam-
ple, the few studies assessing intakes and 4-pyridoxic acid (4-PA) excretion are not useful for determining a requirement.
A recent study that tracked some B6 status indicators from children aged 2 months to 11 years (Heiskanen et al., 1995) demonstrated a gradual decrease in erythrocyte PLP with age, similar to that previously reported for plasma PLP (Hamfelt and Tuvemo, 1972), and an increased erythrocyte α-EAST. Interestingly, there was a tendency for those at the lowest percentiles of values to remain so over this period, which could reflect a genetic component, diet, or both. The setting of normal ranges for B6 status indicators is complicated by age-dependent changes in these indicators.
A few studies have investigated indicators of B6 status in preschool children and adolescents. Fries and coworkers (1981) measured plasma PLP concentrations in 35 boys and girls aged 3 and 4 years. Average food intakes of B6 ranged from 0.9 mg in the 4-year-old boys to 1.3 mg in the 3-year-old boys. Some of the children received additional supplements. The average plasma PLP concentrations in unsupplemented children ranged from 58 to 78 nmol/L in the different groups, and the supplemented children had higher concentrations. This suggests that nonsupplemented intakes were considerably above an EAR level (if it could be determined), but it is not possible to set an EAR on the basis of these data.
Kirksey and colleagues (1978) studied the nutritional status of 12-to 14-year-old female adolescents. Thirteen percent of the subjects were judged to have inadequate B6 status as assessed by erythrocyte alanine aminotransferase (α-EALT) ratios with average dietary B6 intakes estimated to be 1.24 mg. Driskell and colleagues (1985) studying 12-, 14-, and 16-year-old adolescent girls reported 20 percent with marginal B6 status and 13 percent with B6 deficiency as indicated by abnormal α-EALT ratios. Daily dietary B6 intakes in these groups averaged about 1.2 mg. In a follow-up longitudinal assessment of 12- and 14-year-old adolescent girls, Driskell and colleagues (1987) reported a prevalence of about 20 percent B6 deficiency and almost 30 percent marginal deficiency with average dietary intakes of 1.25 mg B6, again as assessed by α-EALT ratios. Although these data may suggest an EAR for adolescents somewhat below 1.2 mg, a number of concerns limit the usefulness of these data for deriving an EAR. As indicated previously, cutoff α-EALT ratios for B6 deficiency have not been correlated with any clinical indicator of deficiency, and considerable variation in α-EALT ratios has been reported (Leklem, 1990). In addition, in the Driskell et al. (1985) study, the data were stratified by supplement intake ranging from less than 1 mg to greater than 3.5 mg. In each group about 60
percent of the subjects had adequate B6 status as determined by α-EALT whereas the percentages of subjects with marginal and with deficient status were essentially identical. This seriously calls into question the appropriateness of using α-EALT ratios for assessing B6 status.
In the absence of additional information, EARs and RDAs for these age groups have been estimated by using the method described in Chapter 2 and then extrapolating from adult values. For comparative purposes the requirement was also estimated by assuming that there is a direct relationship between protein intake and the B6 requirement. The results of applying that method to data on protein intake from the Third National Health and Nutrition Examination Survey for children were judged to be unreasonably high. (See also the previous discussion about the protein-B6 relationship.) As with adults, there is no compelling evidence to suggest that requirements within any of these age groups should be adjusted based on protein intake.
B6EAR and RDA Summary, Ages 1 through 18 Years
|
EAR for Children |
1–3 years |
0.4 mg/day of vitamin B6 |
|
|
4–8 years |
0.5 mg/day of vitamin B6 |
|
EAR for Boys |
9–13 years |
0.8 mg/day of vitamin B6 |
|
|
14–18 years |
1.1 mg/day of vitamin B6 |
|
EAR for Girls |
9–13 years |
0.8 mg/day of vitamin B6 |
|
|
14–18 years |
1.0 mg/day of vitamin B6 |
The RDA for B6 is set by assuming a coefficient of variation (CV) of 10 percent (see Chapter 1) because information is not available on the standard deviation of the requirement for B6; the RDA is defined as equal to the EAR plus twice the CV to cover the needs of 97 to 98 percent of the individuals in the group (therefore, for B6 the RDA is 120 percent of the EAR).
|
RDA for Children |
1–3 years |
0.5 mg/day of vitamin B6 |
|
|
4–8 years |
0.6 mg/day of vitamin B6 |
|
RDA for Boys |
9–13 years |
1.0 mg/day of vitamin B6 |
|
|
14–18 years |
1.3 mg/day of vitamin B6 |
|
RDA for Girls |
9–13 years |
1.0 mg/day of vitamin B6 |
|
|
14–18 years |
1.2 mg/day of vitamin B6 |
Adults Ages 19 through 50 Years
Men Ages 19 through 50 Years
Evidence Considered in Estimating the Average Requirement. The initial studies on B6 requirements of young men are not very useful for determining an EAR because of the small number of repletion intakes. Most of these studies used the tryptophan load test to determine status. In a repletion study by Baker and colleagues (1964), eight young men on a diet containing 30 g/day of protein required 1.25 mg of PN (equivalent to 1.5 mg of food B6) to return tryptophan metabolite excretion back to baseline after a 10-g tryptophan challenge dose, whereas subjects on a 100-g protein diet needed 1.5 mg of PN (equivalent to 1.9 mg of food B6). This suggests an EAR considerably lower than 1.25 or 1.5 mg. Yess and coworkers (1964) placed six subjects on a diet containing 0.16 mg of PN and 100 g of protein for 55 days and investigated various tryptophan metabolites after a 2-g load. Supplementation with 0.6 or 0.9 mg of PN normalized tryptophan catabolites in nearly all the subjects, suggesting an EAR of less than 0.9 mg of PN (equivalent to less than 1.0 mg adjusted for food B6).
Miller and Linkswiler (1967) measured tryptophan metabolites in 11 men receiving a basal diet containing 0.16 mg of PN and 54 or 150 g of protein. Over a 40-day period there was a slow increase in the excretion of tryptophan catabolites. The addition of 0.6 mg of B6 corrected tryptophan catabolite excretion in most of the subjects, suggesting an EAR of less than 0.76 mg of PN (equivalent to less than 0.9 mg adjusted for food B6). Complete normalization was observed with 1.5 mg (1.9 mg food B6), which suggests that this level of intake exceeded the requirements of all subjects.
Linkswiler (1978) summarized a large number of early studies of men receiving various protein intakes. In subjects on a diet containing 100 g of protein, normalization of the load test required 1.0 to 1.5 mg, suggesting an EAR of considerably less than 1.0 to 1.5 mg. Miller and colleagues (1985) fed diets containing 1.6 mg of B6 (from food and food fortified with PN) and 0.5, 1.0, or 2 g/kg of protein to eight young men (21 to 31 years of age). In this study, plasma PLP remained above 30 nmol/L, suggesting that 1.5 mg was substantially higher than the EAR.
In a study by Selhub and colleagues (1993), which adjusted for folate status, gender, and age, half of the subjects consuming freely selected diets containing an average of 1.3 mg of B6 (as estimated from food frequency questionnaires and thus from food and vita-
min supplements) had plasma homocysteine concentrations that were similar to those of subjects receiving much higher intakes of the vitamin. Subjects had not fasted or received a methionine load before being evaluated. Because no value for optimal homocysteine concentrations has been established and it is not clear that there is an advantage to driving homocysteine concentrations down to the lowest possible level, this suggests an EAR of less than 1.3 mg if plasma homocysteine is used as an index of adequacy.
It is difficult to derive a precise EAR for young men because most studies have identified a B6 intake that restores test parameters to baseline values for all subjects, which may be considerably higher than that needed for health. Moreover, in most studies the levels of B6 tested appear to have been in excess of an average requirement.
B6EAR and RDA Summary, Men Ages 19 through 50 Years. The various studies suggest an average requirement that ranges from less than 0.9 mg of food B6 to considerably less than 1.9 mg. Taken together, the studies suggest an EAR of 1.1 mg/day.
|
EAR for Men |
19–30 years |
1.1 mg/day of vitamin B6 |
|
|
31–50 years |
1.1 mg/day of vitamin B6 |
The RDA for B6 is set by assuming a coefficient of variation (CV) of 10 percent (see Chapter 1) because information is not available on the standard deviation of the requirement for B6; the RDA is defined as equal to the EAR plus twice the CV to cover the needs of 97 to 98 percent of the individuals in the group (therefore, for B6 the RDA is 120 percent of the EAR).
|
RDA for Men |
19–30 years |
1.3 mg/day of vitamin B6 |
|
|
31–50 years |
1.3 mg/day of vitamin B6 |
Women Ages 19 through 50 Years
Evidence Considered in Estimating the Average Requirement. Six studies provide useful evidence about the amount of B6 required by young women. Analysis of these studies focuses on the amount required for a plasma PLP value of at least 20 nmol/L. Brown and colleagues (1975) depleted 10 young women (average age 22) on a diet that contained 0.16 mg of B6 and 78 g of protein for 28 days. The subjects were repleted with 1.0 or 2.2 mg of B6 for 28 days. During the depletion period, plasma PLP concentrations fell from about 50 to about 14 nmol/L. On the two repletion regimens they increased to
about 24 and 60 nmol/L. An EAR of just under 1.0 mg (equivalent to 1.2 mg based on food B6) can be assessed based on a PLP concentration of ≥ 20 nmol/L.
Kretsch and coworkers (1995), using a depletion-repletion approach, studied a group of eight women (aged 21 to 30 years) on a high-protein diet (1.55 g/kg of body weight) and also investigated the effects of animal protein compared to plant protein. A formula diet plus 2 mg of PN was supplied for the 7-day adjustment period to develop baseline values. The depletion diet contained less than 0.05 mg of PN and was continued for 11 to 28 days (two subjects developed electroencephalogram [EEG] abnormalities). Repletion was with 0.5, 1, 1.5, or 2 mg/day of PN for 14 to 21 days. Between 1 and 1.5 mg of PN restored PLP to baseline, and 1.5 to 2 mg of PN restored xanthurenate to baseline values. In this study, plasma PLP in the baseline period averaged 25 nmol/L, a very low value compared with most studies, and dropped to less than 10 nmol/L during depletion. Surprisingly, plasma PLP fell slightly further during the first repletion with 0.5 mg of B6. Values averaged close to 20 nmol/L on intake of 1 mg of B6, suggesting an EAR of about 1 mg (1.25 mg of food B6). Normalization of aminotransferase activation factors occurred with intakes of about 1.5 to 2 mg of B6 and lagged behind the diet changes. Activation factor values increased during the depletion period and then increased further during the first repletion period, indicating that they had not stabilized within the depletion period. No differences in response were observed when comparing the animal to the plant protein source.
In a depletion-repletion study, Huang et al. (1998) studied B6 requirements in young women (aged 28 to 34 years) fed a high-protein diet (1.55 g/kg of body weight). Subjects were fed a baseline diet (1.6 mg/day of B6 from food) for 9 days and a depletion diet (0.45 mg/day also from food) for 27 days. Repletion diets of 1.26, 1.66, and 2.06 mg of B6 were given for 21, 21, and 14 days, respectively, the additional B6 provided in the form of pyridoxine hydrochloride once daily. As would be expected for a baseline intake of 1.6 mg of B6, 1.5 to 2 mg of PN normalized plasma PLP and urinary 4-PA concentration to baseline values. No hematological or EEG abnormalities were observed during depletion, and the plasma PLP concentration was above 20 nmol/L at the end of the depletion period. With longer depletion, PLP values might have dropped more. At a B6 intake of 1.26 mg, mean PLP was 38 nmol/L. On the basis of plasma PLP, an EAR should be between the two levels tested, 0.45 and 1.26 mg, probably less than 1 mg. If suggested cutoffs for erythrocyte aminotransferase concentrations were applied to
ratios for α-EAST and α-EALT observed in the study, the EAR values would be around 1.3 mg based on α-EAST or above 1.7 mg based on α-EALT. Again, these values appear to lag with supplementation and may be overestimates.
Hansen and coworkers (1996b) investigated the effects of protein intake on B6 status in women aged 19 to 38 years. The subjects received a diet containing 1.25 mg of PN, and protein intake was 0.5, 1, or 2 g/kg of body weight. At the two lower levels of protein intake, plasma PLP remained above 30 nmol/L. For women on the highest protein intake, PLP concentrations dropped below 30 nmol/L but remained above 20 nmol/L. There was a slight elevation in tryptophan catabolites after a load, which may have been due to the increased dietary tryptophan intake. The decrease in plasma PLP with increased protein intake was accompanied by a decrease in urinary 4-PA and urinary B6, suggesting that more B6 was retained by tissues under these conditions and that a steady state may not have been reached. This also calls into question whether the decrease in plasma PLP concentrations on a high-protein intake truly reflects a decrease in B6 status. If a PLP cutoff of 20 nmol/L is applied, these studies suggest an EAR of considerably less than 1.25 mg.
Hansen and coworkers (1996a) also investigated the effects of diets low and high in PN glucoside on status indicators. Ten women (mean age 29 years) were fed two food-based diets each containing about 1.5 mg of B6 of which 9 or 27 percent was as the naturally occurring B6 glucoside. The status indicators demonstrated lower bioavailability of the glucoside, as expected, and suggested increased fecal excretion. On the low-glucoside diet, mean PLP concentrations were above 30 nmol/L, suggesting an EAR of less than 1.5 mg.
In a recent study, Hansen and coworkers (1997) investigated the B6 requirements of young women receiving 85 g/day of protein. Subjects were adapted to a basal diet containing either 1.03 or 0.84 mg of B6, which was fed for 15 days. The subjects then received three or four different levels of repletion for periods of 10 or 12 days. EAR values of less than 1.18 mg and 1.15 mg could be assessed based on plasma PLP concentrations. α-EAST ratios were in the normal range even in the basal period, which suggests an EAR of less than 0.8 mg. α-EALT was also normal in all subjects receiving the basal 0.84-mg diet, but half the subjects in the group receiving the basal 1.03-mg diet had values in the abnormal range. Although this suggests an EAR of 0.8 to 1.0 mg based on aminotransferase activation factors, these data are quite different from those reported in other studies.
Driskell and colleagues (1989) investigated the B6 status of 15 obese black adult women (21 to 51 years of age). Dietary B6 intake of the obese women and a nonobese control group averaged 1.18 mg, as assessed by dietary recall. Plasma PLP concentrations averaged 60 nmol/L in the obese group and 63 nmol/L in the control group, indicating no apparent effect of obesity on B6 status. These data do, however, suggest an EAR of considerably less than 1.2 mg for adult women.
B6EAR and RDA Summary, Women Ages 19 through 50 Years. Based on the above evidence, the average requirement of PN is less than 1.0 mg. This is adjusted to 1.1 mg for food B6.
|
EAR for Women |
19–30 years |
1.1 mg/day of vitamin B6 |
|
|
31–50 years |
1.1 mg/day of vitamin B6 |
The RDA for B6 is set by assuming a coefficient of variation (CV) of 10 percent (see Chapter 1) because information is not available on the standard deviation of the requirement for B6; the RDA is defined as equal to the EAR plus twice the CV to cover the needs of 97 to 98 percent of the individuals in the group (therefore, for B6 the RDA is 120 percent of the EAR).
|
RDA for Women |
19–30 years |
1.3 mg/day of vitamin B6 |
|
|
31–50 years |
1.3 mg/day of vitamin B6 |
Adults Ages 51 Years and Older
Evidence Considered in Estimating the Average Requirement. Studies of older individuals have been quite limited. Ribaya-Mercado and coworkers (1991) investigated B6 requirements in 12 men and women over 60 years of age who received protein intakes of 0.8 or 1.2 g/kg of body weight. Depletion and repletion B6 intakes were based on protein intake but averaged, respectively, about 0.15, 1.2, 1.8, and 2.6 mg in men and 0.1, 0.9, 1.3, and 1.9 mg in women. The source of B6 during the repletion diets was a mixture of food and pyridoxine supplements. Individuals were kept on self-selected diets for baseline studies; these diets averaged 1.6 mg of B6 for men and 1.4 mg for women. About 1.9 mg of B6 was required to reach baseline values of plasma PLP and urinary 4-PA in both men and women consuming 1.2 g protein/kg of body weight. Normalization of erythrocyte aminotransferase activation factors required higher levels of B6, but these activation factors did not stabilize during each period.
The EAR based on a plasma PLP of at least 20 nmol/L would be less than 1.3 mg (less than 1.6 mg for food B6) in men and about 0.9 mg (1.1 mg for food B6) in women. Xanthurenate excretion in nearly half the men and all the women was near the baseline value at the equivalent of a food B6 intake of 1.6 mg/day. The four subjects on the lower protein diet (0.8 g/kg of body weight) reached baseline values of plasma PLP at a lower level, 1.33 mg/day of B6, yet xanthurenate excretion did not return to baseline for some of the subjects by the end of the three repletion periods.
Selhub and colleagues (1993) investigated the relationship among plasma homocysteine, dietary B6, and plasma PLP concentration in subjects from the Framingham Heart Study aged 67 to 96 years. The data were adjusted for age, gender, and folate and B12 intakes. No clear cutoff for homocysteine has been established, but about half the subjects whose B6 intakes were 1.4 mg (and who had plasma PLP concentrations of 25 nmol/L) were in the same homocysteine range as subjects consuming much higher intakes. At a plasma PLP concentration of 20 nmol/L, homocysteine concentrations averaged about 13 µmol/L, and this corresponded to a dietary intake of about 1.3 mg B6.
Meydani and coworkers (1991) reported impairments in interleukin-2 and lymphocyte proliferation in eight healthy elderly subjects (four men and four women) placed on a B6-deficient diet of 0.3 µg/ kg body weight/day for up to 20 days (approximately 0.17 mg/day for the men and 0.10 mg/day for the women). Restoration of various parameters of cell-mediated immunity to baseline values (obtained when the subjects had been on self-selected diets) required more than 22.5 µg/kg body weight/day, the second highest repletion level tested, because most of the parameters measured returned to baseline values at the highest repletion level tested in both the men and women, which was 33.75 µg/kg body weight/day or about 2 mg/day of B6 for the women and 2.88 mg/day for the men. Some measures of immunity did not return to baseline during the study period whereas others exceeded baseline values only at very high (50 mg) B6 intakes. No indication was given as to which level of any of these parameters indicated a dysfunction in immune response. Although the changes in these parameters with B6 intake suggest they may be of potential use as indicators of B6 status, it is presently not possible to determine a requirement from these data.
B6EAR and RDA Summary, Ages 51 Years and Older. From the above studies, it appears that the EAR for B6 is higher than the EAR for younger men and women and, unlike that for younger adults, is
higher for men than for women. The increase due to age and gender appears to be approximately 0.2 to 0.3 mg of food B6/day.
|
EAR for Men |
51–70 years |
1.4 mg/day of vitamin B6 |
|
|
> 70 years |
1.4 mg/day of vitamin B6 |
|
EAR for Women |
51–70 years |
1.3 mg/day of vitamin B6 |
|
|
> 70 years |
1.3 mg/day of vitamin B6 |
The RDA for B6 is set by assuming a coefficient of variation (CV) of 10 percent (see Chapter 1) because information is not available on the standard deviation of the requirement for B6; the RDA is defined as equal to the EAR plus twice the CV to cover the needs of 97 to 98 percent of the individuals in the group (therefore, for B6 the RDA is 120 percent of the EAR).
|
RDA for Men |
51–70 years |
1.7 mg/day of vitamin B6 |
|
|
> 70 years |
1.7 mg/day of vitamin B6 |
|
RDA for Women |
51–70 years |
1.5 mg/day of vitamin B6 |
|
|
> 70 years |
1.5 mg/day of vitamin B6 |
Special Considerations
Note that the EARs (and RDAs) for adults were derived by using biochemical indicator cutoff values that have not been directly linked to clinical or physiological insufficiency. As described above, clinical symptoms of B6 deficiency have been observed only in controlled studies during depletion with very low levels of B6 and have never been seen at intakes of 0.5 mg/day or greater. This suggests that 1 mg/day is sufficient for most adults, but requirements may possibly be higher in individuals on very-high-protein diets.
Pregnancy
Evidence Considered in Estimating the Average Requirement
Concentrations of indicators of B6 status in plasma and blood decrease throughout pregnancy, especially in the third trimester (Cleary et al., 1975; Hamfelt and Tuvemo, 1972; Shane and Contractor, 1980). Many studies have demonstrated a drop in plasma PLP to about 10 nmol/L; this is substantially more than can be accounted for by increased blood volume. Fetal blood PLP concen-
trations in the second and third trimester and at term are much higher than in the mother, and significant fetal sequestration of the vitamin has been demonstrated by cord vein and artery differences (Cleary et al., 1975; Contractor and Shane, 1970; Shane and Contractor, 1980). Barnard and colleagues (1987) reported that much of the decrease in plasma PLP concentration during pregnancy is offset by increases in plasma PL, but other investigators have not observed this compensation (Contractor and Shane, 1970). Studies in animals suggest direct transport of PLP to the fetus (Contractor and Shane, 1971). In the pregnant rat about 15 percent of an intraperitoneal dose of PN is initially taken up by the uterus, placenta, and fetus.
Maintenance of plasma PLP concentrations at nonpregnant values requires about 2 mg/day of supplemental PN in the first trimester and between 4 and 10 mg/day in the third trimester (Cleary et al., 1975; Hamfelt and Tuvemo, 1972; Lumeng et al., 1976). Maintenance of other status indicators such as tryptophan metabolites at nonpregnant levels after a tryptophan load requires even higher intakes, but this test may be affected by hormonal changes (Shane and Contractor, 1980). It is not clear whether these changes in status indicators during pregnancy reflect poorer vitamin status or represent normal physiological changes during pregnancy. The latter is more reasonable. There is no a priori reason to use laboratory values for nonpregnant women as controls for pregnant women. There is also no evidence of significant problems in B6 status during pregnancy despite the reduced levels of status markers. Schuster and coworkers (1981) examined the relationship between α-EAST ratios and Apgar scores in low-income mothers receiving an average of 1.3 mg/day of B6 in the diet. A small but significant effect of B6 status was noted. However, the possibility could not be eliminated that other variables unrelated to B6 may have been responsible.
For an assumed body store of 1,000 µmol and a fetal, uterine, and placental accumulation of 15 percent, the fetus and placenta would accumulate approximately 25 mg of B6. This would be about 0.1 mg/day averaged over gestation. With additional allowances made for the increased metabolic needs and weight of the mother and about 75 percent bioavailability of food B6, an additional average need in pregnancy of 0.25 mg can be estimated. This increased need would be concentrated more in the second half of gestation. Unlike nutrients such as iron, B6 is not stored in the body to any substantial extent, so it is unlikely that a surplus in early gestation would satisfy the increased need in the latter stages of gestation.
Consequently, an extra 0.5 mg/day of B6 can be reasonably justified to meet the need in the third trimester.
B6EAR and RDA Summary, Pregnancy
Although 0.5 mg/day of B6 may overestimate the additional need in early gestation, it was considered judicious to err on the side of ensuring sufficiency and add 0.5 mg/day to the EAR for nonpregnant women throughout pregnancy. Because of the approximation involved, no additional adjustment for adolescence is included.
|
EAR for Pregnancy |
14–18 years |
1.6 mg/day of vitamin B6 |
|
|
19–30 years |
1.6 mg/day of vitamin B6 |
|
|
31–50 years |
1.6 mg/day of vitamin B6 |
The RDA for B6 is set by assuming a coefficient of variation (CV) of 10 percent (see Chapter 1) because information is not available on the standard deviation of the requirement for B6; the RDA is defined as equal to the EAR plus twice the CV to cover the needs of 97 to 98 percent of the individuals in the group (therefore, for B6 the RDA is 120 percent of the EAR).
|
RDA for Pregnancy |
14–18 years |
1.9 mg/day of vitamin B6 |
|
|
19–30 years |
1.9 mg/day of vitamin B6 |
|
|
31–50 years |
1.9 mg/day of vitamin B6 |
Lactation
Evidence Considered in Estimating the Average Requirement
As described above, the B6 concentration in human milk varies depending on the mother’s B6 intake, and some women consuming less than 2.5 mg/day of B6 produce milk with a B6 content that is not much higher than that associated with consuming formula that resulted in convulsions in infants because of low levels of B6. There is some variation in reported human milk B6 content, which may be due to methodological differences. Between individuals there are variations in milk B6 content at similar B6 intakes. Existing data previously described suggest that the amount of B6 required to increase the milk B6 content by a small increment is much higher than that increment and that the additional requirement for lactation is considerably in excess of that suggested by the amount secreted via lactation (Borschel et al., 1986; West and Kirksey, 1976).
To ensure a milk B6 concentration of 0.13 mg/L, it is estimated that about five times that amount of B6 must be consumed in addition to the EAR of 1.1 mg/day.
B6EAR and RDA Summary, Lactation
In light of the evidence that low maternal intakes could lead to compromised B6 status in the infant (Borschel, 1995), it would be prudent to add 0.6 mg of B6 to the EAR of 1.1 mg for nonpregnant women, giving an EAR for lactation of 1.7 mg/day of B6. Because this is an approximation based on a number of assumptions, no adjustment is made for adolescent females who are lactating.
|
EAR for Lactation |
14–18 years |
1.7 mg/day of vitamin B6 |
|
|
19–30 years |
1.7 mg/day of vitamin B6 |
|
|
31–50 years |
1.7 mg/day of vitamin B6 |
The RDA for B6 is set by assuming a coefficient of variation (CV) of 10 percent (see Chapter 1) because information is not available on the standard deviation of the requirement for B6; the RDA is defined as equal to the EAR plus twice the CV to cover the needs of 97 to 98 percent of the individuals in the group (therefore, for B6 the RDA is 120 percent of the EAR).
|
RDA for Lactation |
14–18 years |
2.0 mg/day of vitamin B6 |
|
|
19–30 years |
2.0 mg/day of vitamin B6 |
|
|
31–50 years |
2.0 mg/day of vitamin B6 |
INTAKE OF VITAMIN B6
Food Sources
Data obtained from the 1995 Continuing Survey of Food Intakes by Individuals indicates that the greatest contribution to vitamin B6 intake of the U.S. adult population comes from fortified, ready-to-eat cereals; mixed foods (including sandwiches) with meat, fish, or poultry as the main ingredient; white potatoes and other starchy vegetables; and noncitrus fruits (Table 7-1). Especially rich sources are highly fortified cereals; beef liver and other organ meats; and highly fortified, soy-based meat substitutes.
TABLE 7-1 Food Groups Providing Vitamin B6 in the Diets of U.S. Men and Women Aged 19 Years and Older, CSFII, 1995a
|
|
Contribution to Total Vitamin B6 Intakeb (%) |
Foods Within the Group that Provide at Least 0.4 mg of Vitamin B6c per Serving |
||
|
Food Group |
Men |
Women |
0.4–0.8 mg |
> 0.8 mg |
|
Food groups providing at least 5% of total vitamin B6intake |
||||
|
Ready-to-eat cereals |
10.8 |
13.7 |
Moderately fortified |
Highly fortified |
|
Mixed foodsd |
10.1 |
8.6 |
NAe |
NA |
|
White potatoes and other starchy vegetablesf |
9.7 |
9.2 |
White potato with peel and plantain |
— |
|
Non-citrus fruitsg |
7.0 |
9.5 |
Bananas and watermelon |
— |
|
Poultryh |
6.9 |
7.1 |
Chicken breast, turkey light meat, and Cornish game hen |
— |
|
Beef |
6.4 |
4.2 |
— |
— |
|
Mixed foods, main ingredient is grain |
5.4 |
4.8 |
NA |
NA |
|
Other vegetablesi |
4.1 |
4.6 |
— |
— |
|
Vitamin B6from other food groups |
||||
|
Organ meats |
0.2 |
0.2 |
Calf, chicken, or pork liver and kidney |
Beef liver |
|
Soy-based supplements and meal replacements |
0.7 |
0.2 |
Some soy-based meat substitutes |
Some soy-based meat substitutes |
|
Pasta, rice, and cooked cereals |
3.2 |
3.3 |
— |
Fortified instant oatmeal |
|
Finfish |
1.2 |
1.7 |
Fresh tuna and trout |
— |
|
Deep yellow vegetables |
0.8 |
1.2 |
Sweet potatoes with peel |
— |
|
a CSFII = Continuing Survey of Food Intakes by Individuals. b Contribution to total intake reflects both the concentration of the nutrient in the food and the amount of the food consumed. It refers to the percentage contribution to the American diet for both men and women, based on 1995 CSFII data. c 0.4 mg = 20% of the Recommended Daily Intake (2.0 mg) of B6—a value set by the Food and Drug Administration. d Includes sandwiches and other foods with meat, poultry, or fish as the main ingredient. e NA = not applicable. Mixed foods were not considered for this table. |
||||
Dietary Intake
Data from nationally representative U.S. surveys (Appendixes G and H) indicate that the median daily intake of B6 by men is approximately 2 mg/day and the median intake by women is approximately 1.5 mg/day. Groups having low B6 intakes are shown in Table 7-2.
A survey done in one Canadian province reported that the dietary intake of B6 by both men and women is slightly lower than intakes in the United States (Appendix I). The Boston Nutritional Status Survey (Appendix F) indicates that this relatively advantaged group of people over age 60 reported a median B6 intake of 1.2 mg/day for men and 1.0 mg/day for women.
TABLE 7-2 Life Stage and Gender Groups in the United States with Reported Vitamin B6 Intake Less than the Estimated Average Requirement (EAR)
|
Life Stage and Gender Group |
Individuals Below the EAR (%) |
|
Males, 51+y |
10–25 |
|
Women, 14–18 y |
10–15 |
|
Women, 19–50 y |
15 |
|
Women, 51+y |
25–50 |
|
Pregnant women (all ages) |
25–50 |
|
Lactating women (all ages) |
10–15 |
|
NOTE: See Table G-4 in Appendix D for vitamin B6 intake data by category and percentile from the Continuing Survey of Food Intakes by Individuals, 1994–1995. |
|
Intake from Supplements
Information from the Boston Nutritional Status Survey on use of B6 supplements by a free-living elderly population is given in Appendix F. For those reporting use of supplements, the fiftieth percentile of supplemental B6 intake was 2.2 mg for both men and women. Approximately 26 percent of all adults reported taking a B6-containing supplement in 1986 (Moss et al., 1989).
TOLERABLE UPPER INTAKE LEVELS
Hazard Identification
Adverse Effects
No adverse effects have been associated with high intake of vitamin B6 from food sources. This review focuses on pyridoxine, the form of B6 that was consumed in the reports cited below. Large oral supplemental doses of pyridoxine used to treat many conditions, including carpal tunnel syndrome and premenstrual syndrome, have been associated with the development of sensory neuropathy and dermatological lesions (Cohen and Bendich, 1986; Schaumburg and Berger, 1988). The causal association between high-dose pyridoxine and neuropathy has been well documented in animals since 1940 (Unna and Antopol, 1940) and in humans since 1983 (Schaumburg et al., 1983).
Sensory Neuropathy. The first clinical report of pyridoxine-induced neurotoxicity in humans (Schaumburg et al., 1983) describes seven patients (five women and two men) with severe sensory neuropathy of the extremities after 2,000 to 6,000 mg/day of pyridoxine for 2 to 40 months. Four individuals were unable to walk. Neurological signs and symptoms were diagnosed through objective neurological assessment and improved in all patients after withdrawal of medication. Other reports of peripheral sensory neuropathy associated with high-dose pyridoxine therapy (1 to 4 g/day) appeared in the 1980s (Baer, 1984; Bredesen and Parry, 1984; De Zegher et al., 1985; Friedman et al., 1986). The pathogenesis of pyridoxine-induced peripheral sensory neuropathy and dose-response relationships have been well-described in animal models (Phillips et al., 1978; Schaeppi and Krinke, 1985). Review of the limited data involving lower pyridoxine doses (Bernstein and Lobitz, 1988; Del Tredici et al., 1985)
reveals that the risk of developing sensory neuropathy decreases quite rapidly at doses below 1 g/day.
Other Adverse Effects. Painful and disfiguring dermatological lesions were reported in humans after consumption of 2 to 4 g/day of pyridoxine for more than 1 year (Friedman et al., 1986; Schaumburg and Berger, 1988). However, the limited data fail to demonstrate a relationship between this endpoint and the dose or duration of treatment. Also, the mechanism of pyridoxine dermatoses remains unclear (Schaumburg and Berger, 1988).
There are isolated, uncontrolled case reports of congenital defects (Donaldson and Bury, 1982; Gardner et al., 1985; Philpot et al., 1995) and B6 dependency (Hunt et al., 1954) in newborns whose mothers were treated with pyridoxine during the first half of pregnancy. No controlled data in humans were found that confirm these findings. Observational data in women taking up to 200 mg/day of pyridoxine orally (Ellis, 1987; Weinstein et al., 1944) and up to 100 mg/day of pyridoxine parenterally (Dorsey, 1949; Hart and McConnell, 1943; Weinstein et al., 1944; Willis et al., 1942) during the first trimester of pregnancy report no adverse effects. Controlled studies in animals (Hendrickx et al., 1985; Khera, 1975; Schumacher et al., 1965) show no evidence of teratogenicity.
Very high pyridoxine doses (200 to 600 mg/day parenterally; 600 mg/day orally) after delivery have been used to successfully inhibit or suppress lactation (Foukas, 1973; Marcus, 1975; Scaglione and Vecchione, 1982). However, the results of other clinical trials on the antilactogenic effect of pyridoxine are conflicting (Scaglione and Vecchione, 1982). No evidence of antilactogenic effects at lower oral doses was found.
Summary
On the basis of considerations of causality, relevance, and the quality and completeness of the database, sensory neuropathy was selected as the critical endpoint on which to base a Tolerable Upper Intake Level (UL). The data fail to demonstrate a causal association between pyridoxine intake and other endpoints reviewed (e.g., dermatological lesions and B6 dependency in newborns).
Dose-Response Assessment
Adults
Data Selection. Studies involving long-term oral administration of pyridoxine at doses of less than 1 g/day (Berger and Schaumburg, 1984; Bernstein and Lobitz, 1988; Dalton, 1985; Dalton and Dalton, 1987; Del Tredici et al., 1985; Parry and Bredesen, 1985) were considered more relevant for deriving a UL than studies involving short-term or single-dose intake, parenteral administration, or supplemental doses greater than 1 g/day.
Identification of a No-Observed-Adverse-Effect Level (NOAEL) and a Lowest-Observed-Adverse-Effect Level (LOAEL). A NOAEL of 200 mg/day can be identified by a critical evaluation of two studies (Bernstein and Lobitz, 1988; Del Tredici et al., 1985). Bernstein and Lobitz (1988) treated 70 patients with diabetic neuropathy or carpal tunnel syndrome with 100 to 150 mg/day of pyridoxine—some for up to 5 years. Despite rigorous neurological examination and testing, sensory neuropathy was not detected in any of these patients. Similarly, Del Tredici and colleagues (1985) reported on 24 patients treated for carpal tunnel syndrome with pyridoxine at doses of 100 to 300 mg/day for 4 months. A NOAEL of 200 mg/day represents the average of 100 and 300 mg/day.
Additional investigations report no neuropathy in hundreds of individuals given pyridoxine doses of 40 to 500 mg/day (Brush et al., 1988; Ellis et al., 1979; Mitwalli et al., 1984; Tolis et al., 1977). Although these studies were not as carefully executed or reported as the study by Bernstein and Lobitz (1988), they provide supportive evidence for a NOAEL of 200 mg/day.
A LOAEL of 500 mg/day was identified from a case report by Berger and Schaumburg (1984). These investigators reported that a 34-year-old woman who had been taking 200 mg/day of pyridoxine for 2 years without adverse effects developed sensory neuropathy when she increased her daily dose to 500 mg supplemented occasionally with a 300-mg dose once a week. Another report by Schaumburg and coworkers (1983) showed severe sensory neuropathy in seven adults after pyridoxine intakes that started at 50 to 100 mg/day and were steadily increased to 2 to 6 g/day over 2 to 40 months. None of these patients experienced signs or symptoms at doses of less than 2 g/day.
Several reports show sensory neuropathy at doses lower than 500 mg/day. Tabulated data in the report by Parry and Bredesen (1985)
show that two patients who took 500 mg/day of pyridoxine for 8 and 36 months developed sensory neuropathy and as did one patient who took 100 to 200 mg/day for 36 months. This finding conflicts with the weight of evidence showing that daily doses in the range of 100 to 200 mg are not associated with the development of this condition. It is not clear from the report whether the neurological symptoms of the patient taking 100 to 200 mg/day were confirmed by a clinical neurological examination. The report notes that clinical neurological examinations were performed on about half of the patients. In addition, the report notes that electrophysiological studies were performed on seven patients and sural nerve biopsies were performed on two patients. It is not clear from the report which patients were examined clinically and which received additional tests. A local television report publicizing this syndrome before the study may have biased the selection of patients and reporting of neurological symptoms.
Two additional studies that report sensory neuropathy at doses of less than 200 mg/day (Dalton, 1985; Dalton and Dalton, 1987) warrant examination. In a letter to the editor, Dalton (1985) reported sensory neuropathy (characterized as burning, shooting, and tingling pains; paresthesia of limbs; clumsiness, ataxia; or perioral numbness) in 23 of 58 women (40 percent) being treated with 50 to 300 mg/day of pyridoxine for premenstrual syndrome. This case report contains methodological flaws including lack of information on the duration of treatment, use of other medications or herbal preparations, and lack of confirmatory information on actual doses consumed.
In a subsequent publication, which may have included patients from the earlier case report (Dalton, 1985), Dalton and Dalton (1987) retrospectively studied 172 women who were attending a private practice specializing in premenstrual syndrome and who were reported to have taken 50 to 500 mg/day of pyridoxine. The subjects were divided into two groups: 103 women who complained of neurological symptoms and 69 who did not. Neurological symptoms were not adequately detailed in this study. In addition, the actual doses may be underestimated because the patients were also taking vitamin supplements. In summary, the weaknesses of this study and the inconsistency of the results with the weight of evidence pertaining to the safety of higher doses of pyridoxine rule out the use of these data to determine a UL.
Uncertainty Assessment. An uncertainty factor (UF) of 2 was selected based on the limitations of the data involving pyridoxine doses of less than 500 mg/day.
Derivation of a UL. The NOAEL of 200 mg/day was divided by the UF of 2 to obtain a UL of 100 mg/day for adults:
B6UL Summary, Ages 19 Years and Older
|
UL for Adults |
|
|
19 years and older |
100 mg/day of vitamin B6as pyridoxine |
Other Life Stage Groups
Some concern for pregnant and lactating women could arise from the data available in the literature on congenital defects, B6 dependency, and antilactogenic effects (Donaldson and Bury, 1982; Foukas, 1973; Gardner et al., 1985; Hunt et al., 1954; Marcus, 1975; Philpot et al., 1995; Scaglione and Vecchione, 1982). Scientifically based, controlled studies designed to assess the potential adverse effects of pyridoxine intake by pregnant and lactating women are lacking. As noted above, the weight of the evidence from controlled studies in animals during pregnancy reveals no adverse effects related to teratogenicity, and the evidence from humans reveals no adverse effects from intakes up to 200 mg/day. Therefore, a UL of 100 mg/day was set for pregnant and lactating women as well. The ULs for children and adolescents were calculated from the UL for adults by using the method described in Chapter 3; this method adjusts for body size.
B6UL Summary, Ages 1 through 18 Years, Pregnancy, Lactation
|
UL for Infants |
|
|
0–12 months |
Not possible to establish; source of intake should be formula and food only |
|
UL for Children |
|
|
1–3 years |
30 mg/day of vitamin B6as pyridoxine |
|
4–8 years |
40 mg/day of vitamin B6as pyridoxine |
|
9–13 years |
60 mg/day of vitamin B6as pyridoxine |
|
UL for Adolescents |
|
|
14–18 years |
80 mg/day of vitamin B6as pyridoxine |
|
UL for Pregnancy |
|
|
14–18 years |
80 mg/day of vitamin B6as pyridoxine |
|
19 years and older |
100 mg/day of vitamin B6as pyridoxine |
|
UL for Lactation |
|
|
14–18 years |
80 mg/day of vitamin B6as pyridoxine |
|
19 years and older |
100 mg/day of vitamin B6as pyridoxine |
Special Considerations
A review of the literature failed to identify special subgroups that are distinctly susceptible to sensory neuropathy after excess pyridoxine intake.
Intake Assessment
Based on data from the Third National Health and Nutrition Survey (Appendix H), 9 mg/day was the highest mean intake of B6 from food and supplements reported for any life stage and gender group; this was the reported intake of pregnant females aged 14 through 55 years. The highest reported intake at the ninety-fifth percentile was 21 mg/day in pregnant females aged 14 through 55 years, most of which is pyridoxine from supplements. B6 (pyridoxine) is available over the counter in many dosages ranging up to 100 mg or more.
Risk Characterization
The risk of adverse effects resulting from excess intake of B6 from food and supplements appears to be very low at the highest intakes noted above. Increased risks are likely to result from large intakes of PN used to treat conditions such as carpal tunnel syndrome, painful neuropathies, seizures, premenstrual syndrome, asthma, and sickle cell disease. The UL is not meant to apply to individuals who are being treated with PN under close medical supervision.
RESEARCH RECOMMENDATIONS FOR VITAMIN B6
Priority should be given to studies useful for setting Estimated Average Requirements (EARs) for vitamin B6 for children, adolescents, pregnant and lactating women, and the elderly. Future studies should be designed around the EAR paradigm, use graded levels of nutrient intake and clearly defined cutoff values for clinical adequacy and inadequacy, and be conducted for a sufficient duration. To do this, close attention should be given to the identification of indicators on which to base B6 requirements.
REFERENCES
Andon MB, Reynolds RD, Moser-Veillon PB, Howard MP. 1989. Dietary intake of total and glycosylated vitamin B6 and the vitamin B6 nutritional status of unsupplemented lactating women and their infants. Am J Clin Nutr 50:1050– 1058.
Baer RL. 1984. Cutaneous skin changes probably due to pyridoxine abuse. J Am Acad Dermatol 10:527–528.
Baker EM, Canham JE, Nunes WT, Sauberlich HE, McDowell ME. 1964. Vitamin B6 requirement for adult men. Am J Clin Nutr 15:59–66.
Barnard HC, de Kock JJ, Vermaak WJ, Potgieter GM. 1987. A new perspective in the assessment of vitamin B6 nutritional status during pregnancy in humans. J Nutr 117:1303–1306.
Berger A, Schaumburg HH. 1984. More on neuropathy from pyridoxine abuse. N Engl J Med 311:986–987.
Bernstein AL, Lobitz CS. 1988. A clinical and electrophysiologic study of the treatment of painful diabetic neuropathies with pyridoxine. In: Leklem JE, Reynolds RD, eds. Clinical and Physiological Applications of Vitamin B6. Current Topics in Nutrition and Disease. New York: Alan R.Liss. Pp. 415–423.
Bessey OA, Adam DJ, Hansen AE. 1957. Intake of vitamin B6 and infantile convulsions: A first approximation of requirements of pyridoxine in infants. Pediatrics 20:33–44.
Bhagavan HN. 1985. Interaction between vitamin B6 and drugs. In: Reynolds RD, Leklem JE, eds. Vitamin B6: Its Role in Health and Disease. New York: Liss. Pp. 401–415.
Bhagavan HN, Coleman M, Coursin DB. 1975. The effect of pyridoxine hydrochloride on blood serotonin and pyridoxal phosphate contents in hyperactive children. Pediatrics 55:437–441.
Borschel MW. 1995. Vitamin B6 in infancy: Requirements and current feeding practices. In: Raiten DJ, ed. Vitamin B6Metabolism in Pregnancy, Lactation and Infancy. Boca Raton, FL: CRC Press. Pp. 109–124.
Borschel MW, Kirksey A, Hanneman RE. 1986. Effects of vitamin B6 intake on nutriture and growth of young infants. Am J Clin Nutr 43:7–15.
Brattstrom LE, Israelsson B, Norrving B, Bergkvist D, Thorne J, Hultberg B, Hamfelt A. 1990. Impaired homocysteine metabolism in early-onset cerebral and peripheral occlusive arterial disease. Effects of pyridoxine and folic acid treatment. Atherosclerosis 81:51–60.
Bredesen E, Parry GJ. 1984. Pyridoxine neuropathy. Neurology 34:136.
Brophy MH, Siiteri PK. 1975. Pyridoxal phosphate and hypertensive disorders of pregnancy. Am J Obstet Gynecol 121:1075–1079.
Brown RR, Rose DP, Leklem JE, Linkswiler H, Anand R. 1975. Urinary 4-pyridoxic acid, plasma pyridoxal phosphate, and erythrocyte aminotransferase levels in oral contraceptive users receiving controlled intakes of vitamin B6. Am J Clin Nutr 28:10–19.
Brush MG, Bennett T, Hansen K. 1988. Pyridoxine in the treatment of premenstrual syndrome: A retrospective survey in 630 patients. Br J Clin Pract 42:448– 452.
Brussaard JH, Lowik MR, van den Berg H, Brants HA, Bemelmans W. 1997a. Dietary and other determinants of vitamin B6 parameters. Eur J Clin Nutr 51:S39– S45.
Brussaard JH, Lowik MR, van den Berg H, Brants HA, Kistemaker C. 1997b. Micronutrient status, with special reference to vitamin B6. Eur J Clin Nutr 51:S32– S38.
Canham JE, Nunes WT, Eberlin EW. 1964. Electroencephalographic and central nervous system manifestations of vitamin B6 deficiency and induced vitamin B6 dependency in normal human adults. In: Proceedings of the Sixth International Congress on Nutrition. Edinburgh: E & S Livingstone.
Cleary RE, Lumeng L, Li TK. 1975. Maternal and fetal plasma levels of pyridoxal phosphate at term: Adequacy of vitamin B6 supplementation during pregnancy. Am J Obstet Gynecol 121:25–28.
Coburn SP. 1990. Location and turnover of vitamin B6 pools and vitamin B6 requirements of humans. Ann NY Acad Sci 585:76–85.
Coburn SP, Mahuren JD, Szadkowska Z, Schaltenbrand WE, Townsend DW. 1987. Kinetics of vitamin B6 metabolism examined in minature swine by continuous administration of labelled pyridoxine. In: Canolty NL, Caine TP, eds. Proceedings of the 1985 Conference on Mathematical Models in Experimental Nutrition. Athens: University of Georgia. Pp. 99–111.
Coburn SP, Lewis DL, Fink WJ, Mahuren JD, Schaltenbrand WE, Costill DL. 1988a. Human vitamin B6 pools estimated through muscle biopsies. Am J Clin Nutr 48:291–294.
Coburn SP, Mahuren JD, Kennedy MS, Schaltenbrand WE, Sampson DA, O’Connor DK, Snyder DL, Wostmann BS. 1988b. B6 vitamin content of rat tissues measured by isotope tracer and chromatographic methods. Biofactors 1:307–312.
Cohen M, Bendich A. 1986. Safety of pyridoxine—A review of human and animal studies. Toxicol Lett 34:129–139.
Contractor SF, Shane B. 1968. Estimation of vitamin B6 compounds in human blood and urine. Clin Chim Acta 21:71–77.
Contractor SF, Shane B. 1970. Blood and urine levels of vitamin B6 in the mother and fetus before and after loading of the mother with vitamin B6. Am J Obstet Gynecol 107:635–640.
Contractor SF, Shane B. 1971. Metabolism of [14C] pyridoxol in the pregnant rat. Biochim Biophys Acta 230:127–136
Coursin DB. 1954. Convulsive seizures in infants with pyridoxine-deficient diet. JAMA 154:406–408.
Crozier PG, Cordain L, Sampson DA. 1994. Exercise-induced changes in plasma vitamin B-6 concentrations do not vary with exercise intensity. Am J Clin Nutr 60:552–558.
Dakshinamurti K, ed. 1990. Vitamin B6. Ann NY Acad Sci 585:1–570.
Dakshinamurti K, Stephens MC. 1969. Pyridoxine deficiency in the neonatal rat. J Neurochem 6:1515–1522.
Dakshinamurti K, Sharma SK, Sundaram M. 1991. Domoic acid induced seizure activity in rats. Neurosci Lett 127:193–197.
Dakshinamurti K, Sharma SK, Sundaram M, Watanabe T. 1993. Hippocampal changes in developing postnatal mice following intrauterine exposure to domoic acid. J Neurosci 13:4486–4495.
Dalton K. 1985. Pyridoxine overdose in premenstrual syndrome. Lancet 1168–1169.
Dalton K, Dalton MJT. 1987. Characteristics of pyridoxine overdose neuropathy syndrome. Acta Neurol Scand 76:8–11.
Del Tredici AM, Bernstein AL, Chinn K. 1985. Carpal tunnel syndrome and vitamin B6 therapy. In: Reynolds RD, Leklem JE, eds. Vitamin B6: Its Role in Health and Disease. Current Topics in Nutrition and Disease. New York: Alan R.Liss. Pp. 459–462.
De Zegher F, Przyrembel H, Chalmers RA, Wolff ED, Huijmans JG. 1985. Successful treatment of infantile type I primary hyperoxaluria complicated by pyridoxine toxicity. Lancet 17:392–393.
Donaldson GL, Bury RG. 1982. Multiple congenital abnormalities in a newborn boy associated with maternal use of fluphenazine enanthate and other drugs during pregnancy. Acta Paediatr Scand 71:335–338.
Dorsey CW. 1949. The use of pyridoxine and suprarenal cortex combined in the treatment of the nausea and vomiting of pregnancy. Am J Obstet Gynecol 58:1073–1078.
Dreon DM, Butterfield GE. 1986. Vitamin B6 utilization in active and inactive young men. Am J Clin Nutr 43:816–824.
Driskell JA, Moak SW. 1986. Plasma pyridoxal phosphate concentrations and coenzyme stimulation of erythrocyte alanine aminotransferase activities of white and black adolescent girls. Am J Clin Nutr 43:599–603.
Driskell JA, Clark AJ, Bazzarre TL, Chopin LF, McCoy H, Kenney MA, Moak SW. 1985. Vitamin B6 status of southern adolescent girls. J Am Diet Assoc 85:46–49.
Driskell JA, Clark AJ, Moak SW. 1987. Longitudinal assessment of vitamin B6 status in Southern adolescent girls. J Am Diet Assoc 87:307–310.
Driskell JA, McChrisley B, Reynolds LK, Moak SW. 1989. Plasma pyridoxal 5'-phosphate concentrations in obese and nonobese black women residing near Petersburg, VA. Am J Clin Nutr 50:37–40.
Ellis JM. 1987. Treatment of carpal tunnel syndrome with vitamin. South Med J 80:882–884.
Ellis J, Folkers K, Watanabe T, Kaji M, Saji S, Caldwell JW, Temple CA, Wood FS. 1979. Clinical results of a cross-over treatment with pyridoxine and placebo of the carpal tunnel syndrome. Am J Clin Nutr 32:2040–2046.
Fogelholm M. 1992. Micronutrient status in females during a 24-week fitness-type exercise program. Ann Nutr Metab 36:209–218.
Fonda ML, Trauss C, Guempel UM. 1991. The binding of pyridoxal 5'-phosphate to human serum albumin. Arch Biochem Biophys 288:79–86.
Foukas MD. 1973. An antilactogenic effect of pyridoxine. J Obstet Gynaecol Br Commonw 80:718–720.
Friedman MA, Resnick JS, Baer RL. 1986. Subepidermal vesicular dermatosis and sensory peripheral neuropathy caused by pyridoxine abuse. J Am Acad Dermatol 14:915–917.
Fries ME, Chrisley BM, Driskell JA. 1981. Vitamin B6 status of a group of preschool children. Am J Clin Nutr 34:2706–2710.
Gardner LI, Welsh-Sloan J, Cady RB. 1985. Phocomelia in infant whose mother took large doses of pyridoxine during pregnancy. Lancet 1:636.
Gaynor R, Dempsey WB. 1972. Vitamin B6 enzymes in normal and pre-eclamptic human placentae. Clin Chim Acta 37:411–416.
Grabow JD, Linkswiler H. 1969. Electroencephalographic and nerve-conduction studies in experimental vitamin B6 deficiency in adults. Am J Clin Nutr 22:1429– 1434 .
Gregory JF 3rd. 1997. Bioavailability of vitamin B6. EUT J Clin Nutr 51:S43-S48.
Guilarte TR. 1993. Vitamin B6 and cognitive development: Recent research findings from human and animal studies. Nutr Rev 51:193–198.
Hamfelt A, Tuvemo T. 1972. Pyridoxal phosphate and folic acid concentration in blood and erythrocyte aspartate aminotransferase activity during pregnancy. Clin Chin Acta 41:287–298.
Hamm MW, Mehansho H, Henderson LM. 1979. Transport and metabolism of pyridoxamine and pyridoxamine phosphate in the small intestine of the rat. J Nutr 109:1552–1559.
Hansen CM, Leklem JE, Miller LT. 1996a. Vitamin B-6 status indicators decrease in women consuming a diet high in pyridoxine glucoside. J Nutr 126:2512–2518.
Hansen CM, Leklem JE, Miller LT. 1996b. Vitamin B-6 status of women with a constant intake of vitamin B-6 changes with three levels of dietary protein. J Nutr 126:1891–1901.
Hansen CM, Leklem JE, Miller LT. 1997. Changes in vitamin B-6 status indicators of women fed a constant protein diet with varying levels of vitamin B-6. Am J Clin Nutr 66:1379–1387.
Hart BF, McConnell WT. 1943. Vitamin B factors in toxic psychosis of pregnancy and the puerperium. Am J Obstet Gynecol 46:304.
Hawkins WW, Barsky J. 1948. An experiment on human vitamin B6 deprivation. Science 108:284–286.
Heiskanen K, Salmenperä L, Perheentupa J, Siimes MA. 1994. Infant vitamin B-6 status changes with age and with formula feeding. Am J Clin Nutr 60:907–910.
Heiskanen K, Kallio M, Salmenperä L, Siimes MA, Ruokonen I, Perheentupa J. 1995. Vitamin B-6 status during childhood: Tracking from 2 months to 11 years of age. J Nutr 125:2985–2992.
Hendrickx AG, Cukierski M, Prahalada S, Janos Booher S, Nyland T. 1985. Evaluation of bendectin embryotoxicity nonhuman primates: II. Double-blind study term cynomolgus monkeys. Teratology 32:191–194.
Huang Y-C, Chen W, Evans MA, Mitchell ME, Shultz TD. 1998. Vitamin B6 requirement and status assessment of young women fed a high-protein diet with various levels of vitamin B-6. Am J Clin Nutr 67:208–220.
Hultberg B, Andersson A, Sterner G. 1993. Plasma homocysteine in renal failure. Clin Nephrol 40:230–235.
Hunt AD Jr, Stokes J Jr, McCrory WW, Stroud HH. 1954. Pyridoxine dependency: Report of a case of intractable convulsions in an infant controlled by pyridoxine. Pediatrics 13:140–145.
Johansson S, Lindstedt S, Register U, Wadstrom L. 1966. Studies on the metabolism of labeled pyridoxine in man. Am J Clin Nutr 18:185–196.
Kang-Yoon SA, Kirksey A, Giacoia GP, West KD. 1995. Vitamin B6 adequacy in neonatal nutrition: Associations with preterm delivery, type of feeding, and vitamin B-6 supplementation. Am J Clin Nutr 62:932–942.
Khera KS. 1975. Teratogenicity study in rats given high doses pyridoxine (vitamin B6) during organogenesis. Experientia 31:469–470.
Kirksey A, Roepke JL. 1981. Vitamin B6 nutriture of mothers of three breast-fed neonates with central nervous system disorders. Fed Proc 40:864.
Kirksey A, Keaton K, Abernathy RP, Greger JL. 1978. Vitamin B6 nutritional status of a group of female adolescents. Am J Clin Nutr 31:946–954.
Kretsch MJ, Sauberlich HE, Newbrun E. 1991. Electroencephalographic changes and periodontal status during short-term vitamin B-6 depletion of young, nonpregnant women. Am J Clin Nutr 53:1266–1274.
Kretsch MJ, Sauberlich HE, Skala JH, Johnson HL. 1995. Vitamin B-6 requirement and status assessment: Young women fed a depletion diet followed by a plant-or animal-protein diet with graded amounts of vitamin B-6. Am J Clin Nutr 61:1091–1101.
Leklem JE. 1990. Vitamin B-6: A status report. J Nutr 120:1503–1507.
Leklem JE. 1991. Vitamin B6. In: Machlin LJ ed. Handbook of Vitamins, 2nd edition. New York: Marcel Dekker. Pp. 341–392.
Leklem JE. 1994. Vitamin B6. In: Shils ME, Olson JA, Shike M, eds. Modern Nutrition in Health and Disease. Philadelphia: Lea & Febiger. Pp. 383–394.
Leklem JE, Shultz TD. 1983. Increased plasma pyridoxal 5'-phosphate and vitamin B-6 in male adolescents after 4500-meter run. Am J Clin Nutr 38:541–548.
Lindberg AS, Leklem JE, Miller LT. 1983. The effect of wheat bran on the bioavailability of vitamin B-6 in young men. J Nutr 113:2578–2586.
Linkswiler HM. 1978. Vitamin B6 requirements of men. In: Human Vitamin B6Requirements: Proceedings of a Workshop. Washington, DC: National Academy of Sciences. Pp. 279–290.
Lui A, Lumeng L, Aronoff GR, Li T-K. 1985. Relationship between body store of vitamin B6 and plasma pyridoxal-P clearance: Metabolic balance studies in humans . J Lab Clin Med 106:491–497.
Lumeng L, Li TK. 1974. Vitamin B6 metabolism in chronic alcohol abuse. Pyridoxal phosphate levels in plasma and the effects of acetaldehyde on pyridoxal phosphate synthesis and degradation in human erythrocytes. J Clin Invest 53:693–704.
Lumeng L, Cleary RE, Li TK. 1974. Effect of oral contraceptives on the plasma concentration of pyridoxal phosphate. Am J Clin Nutr 27:326–333.
Lumeng L, Cleary RE, Wagner R, Pao-Lo Y, Li TK. 1976. Adequacy of vitamin B6 supplementation during pregnancy: A prospective study. Am J Clin Nutr 29:1376–1383.
Lumeng L, Ryan MP, Li TK. 1978. Validation of the diagnostic value of plasma pyridoxal 5'-phosphate measurements in vitamin B6 nutrition of the rat. J Nutr 108:545–553.
Manore MM, Leklem JE. 1988. Effect of carbohydrate and vitamin B6 on fuel substrates during exercise in women. Med Sci Sports Exerc 20:233–241.
Manore MN, Leklem JE, Walter MC. 1987. Vitamin B6 metabolism as affected by exercise in trained and untrained women fed diets differing in carbohydrate and vitamin B6 content. Am J Clin Nutr 46:995–1004.
Marcus RG. 1975. Suppression of lactation with high doses of pyridoxine. S Afr Med J 49:2155–2156.
Merrill AH Jr, Henderson JM, Wang E, McDonald BW, Millikan WJ. 1984. Metabolism of vitamin B-6 by human liver. J Nutr 114:1664–1674.
Meydani SN, Ribaya-Mercado JD, Russell RM, Sahyoun N, Morrow FD, Gershoff SN. 1991. Vitamin B-6 deficiency impairs interleukin 2 production and lymphocyte proliferation in elderly adults. Am J Clin Nutr 53:1275–1280.
Miller LT, Linkswiler H. 1967. Effect of protein intake on the development of abnormal tryptophan metabolism by men during vitamin B6 depletion. J Nutr 93:53–59.
Miller LT, Johnson A, Benson EM, Woodring MJ. 1975. Effect of oral contraceptives and pyridoxine on the metabolism of vitamin B6 and on plasma tryptophan and α-amino nitrogen. Am J Clin Nutr 28:846–853.
Miller LT, Leklem JE, Shultz TD. 1985. The effect of dietary protein on the metabolism of vitamin B6 in humans. J Nutr 115:1663–1672.
Mitwalli A, Blair G, Oreopoulos DG. 1984. Safety of intermediate doses of pyridoxine. Can Med Assoc J 131:14.
Moss AJ, Levy AS, Kim I, Park YK. 1989. Use of Vitamin and Mineral Supplements in the United States: Current Users, Types of Products, and Nutrients. Advance Data, Vital and Health Statistics of the National Center for Health Statistics, No. 174. Hyattsville, MD: National Center for Health Statistics.
Mueller JF, Vilter RW. 1950. Pyridoxine deficiency in human beings induced by desoxypyridoxine. J Clin Invest 29:193–201.
Nakano H, Gregory JF 3rd. 1997. Pyridoxine and pyridoxine-5'-beta-D-glucoside exert different effects on tissue B-6 vitamins but similar effects of beta-glucosidase activity in rats. J Nutr 125:2751–2762.
Pannemans DL, van den Berg H, Westerterp KR. 1994. The influence of protein intake on vitamin B6 metabolism differs in young and elderly humans. J Nutr 124:1207–1214.
Parry GJ, Bredesen DE. 1985. Sensory neuropathy with low-dose pyridoxine. Neurology 35:1466–1468.
Phillips WE, Mills JH, Charbonneau SM, Tryphonas L, Hatina GV, Zawidzka Z, Bryce FR, Munro IC. 1978. Subacute toxicity of pyridoxine hydrochloride in the beagle dog. Toxicol Appl Pharmacol 44:323–333.
Philpot J, Muntoni F, Skellett S, Dubowitz V. 1995. Congenital symmetrical weakness of the upper limbs resembling brachial plexus palsy: A possible sequel of drug toxicity in the first trimester of pregnancy. Neuromuscul Disord 5:67–69.
Raica N Jr, Sauberlich HE. 1964. Blood cell transaminase activity in human vitamin B6 deficiency. Am J Clin Nutr 15:67–72.
Ribaya-Mercado JD, Russell RM, Sahyoun N, Morrow FD, Gershoff SN. 1991. Vitamin B-6 requirements of elderly men and women. J Nutr 121:1062–1074.
Riggs KM, Spiro A, Tucker K, Rush D. 1996. Relations of vitamin B-12, vitamin B-6, folate, and homocysteine to cognitive performance in the Normative Aging Study. Am J Clin Nutr 63:306–314.
Rimm EB, Willett WC, Hu FB, Sampson L, Colditz GA, Manson JE, Hennekens C, Stampfer MJ. 1998. Folate and vitamin B6 from diet and supplements in relation to risk of coronary heart disease among women. J Am Med Assoc 279:359– 364.
Robinson K, Mayer EL, Miller DP, Green R, van Lente F, Gupta A, Kottke-Marchant K, Savon SR, Selhub J, Nissen SE, Kutner M, Topol EJ, Jacobsen DW. 1995. Hyperhomocysteinemia and low pyridoxal phosphate. Common and independent reversible risk factors for coronary artery disease. Circulation 92:2825– 2830.
Rose CS, Gyorgy P, Butler M, Andres R, Norris AH, Shock NW, Tobin J, Brin M, Spiegel H. 1976. Age differences in vitamin B6 status of 617 men. Am J Clin Nutr 29:847–853.
Rose DP. 1978. Oral Contraceptives and Vitamin B6. In: Human Vitamin B6 Requirements: Proceedings of a Workshop. Washington, DC: National Academy Press. Pp. 193-201.
Sauberlich HE. 1964. Human requirements for vitamin B6. Vitam Horm 22:807– 823.
Sauberlich HE, Canham JE, Baker EM, Raica N Jr, Herman YF. 1972. Biochemical assessment of the nutritional status of vitamin B6 in the human. Am J Clin Nutr 25:629-642.
Scaglione D, Vecchione A. 1982. Pyridoxine for the suppression of lactation—a clinical trial on 1592 cases. Acta Vitaminol Enzymol 4:207-214.
Schaeppi U, Krinke G. 1985. Differential vulnerability of three rapidly conducting somatosensory pathways in the dog with vitamin B6 neuropathy. Agents Actions 16:567-579.
Schaumburg HH, Berger A. 1988. Pyridoxine neurotoxicity. In: Clinical and Physiological Applications of Vitamin B6. New York: Alan R. Liss. Pp. 403-414.
Schaumburg H, Kaplan J, Windebank A, Vick N, Rasmus S, Pleasure D, Brown MJ. 1983. Sensory neuropathy from pyridoxine abuse. N Engl J Med 309:445-448.
Schumacher MF, Williams MA, Lyman RL. 1965. Effect of high intakes of thiamine, riboflavin and pyridoxine on reproduction in rats and vitamin requirements of the offspring. J Nutr 86:343-349.
Schuster K, Bailey LB, Mahan CS. 1981. Vitamin B6 status of low-income adolescent and adult pregnant women and the condition of their infants at birth. Am J Clin Nutr 34:1731-1735.
Selhub J, Jacques PF, Wilson PWF, Rush D, Rosenberg IH. 1993. Vitamin status and intake as primary determinants of homocysteinemia in an elderly population. J Am Med Assoc 270:2693-2698.
Selhub J, Jacques PF, Bostom AG, D’Agostino RB, Wilson PW, Belanger AJ, O’Leary DH, Wolf PA, Schaefer EJ, Rosenberg IH. 1995. Association between plasma homocysteine concentrations and extracranial carotid-artery stenosis. N Engl J Med 332:286-291.
Shane B. 1978. Vitamin B6 and blood. In: Human Vitamin B6 Requirements: Proceedings of a Workshop. Washington, DC: National Academy Press. Pp. 111-128.
Shane B, Contractor SF. 1975. Assessment of vitamin B6 status. Studies on pregnant women and oral contraceptive agent users. Am J Clin Nutr 28:739-747.
Shane B, Contractor SF. 1980. Vitamin B6 status and metabolism in pregnancy. In: Tryfiates GP, ed. Vitamin B6 Metabolism and Role in Growth. Westport, CT: Food & Nutrition Press. Pp. 137-171.
Sharma SK, Dakshinamurti K. 1992. Seizure activity in pyridoxine-deficient adult rats. Epilepsia 33:235-247.
Sharma SK, Bolster B, Dakshinamurti K. 1994. Picrotoxin and pentylene tetrazole induced seizure activity in pyridoxine-deficient rats. J Neurol Sci 121:1-9.
Shultz TD, Leklem JE. 1981. Urinary 4-pyridoxic acid, urinary vitamin B6, and plasma pyridoxal phosphate as measures of vitamin B6 status and dietary intake in adults. In: Leklem JE, Reynolds RD, eds. Methods in Vitamin B6 Nutrition. New York: Plenum Press. Pp. 389-392.
Snell EE. 1958. Some aspects of the metabolism of vitamin B6. In: Fourth International Congress of Biochemistry-Vitamin Metabolism, Vol. 11. New York: Pergamon. Pp. 250-265.
Snyderman SE, Holt LE, Carretero R, Jacobs K. 1953. Pyridoxine deficiency in the human infant. Am J Clin Nutr 1:200.
Stephens MC, Havlicek V, Dakshinamurti K. 1971. Pyridoxine deficiency and development of the central nervous system in the rat. J Neurochem 18:2407–2416.
Subbarao K, Kakkar W. 1979. Thrombin induced surface changes of human platelets. Biochem Biophys Res Commun 88:470–476.
Tarr JB, Tamura T, Stokstad EL. 1981. Availability of vitamin B6 and pantothenate in an average American diet in man. Am J Clin Nutr 34:1328–1337.
Tolis G, Laliberte R, Guyda H, Naftolin F. 1977. Ineffectiveness of pyridoxine (B6) to alter secretion of growth hormone and prolactin and absence of therapeutic effects on galactorrhea-amenorrhea syndromes. J Clin Endocrinol Metab 44:1197–1199.
Ubbink JB, Vermaak WJ, Delport R, van der Merwe A, Becker PJ, Potgieter H. 1995. Effective homocysteine metabolism may protect South African blacks against coronary heart disease. Am J Clin Nutr 62:802–808.
Ubbink JB, van der Merwe A, Delport R, Allen RH, Stabler SP, Riezler R, Vermaak WJ. 1996. The effect of a subnormal vitamin B6 status on homocysteine metabolism. J Clin Invest 98:177–184.
Unna K, Antopol W. 1940. Toxicity of vitamin B6. Proc Soc Exp Biol Med 43:116–118.
van der Beek EJ, van Dokkum W, Wedel M, Schrijver J, van den Berg H. 1994. Thiamin, riboflavin and vitamin B6: Impact of restricted intake on physical performance in man. J Am Coll Nutr 13:629–640.
Weinstein BB, Wohl Z, Mitchell GJ, Sustendal GF. 1944. Oral administration of pyridoxine hydrochloride in the treatment of nausea and vomiting of pregnancy. Am J Obstet Gynecol 47:389–394.
Weir MR, Keniston RC, Enriquez JI Sr, McNamee GA. 1991. Depression of vitamin B6 levels due to dopamine. Vet Hum Toxicol 33:118–121.
West KD, Kirksey A. 1976. Influence of vitamin B6 intake on the content of the vitamin in human milk. Am J Clin Nutr 29:961–969.
Willis RS, Winn WW, Morris AT, Newsome AA, Massey WE. 1942. Clinical observations in treatment of nausea and vomiting in pregnancy with vitamin B1 and B6. A preliminary report. Am J Obstet Gynecol 44:265–271.
Wozenski JR, Leklem JE, Miller LT. 1980. The metabolism of small doses of vitamin B6 in men. J Nutr 110:275–285.
Yess N, Price JM, Brown RR, Swan PB, Linkswiler H. 1964. Vitamin B6 depletion in man: Urinary excretion of tryptophan metabolites. J Nutr 84:229–236.


