
4
Data and Information
The effective integration of ecologic, economic, and social approaches to watershed management depends of the use of scientific methods, but those methods are no more successful than the data they employ. The previous chapter reviewed what we know about the natural and human systems that are important in watershed management. The application of that general knowledge in management, however, depends on the acquisition and skillful use of data about specific places and situations. This chapter explores the characteristics of available data and the state of our ability to use those data in the actual practice of watershed management. The chapter first reviews the types, sources, and management of available data to provide guidance on acquisition of existing information. Second, it explores two important aspects of data management: geographic information systems and special aspects of socioeconomic data. Finally, it identifies gaps in our scientific data, information, and knowledge as a guide for the investment of future research resources. (Later, Appendix B provides a brief guide to World Wide Web sites that provide data and information to watershed researchers, managers, and interested citizens.)
Data
Four types of data are useful to watershed managers: 1) abiotic, such as weather and water discharge, 2) biotic, such as flora and fauna, and biomass statistics, 3) social, such as economic net returns, esthetics, and human values, and 4) other, such as land use and watershed history. These classifications are useful for communicating and managing data, although they are not mutually
exclusive. The goal of data collection should be to provide decisionmakers with answers—what are the problems in a watershed, what are the causes of the problems, and what actions might lessen the problems (see Box 4.1).
The term information as used here connotes interpretation, synthesis, and communication of data. Knowledge connotes the translation of data, information, and ideas into explanations. Thus, explanations may be limited at the root by basic data. For instance, historical data for watersheds are often limited in coverage, of unreliable accuracy, or require significant assembly and interpretation (Trimble and Cooke, 1991). The usefulness of data, information, and knowledge is often limited because they are not offered to decisionmakers in forms that are appropriate.
Data Types
Traditionally, scientific questions concentrated on understanding specific processes and research was designed to provide focused data collection. For example, research to understand runoff processes required the collection of physical data to quantify such things as precipitation and soil characteristics. Current research efforts tend to be broader in scope and are directed toward integrating our understanding of specific processes. to address problems at the watershed scale. As a result, data collection efforts now are more diffuse and include economic, social, and perceptual data.
Data Sources
There is a long tradition of collecting data in selected ''experimental" watersheds, and these have provided the setting for the development of our current understanding of physical and biological watershed processes. Experimental watersheds that were initially instrumented to quantify hydrologic processes have become a valuable cornerstone on which to build integrated research programs addressing hydrologic, climatic, biotic, biotic, and social factors, and their interactions. Until now, most experimental watersheds have been at sites where human influence is minimal. New experimented sites are needed in locations where social and biophysical systems interact significantly, and the addition of the Baltimore and Phoenix regions to the national Long-Term Ecological Research (LTER) program of the National Science Foundation is an important step. Current research to integrate multidisciplinary projects will build on the detailed data collection and process studies conducted at experimental watersheds. It is the strength of many of these watersheds that long-term data collection efforts can be used to quantify the year-to-year variability in natural processes, thus improving the scientific defensibility of interpretations based on the collected data.
Figure 4.1 summarizes active experimental watersheds in the United States (NRC, 1997). Most research watersheds receive support through the U.S. Forest
|
Box 4.1 White Clay Lake Watershed: Science Guiding Management  Data are needed as a basis for decisionmaking because they provide answers about what causes problems and, in turn, what steps managers might take to resolve those problems, steps that might often not be intuitive. For instance, in the 1970s a series of studies conducted under the auspices of the White Clay Lake demonstration project in Wisconsin sought to understand the effects of agricultural runoff on the lake's water quality, prepare plans for reducing feedlot and runoff pollution from the watershed, and monitor the effectiveness of the pollution control measures that were implemented. It came as somewhat of a surprise when researchers determined that surface water contributed only 35 percent of the water volume input to White Clay Lake, whereas groundwater discharging directly into the lake contributed 40 percent and direct precipitation contributed 25 percent. This meant that watershed management activities could influence only a fraction of the water inputs into the lake. But further research showed that surface water contributed a full 57 percent of the total phosphorus to the lake, illustrating that most of the nonpoint source pollution was contributed by the water source that managers could take management steps to improve. It also was learned that natural wetlands separating the lake from the uplands retained about 14 percent of the sediment and nutrient fluxes from the watershed, an amount that was equivalent to that retained by the various best management practices constructed in the watershed. The lesson was the importance of conserving the wetland in its natural state so that it could continue to provide this free environmental service. The monitoring phase of the project also brought management lessons: researchers determined that a manure storage pit built according to sound best management specifications actually caused groundwater contamination that threatened a farmer's well water — showing the importance of monitoring implemented practices to ensure that they function properly and provide the intended benefits. |
FIGURE 4.1
Locations of active experimental watersheds in the United States. Number of watersheds monitored is indicated in parentheses. Watershed size is indicated by the size of circle and maximum years of data collection for each watershed is indicated by the fill pattern of each circle. SOURCE: Data taken from NRC (1997).
Service, U.S. Department of Agriculture, and the National Science Foundation's LTER sites. The two LTER sites in urban areas added by NSF in 1997 are not shown. Other active research watersheds operated, for example, by university researchers are not included. Types of data collected include: meteorological, hydrological, surface water quality, ground water levels, surface water chemistry, ground water chemistry, soil, sediment, land use, vegetation, and animal data. All data types are not collected at all locations.
These experimental watersheds represent a wide range of ecosystem types across the United States, and they provide basic data for watershed knowledge from a national perspective. The number of monitored watersheds at these sites ranges from a minimum of 1 at several locations to a maximum of 25 at the USDA-ARS Walnut Gulch Experimental Range in Southeastern Arizona. The length of data collection ranges from 1 year at the most recently instrumented watersheds to as long as 75 years at North Temperate Lakes LTER site in Wisconsin.
The urban LTER sites are more than ecological studies that happen to be located in cities. USEPA and NSF, the sponsoring organizations, deliberately established the urban sites with the intention of fostering integrative research among practitioners of national science, social and economic sciences, and engineering. The measure of success for the urban LTER sites will be the degree to which they produce truly integrative results instead of purely ecological conclusions.
The purpose of watershed research, as implemented via experimental watersheds, is to collect, document, interpret and disseminate basic data, information, and knowledge of watershed processes and functions. These activities serve as a basis for design, implementation, monitoring, evaluating, and understanding watershed management practices and programs, and to predict watershed response to alternative land use and management practices. The need for prediction arises because all watersheds cannot be instrumented or monitored, and because we need to understand the potential impacts of watershed management before the programs and practices are implemented. Implicit in this need for prediction are interpretation of data and processes occurring on instrumented watersheds, along with development and scientific validation of simulation models to predict watershed response on noninstrumented watersheds.
Involving the Public in Watershed Monitoring
Concerned citizens represent a potentially valuable reservoir of human resources whose involvement in watershed monitoring can benefit management organizations and increase the overall level of public awareness of ecosystem health. Additionally, citizen involvement in coordinated monitoring activities can instill a sense of watershed ownership as people take an active interest in changes within the watershed and provide inputs to decisionmakers based on
first-hand, objective observations. The result is a learning opportunity for those setting policy and public influence in watershed management decisions (Naiman et al., 1997).
Expectations of the abilities of concerned citizens to take samples and perform routine scientific tests must be tempered by the knowledge that the public lacks advanced technical training. A successful model is the American Association of Variable Star Observers, a network of skilled amateurs who provide a service by monitoring stars too numerous to be measured by professional astronomers. It is important that shared monitoring tasks focus on measurements that are readily understandable and do not require specialized skills. Lack of skill may preclude the collection of hydrologic data and biological samples. However, a number of monitoring activities are well within the abilities of average citizens, including the following specific examples.
Photographs
Time-series photographs are important contributions to understanding watershed changes. Often some of the most valuable information about historical condition is derived from old photographs, particularly those in which the location can be clearly identified. A network of reference photo points within a watershed is helpful in tracking long-term trends in both aquatic and terrestrial ecosystems. Reference photo points can also be used to display the effects of seasonal changes and large disturbances such as fires and floods. Historical photographs may already exist in family albums, or public collections, and public involvement can help bring these records to light.
Water Samples
Long-term trends in water quality require periodic, regularly-scheduled sampling, but the number of sites that can be routinely monitored by agencies is limited by the availability of automated sampling equipment and staff time. For example, the U.S. Geological Survey monitored water quality parameters in many watersheds after passage of federal water laws in the 1960s and 1970s, but was forced to abandon many of the sites in the late 1970s when funding for monitoring programs expired. Thus it is becoming more common for local volunteers to take samples.
Habitat Measurements
Stream morphology is an integrative measure of watershed processes. Pools, for example, are important habitat features for certain types of aquatic organisms, including many fish species. In streams with riffle-pool sequences, pool counts can be an important indicator of overall channel condition. Loss of large, deep
pools over a 50-year period has been documented in Pacific Northwest watersheds with management histories that have included logging, agricultural, and grazing practices (FEMAT, 1993). While many environmental management agencies currently undertake habitat surveys, inventories of all streams within a watershed are often beyond their manpower capabilities. Citizen participation in simple habitat measures such as pool counts can increase the area of a watershed for which inventory information is available. Sportsmen's clubs and conservation organizations (including adopt-a-stream groups) are especially suited to this type of project.
Riparian Forest Surveys
The condition of riparian forests often goes unassessed, yet these areas are critical to watershed health. Riparian plots in which surveyors identify and count the number of plants within plot boundaries and periodically note changes in species composition, growth, and mortality yield useful information about the condition of streambanks and floodplains. Investigators can record causes of tree mortality such as human disturbance, beaver activity, streambank undercutting, or windthrow. Plots do not have to be revisited every year, as long as their locations are well documented; they can be resurveyed by the same group or rotated among several groups over longer periods. Information generated by these surveys can be useful for verifying remote sensing data, for providing riparian vegetation overlays in watershed Geographic Information Systems (GIS) mapping, and for teaching citizens about the dynamic nature of the interactions between water and land.
Public Outreach
Scientists and watershed managers can improve the transfer of knowledge of watershed processes and innovative management techniques to the public. Citizens and local interest groups usually act with the best intentions, but they do not always have the benefit of current scientific insights into ecosystem health and watershed productivity. The result can be projects that have a high probability of failing to achieve their objectives, or worse, that actually impair ecosystem functions (NRC, 1992).
There are very few widely available sources of information and advice on environmentally sound management practices that address watershed issues, apart from some limited water quality protection and soil conservation measures. Very few available sources truly address the problems of integrated approaches. Much of the ecological literature on watershed processes and land and water use impacts exists in a form that is largely unavailable (and not generally understandable) to citizens. The majority of technical information transfer occurs between agency staffs and the public. But agency involvement in watershed management
is often limited to granting land and water use permits, with the emphasis on what cannot be done rather than what can be done. There are relatively few incentives for trying new things that could improve land stewardship. Instead, the focus of public activities tends more toward mitigation for lost habitat than toward stewardship.
Technology transfer must include the active participation of watershed scientists. Scientists can stress, among other things, the importance of land-water connections, the role of natural disturbances in maintaining ecosystem processes, and the need to view watershed management in terms of large landscape units. The success of agricultural and forestry extension services, in which the public can turn for advice to local extension agents familiar with the region, can serve as a model for the establishment of integrated watershed extension services. Watershed extension specialists could serve as local sources of the latest information, and can act as liaisons between small and large landowners, natural resource consumers, and management agencies.
Colleges and universities can also play a role in educating citizens about important watershed management issues. Although educational institutions sponsor many meetings, presentations at scientific conferences are often too technical for the public. A series of weekend or evening workshops aimed at communicating applied watershed science to a general audience would help facilitate increased public understanding of management options. These workshops could feature a combination of university faculty and other research scientists, as well as managers and environmental policymakers.
Data Management
The advent of the computer has changed data management dramatically, from hand tabulations and paper files to electronic databases with the capability to rapidly organize, analyze, and display enormous amounts of data. Geographical Information Systems (GIS), for instance, offer the capability to manage and analyze spatially and temporally distributed data at the watershed level. Databases with a wide range of information such as streamflow data and precipitation rates can be obtained directly from a CD-ROM or even downloaded from the World Wide Web (see Appendix B for addresses). GIS information is now routinely available for watershed studies because many public agencies have developed the necessary coverages. Thus, a major challenge and opportunity for the future is to develop and incorporate efficient techniques for database management as part of the decisionmaking process.
As recognized by the U.S. Environmental Protection Agency and others (USEPA, 1993), the analysis and management of environmental, ecological, and other natural resource-related issues can best be addressed at the watershed level. Watersheds reflect natural systems, as compared to municipal and county boundaries which facilitate political and administrative decisionmaking. Watersheds
represent distinct ecosystems, or unique parts of ecosystems, and integrate phenomena such as material and energy transfer better than artificial man-made boundaries.
Geographic Information Systems
GIS software is an especially effective tool for watershed management. GIS software provides the ability to create a computerized database consisting of spatial (map or image) data registered to some type of geographic coordinate system (latitude/longitude, Universal Transverse Mercator, State Plane). Most contemporary GIS software packages provide the capability to input spatial data, manipulate it, and output the results in the form of various maps and/or tabular products. In situations where complex environmental relationships exist, it has been found that data concerning different aspects of the physical environment can be used more effectively in combination than separately. One of the primary functions of a GIS is the combination and evaluation of different spatial data sets for the purpose of providing new composite information (see Box 4.2). Examples of the products of some watershed-related GIS appear in color plates 1, 2, 3, and 4.
GIS is a tool that is particularly conducive to watershed management because it integrates information on the basis of geography. Many workers in several of the disciplines that are typically brought together to address watershed issues (e.g., geology, hydrology, chemistry, soil science, ecology, economics, and management) are already familiar with the use of GIS for analyzing spatial data. Because GIS provides the ability to manage and analyze data across spatial and temporal scales, it effectively supports activities related to most, if not all, of the watershed management elements mentioned above.
The development of GIS capabilities and databases have greatly facilitated watershed research and planning efforts. Entire conferences, or major portions thereof, have been devoted to the use of GIS in water resource management (Goodchild et al., 1993, 1996; Kovar and Nachtnebel, 1996). An excellent primer on the use of GIS in hydrologic applications has been published by UNESCO and the International Institute for Aerospace Survey and Earth Sciences (Meijerink et al., 1994).
The widespread availability of detailed Digital Elevation Models (DEM) has contributed to the increased use of GIS in hydrology. Topography is the driving force behind surface water movement through watersheds, so these detailed elevation databases allow hydrologists to predict the location and amount of water flowing over the land surface. Algorithms for flow routing and watershed boundary determination from DEM data (Jensen and Domingue, 1988) are now standard tools in most GIS software. The hydrologic modeling capabilities of GIS may be used with or without linked hydrologic models.
Several other GIS databases are useful in watershed management. As dis-
cussed in Chapter 3, the U.S. Geological Survey has divided the nation into "Hydrologic Units," which are the watersheds for the major rivers and coastal regions of the United States (USGS, 1982). This system has been used since 1977 for the USGS National Stream Quality Accounting Network (Briggs and Ficke, 1977), and is widely used for a variety of other surface water applications. USGS has also developed digital land cover databases for the conterminous United States, derived from satellite imagery (Eidenshink, 1992). USEPA's digital "Reach File" divides the nation's rivers and streams into segments for which water quality data are collected and summarized. Medium-resolution (minimum mapping unit ~625 ha) digital soil maps are now available for the entire U.S. under the Natural Resource Conservation Service's STATSGO program (Lytle et al., 1996).
GIS provides an important tool for conducting watershed scale research (Johnston et al., 1988). For example, the location of wetlands relative to streams (Johnston et al., 1990) and lakes (Detenbeck et al., 1993) greatly influences their individual and collective capacity to improve downstream. water quality. A wetland may have high potential for pollutant reduction, but it cannot realize that potential unless it is in a flow path located to intercept pollutants. A greater understanding of these watershed-scale relationships will lead to better watershed planning for maximum sustainability of watershed resources.
Socioeconomic Data for Watershed Characterization/Analysis
A variety of socioeconomic data are available from the decennial U.S. Census of Population and Housing. Individual and household data are aggregated into Census accounting units with geographic identifiers. These units are the building blocks for use of Census data in geographic information systems (GIS). The 1990 data have been formatted at the "block group" level for use with specific computer software, and are publicly available from the U.S. Census Bureau (and from many state agencies). Block group data can be aggregated to approximately cover a hydrologically defined watershed area.
Block groups are aggregations of Census data with a minimum population of about 200 households. The minimum population preserves anonymity. Aggregations of block groups may not correspond to watershed boundaries precisely, because the spatial boundaries of the basic block groups are fixed, but approximations to physical watersheds is often close. Block groups can accurately be aggregated to higher level political entities that fall within large watershed boundaries (places, congressional districts, cities, counties, metropolitan areas, states).
Variables in census data include a wide range of individual and household characteristics useful in describing the human population residing in watersheds, thus permitting analysis of potential human impacts to the physical and biological features of watersheds. The results of spatial analysis offer critical information resources for watershed planning. Aggregated characteristics of individuals in-
|
Box 4.2 Finding Watershed Data: The Pennsylvania Example  One tool for enhancing collaboration and effectiveness (and reducing duplication of data) among watershed managers, planners, and geographic information systems specialists is the development and maintenance of "clearinghouses" for spatial databases. Data clearinghouses save time and effort locating data and encourage the free and open exchange of critical shed management information. A spatial data clearinghouse provides a means to inventory, document, and share expensive spatial data. A clearinghouse allows data providers to advertise existing spatial data, the condition of these data, and instructions for accessing these data. Each data provider describes available data in an electronic text file and provides these metadata to the network using a variety of software tools. The clearinghouse may be a single repository, or a dispersed group of servers, all adhering to basic search and description standards. Even the data described in the clearinghouse's metadata may be located at the sites of data producers or, where appropriate, at sites throughout a region, state, the country. |
clude their place of residence (e.g., urban/rural, farm/nonfarm), demographic characteristics (age, sex race, place of birth), social characteristics (e.g., education, marital status, family type, etc.) work related information (employment, industry and occupation of worker, place of work, travel to and from work) sources and levels of income (earned, wage and salary, self-employment, farm, etc.) and poverty status.
Aggregate data are also available for a variety of household and housing unit characteristics, which can be particularly useful in watershed planning. These include location (urban/rural, farm/nonfarm), size and age, source of water, method of sewage disposal, and type of plumbing facilities.
Census data are also available on economic activities. The U.S. Department of Agriculture conducts economic censuses every five years for agriculture, construction, financial, insurance and real estate, manufacturers, mineral industries, minority and women-owned businesses, retail trade, service industries, transpor-
|
Where possible, a spatial data clearinghouse uses the Internet to link computer nodes that contain metadata and spatial data files. Using the Internet, data users can search the descriptions provided by producers to locate data that are suitable for their applications. WAIS (Wide Area Information Servers) software enables users to perform queries for data over the network using the Z39.50 protocol, which is emerging as an international standard. In addition, other features can be supported, such as an advertising area where producers can publicize data that are being prepared or are planned or for data seekers to solicit for data. One example of a spatial data clearinghouse is the Pennsylvania Spatial Data Access (PASDA) system, developed as part of the National Spatial Data Infrastructure (NSDI) effort. PASDA can answer the question: ''Where are data about watersheds in Pennsylvania?" PASDA was developed by Pennsylvania Department of Environmental Protection in collaboration with Penn State University to improve watershed management through increased access to spatial data. PASDA consists of two resources: a metadata collection of over 2200 records configured to support distributed NSDI searches using the Federal Geographic Data Committee's standard wide area information server protocol and a World Wide Web site (www.pasda.psu.edu) that supports search and retrieval of GIS data and preview images in addition to the metadata collection. PASDA fosters communications between the users and producers, which encourages partnerships for data production and minimizes expensive duplication in data collection. |
tation, and communication utilities. Each census provides data on the size and activities of enterprises covered, with specific characteristics reported that are relevant to each type of economic activity. These data are aggregated to the county level, providing less resolution than the Census of Population and Housing data aggregated into smaller Block Group units. Nevertheless, these data are available in dBase format for use in conjunction with GIS computer programs. Unfortunately, the counties may provide only a crude approximation of hydrologically defined watershed boundaries. In some cases, counties may be larger than watersheds of interest, and in others large counties may straddle watershed boundaries. In some instances, aggregations of counties can be used to approximate large river basins or the Water Resource Regions discussed in Chapter 3.
Files that summarize data from a variety of sources aggregated at the county level are also available. For example, the City and County Data Book and USA Counties are collections of a variety of social, economic and political data. These
data are updated regularly and, like the economic censuses, are available in dBase format for use with GIS computer programs. Similarly, the Regional Economic Information System data file contains economic time series for data from 1969 to 1994.
Current State of Knowledge
Watershed science seeks to understand and explain the structure and function of complex ecosystems, which it delimits on the basis of watershed boundaries. It is a multidisciplinary field that integrates the biological, chemical, physical, and social sciences. It draws its identity from the system being studied, and thus is inherently complex. This complexity is a special challenge to watershed science that militates against easy predictive generalizations. One manifestation of complexity is the site-specific nature of watersheds. Since no two basins are exactly alike, extrapolating findings from one to another must be done with caution.
Watershed science overlaps considerably with limnology and aquatic science, and the broadest definitions of the three tend to merge. Traditionally, limnology focused on lakes and was rooted in biology. Today, the science extends to other surface water bodies, including streams and wetlands, and incorporates all the basic sciences (NRC, 1996). Still, the emphasis tends to be on the water bodies themselves, with contributing watersheds studied only secondarily. Watershed science differs from aquatic science mainly by always using drainage basins as the unit of study. Watershed science also tends to have a greater management orientation and tendency to include social dimensions.
Over the past century, progress has been made in understanding many of the components that influence the structure and function of aquatic ecosystems and their contributing watersheds, but we remain far from an integrated knowledge or a general predictive capability. Recently published studies indicate that despite extensive data and a solid foundation of knowledge, the ability to effectively manage watersheds is still impeded by significant information gaps (Naiman et al., 1997; NRC, 1997). Furthermore, the lack of reliable funding for research and a fragmented system for training aquatic scientists make the closings of gaps more difficult (NRC, 1996).
Watershed science has some overarching research needs. Most of these needs cut across disciplines and require synthesis of information from several basic sciences at a variety of spatial scales and at a high level of complexity.
Perhaps most fundamental is the need for reliable, representative environmental monitoring data across disciplines. Stream stage, water chemistry, species diversity and abundance, and habitat conditions all need to be measured in monitoring programs designed to evaluate regional environmental conditions and to provide benchmarks that can be compared to nearby sites. It is especially critical to sustain long-term (longer than 10 years) programs in order to identify natural trends and to evaluate the relative effect of human activities. Also, the
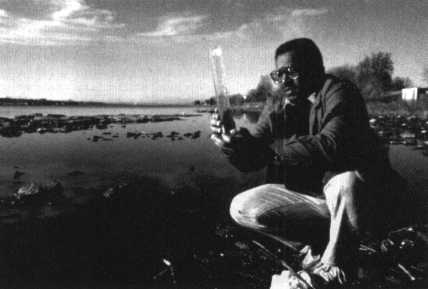
Much progress has been made in understanding many of the factors that influence the structure and function of aquatic ecosystems and their contributing watersheds, but much remains to be learned. There is a real need for reliable, representative environmental monitoring data across disciplines. Stream stage, water chemistry, species diversity and abundance, and habitat conditions all need to be measured in programs designed to evaluate regional conditions and such program should be long-term to identify trends and sort natural variability from the effects of human activities. Credit: USDA-Natural Resources Conservation Service.
highest possible level of quality assurance must be maintained, or the data may be useless. For the greatest utility, different watershed variable types (biological, chemical, physical) should be measured at the same monitoring sites. In addition, researchers must identify watershed indicators that reflect multiple variable types. Some current monitoring efforts, such as EPA's Environmental Monitoring and Assessment Program (EMAP), adopt these perspectives, but they represent only a beginning of what is needed.
So far, research has generally failed to integrate across disciplines at the watershed scale. This has occurred in part because most funding sources are discipline specific, so that multidisciplinary research must link separate projects, each of which has a low probability of funding success. This is especially true for integrating biophysical and social science research, even though this combination is exactly what is most needed to support watershed management decisionmaking.
One notable exception to the general lack of integrated, multidisciplinary research is the Water and Watersheds Program sponsored jointly by the National Science Foundation, the U.S. Environmental Protection Agency, and, as of 1997, the U.S. Department of Agriculture. This partnership program, initiated in 1994, emphasizes interdisciplinary research taking a systems approach to issues of water and watersheds. Its goal is to develop an improved understanding of the natural and anthropogenic processes that govern the quantity, quality, and availability of water resources in natural and human-dominated systems, and to improve understanding of the structure, function, and dynamics of the terrestrial and aquatic ecosystems that comprise watersheds.
Although the program is small and shrinking (making 36 awards in 1995, 12 awards in 1996 and 13 awards in 1997) (NSF/USEPA, 1998), the committee believes it is focusing attention on areas of great need. In 1997, when the program emphasized urban/suburban research, projects addressed the connection between ecosystem structure and function and human values and socioeconomic behaviors, integrating ecological and economic modeling of watersheds at multiple scales, and other innovative areas of study. In 1996, projects addressed topics such as developing an integrated approach to assessing water management options by extending a hydrodynamic-water quality model to include biological and political-economic components and studying the effectiveness of regulatory incentives for sediment pollution prevention. These are precisely the types of studies this committee believes are needed to enhance our ability to implement watershed management activities. No evaluation of the program has been done, however, to track whether the research has actually worked to increase the effectiveness of watershed management or benefit the environment, a common failing in watershed science.
Experimental watersheds also tend to be exceptions to the lack of integrated investigations because these sites are often the subject of interdisciplinary research. As a result, we have a superior understanding of the functioning of small, relatively pristine watersheds. This work needs to be continued and supported over long time scales. Just as importantly, there is a need to extrapolate to larger spatial scales and to consider systems that are strongly influenced or even dominated by human activities. In general, the importance of scale and of human interactions with watersheds are two critical areas requiring further study.
Little is known about how basic processes mesh at spatial scales ranging from molecular to global, linking aquatic systems at larger scales. Work is also badly needed to investigate the role of spatial heterogeneity and patchiness in the structure and function of watershed ecosystems, though this is becoming a significant area of research. Embedded in these questions is the role of disturbance regimes, both natural and anthropogenic, and how they influence watershed functioning.
Our understanding of the interactions between social and biophysical systems is in its infancy. The traditional view of human social systems as a perturbation
of "natural" ecosystems is giving way to a model where human and nonhuman components interact through causal linkages at a variety of levels and in both directions. One critical area where this need is especially strong is in support of ecological restoration projects. The growing desire to rehabilitate, or even restore, degraded watersheds is leading to an increased necessity for the ability to predict the consequences of ecosystem manipulation, and to know what is possible in human influenced or dominated watersheds. Linked to this is the need to be able to evaluate what kind and level of development of a watershed is consistent with its sustainable carrying capacity, however that controversial phrase is defined.
Related to all of these information gaps is a necessity for improved predictive capabilities, usually in the form of mathematical models. Many current models are either "too good to be real" or "too real to be good." In the first case, oversimplification (dimensionally, through lumping of parameters, or by ignorance of key driving processes and feedbacks) undercuts the accuracy or generality of the results. And in the second case, the need for detailed data (which is usually lacking, and costly to acquire) renders the model impractical to apply except in a research setting. Most models tend to assess watershed components individually and thus to miss feedback linkages. They are empirical rather than process driven, and consequently require lots of costly site-specific data. They usually lack integration across disciplines and fail to have a sense of the big picture. Better models use linked modules (e.g., water quality, water quantity, soils, sediment, fish, benthic biota), but even these generally fail to account for complex feedbacks existing among these parts. In addition to complex numerical models, there also remains a need for elegant, simple models, such as Vollenweider's P loading model for lakes, that can be based on reliable existing data.
Finally, watershed management cannot wait for the resolution of all of these important questions. Often, there is a need to act now even if scientific understanding is incomplete. That requirement argues strongly for the use of adaptive management, where decisionmakers evaluate the effects of actions frequently to assess whether or not there is progress toward desired goals. Mid-course corrections may be possible before undesirable consequences become irreversible. If well-monitored, adaptive management can even serve as useful large-scale experiments, as cause and effect are documented in a range of watershed settings.
Scientific Gaps
Gaps in Knowledge of Watershed Processes
Lack of knowledge about watershed processes is one of the key barriers to successful implementation of watershed approaches. Watersheds are complex systems with numerous components and complex relationships between those components, and yet too often our understanding of watersheds is uni-dimensional
and overly simplistic. Understanding how system components interact, how complex systems react to change, and similar process questions remains as an unmet challenge. For instance, while we have made great strides in measuring precipitation, we are less able to follow water as it moves through the system and understand how water, soil, and associated chemical constituents interact under normal and abnormal conditions. We lack real understanding of how abiotic and biotic processes occurring throughout the watershed are related. Answers to such complex questions can take time and patience to develop, but it just is this kind of information that managers need if they are to find workable solutions to water-shed-scale problems.
In the past, reductionist scientific approaches, in which processes and controlling variables are isolated as much as possible, have brought in-depth understanding of many aspects of watershed science. But the reductionist approach is less useful in the context of management decisionmaking, because managers need more than an understanding of individual parts; they need an understanding of the system as a whole. Reductionist and systems approaches to study are not mutually exclusive or competitive. Each has an important place in science. Fundamental data and knowledge gained from the reductionist approach is the scientific basis for understanding the components, for their interactions, and for their synthesis and integration.
One special challenge related to understanding the processes that operate in watersheds is integrating natural and social processes—that is, to understand the effects of human actions on the environment. Watershed science for managers and decisionmakers must be a judicial blend of natural science, social science, engineering, and planning. Additionally, we need to understand how these human, natural, and engineered processes operate at a variety of scales. What we learn at one scale may or may not be transferable to other scales.
Gaps in Data and Information
One of the most fundamental goals of watershed management is protection of water quality. Over $40 billion have been spent on measures to comply with point source pollution reduction since enactment of the Clean Water Act in 1972. Unquestionably, water quality has improved substantially over the last 25 years as a result, but do we know which contaminants have declined the most, and by precisely how much? Unfortunately, the answer is no. In spite of extensive water quality monitoring at a cost of billions of dollars (Hren et al., 1990), some studies indicate that past efforts have been "fragmented, duplicative and wasteful" (Blodgett, 1983).
Most past monitoring was directed toward evaluation of effluent quality. This was done, by design, in an effort to curb point source emissions, a goal at which it was very successful. The same data are of little value in measuring or predicting water quality conditions in receiving waters. Even when stream measure-
ments have been made, often there was little effort to assure that sampling was representative of the entire stream cross section. In larger rivers, conditions can be very different in surface waters and near the streambed. This oversight is indicative of a larger problem; in general, analytical quality assurance/quality control has received much greater attention than the quality of sampling design and execution, even though the latter accounts for at least half of the utility of the final data.
Another problem is that most existing stream data are not coupled to parallel measurements of discharge, which is important for at least three reasons. First, most water quality parameters change dramatically with stream stage, some increasing in concentration and others decreasing. Only by knowing instantaneous discharge at the time of measurement, and the dependence of each parameter on flow rate, is it possible to fairly compare water quality data from different time periods. Second, without discharge data it is impossible to calculate total mass fluxes. These values are important both for calculation of global biogeochemical mass balances and as one of the best integrated measures of the success of clean water efforts, free from biases caused by changes in total discharge from year to year. Finally, links to other ecosystem components and predictions about the effects of future changes, such as climate, require an understanding of the systematic relation between water quality and quantity.
Another problem with most past measurements of water quality is that data on toxic contaminants are lacking or badly compromised. By far the most common assays performed have been for parameters such as pH, conductivity, and dissolved oxygen. These are easy to measure but tell virtually nothing about water quality except in the grossest cases of contamination, which generally have been eliminated in the United States. Toxic contaminants, and even nutrients, are considerably more difficult to analyze, but tell much more about the effectiveness of watershed management. Unfortunately, contamination artifacts and lack of sensitive, reliable methods render much of the existing data record useless for substances whose impact is felt at trace levels. For example, virtually all monitoring-based measurements of trace metals in surface and ground waters until the early 1990s are now considered invalid (Benoit, 1994; Windom et al., 1991). A great deal of valid trace substance data exists in the literature for recent years, but we will probably never be able to reconstruct water column conditions that existed in the past for most trace contaminants at most sites.
Other problems relate to consistency and accessibility of data. In the past, measurements by various agencies have targeted different parameters, used unlike analytical methods that are no longer acceptable, and stored results in formats that are not readily accessible. Also, well-designed strategies for collecting hydrologic data can be expensive to maintain over the long-term, although this long-term perspective is what makes them most valuable (Box 4.3).
Fortunately, there have been significant recent efforts at the national level to develop uniform sampling and analytical protocols, improve both field and labo-
|
Box 4.3 Improved and Enhanced Sediment Data from Reservoir Surveys: The Example of the TVA System Sediment yields, accumulation, and concentrations are important data in watershed management. Conventionally derived sediment yield data, which depend on stream sampling, are often of questionable reliability, expensive, and from only limited locations. A very large source of data which could greatly supplement conventional data is that of sediment accumulation rates in reservoirs. Using appropriate adjustments for sediment trap efficiencies, sediment yields and fluxes can be obtained (Figure 4.2). Further calculation from runoff data can give average sediment concentrations. Despite the value of reservoirs, two problems in obtaining these data have surfaced in the past two decades. First, many agencies no longer do as many reservoir sediment surveys as in earlier decades. Secondly, up-to-date data are no longer published on a regular and obtainable basis as was done up to 1975 (Dendy and Champion, 1978). Environmental management in general and, specifically watershed management, would be well-served by increased monitoring and publishing of reservoir sedimentation rates. |
FIGURE 4.2
Sediment accumulation, yield, and overflow for the Tennessee River basin.
SOURCE: Reprint, with permission, from Trimble and Bube, 1990. © 1990 by The Environmental.
ratory quality assurance/quality control procedures, and make resultant data widely available in standardized formats. Planning is under way to establish a National Water Quality Monitoring Council that would implement this strategy (Powell, 1995). The council has been preceded by an Intergovernmental Task Force on Monitoring Water Quality (ITFM). It will be important in future years to continue this integration effort and to avoid shortsighted cutbacks in monitoring programs, which supply critically needed data for watershed management programs nationwide. They also provide an invaluable gauge of the success or failure of costly regulatory programs.
It will be important then, to the extent possible, for future water quality monitoring efforts to incorporate the following improvements:
- Most fundamentally, monitoring efforts must seek to answer specific questions, and all parts of the monitoring programs must contribute to that goal. Increasingly, selection of which questions should be answered will be linked directly to societal concerns.
- Emphasize in-stream monitoring of water quality in addition to compliance-based measures of effluent quality. This will be especially necessary since nonpoint sources of pollution, which represent the dominant portion of today's loading, cannot be directly measured.
- Include both ground water and surface water samples.
- Develop consistent lists of analytes, their definitions, and their methods of analysis among agencies in order to facilitate data sharing.
- Establish uniform data storage formats and increase their accessibility among agencies and to the scientific and management communities as well as the general public.
- Use levels of QA/QC that are adequate to ensure reliable, accurate data. Also, apply these protocols to both field and laboratory components of the monitoring effort. Improperly collected samples or those taken without suitable sampling design cannot be compensated for by any level of care in the laboratory.
- Collect only data that serve a purpose. It would be better to have 10 sites with good data coverage, than 1000 with meaningless measurements of only conductivity and DO. Good coverage includes consideration of analytes (number and appropriateness), time (frequency, continuity, and duration), ancillary information (discharge, meteorology, etc.), and spatial coverage (river cross section and longitudinal representativeness).
- If sampling or methods must be changed, careful intercalibrations should be conducted to assure comparability over time.
- Especially needed are reliable long-term data at permanent sites with unchanging sampling and analytical protocols. Cost savings should probably be achieved by restricting sites rather than having fewer parameters, less frequent sampling, lower quality control, or inadequate measurement of key ancillary data.
Gaps in Simulation Modeling and Decision Support Systems
The current capabilities of computers and computer software, including the proliferation of complex natural resource simulation models, are advancing beyond our ability to efficiently use them for research and natural resource decisionmaking. The formerly common paradigm of formulating an equation to describe a portion of a point process and making a decision based on a single objective has been replaced by an approach in which point processes are linked together to form a natural resource simulation system and applied in a distributed manner often within a GIS framework. The simulation results from the system can then be used to aid in the decisionmaking process. Inherent within the linkage of process sub-components is interactions and feedback mechanisms that complicate the evaluation of the sub-components as well as their interactions.
The flexibility of simulation models with large numbers of output variables makes arriving at a decision difficult without a systematic methodology to evaluate the output. There is an urgent need to provide scientists with a bridge for the gap between the tools of technology needed for development (computers and computer software) and basic science (process description and understanding) which is the foundation of sound natural resource technology transfer. There is also an urgent need to provide decisionmakers with a means of applying the technology on a routine basis by closing the gap between simulation models and decisions.
At the same time that computer simulation models are powerful tools, they have very definite limitations. Modelers generally have a good sense of those limitations, while decisionmakers may not. Providing a user-friendly interface between computer models and decisionmakers runs the risk of encouraging overreliance on imperfect modeling tools. Care must be taken to instill a proper level of caution and critical judgment when computer modeling tools are made more readily available to technically unsophisticated users.
Whereas the early focus of using computers was in developing and running models, attention has shifted to the related needs of database management, GIS application modules, and putting these tools together in an easy to use package called a decision support system (DSS). Reitsma at al. (1996) define a decision support systems as ". . . computer-based systems which integrate state information, dynamic or processes information and plan evaluation tools into a single software implementation." From a computer science point of view, the DSS can be generally partitioned into the following four subsystems: control system, database system, model system, and the report system. Functionally, this provides a link between a relational database, a GIS, simulation models, and management tools (Glover et al., 1992). Additional computer tools may be part of a DSS (e.g., optimization routines for resource allocation, artificial intelligence and expert systems, and object oriented structure).
As used here, an evaluation or planning decision support system is an inter-
active computer-based system that helps a decisionmaker, scientist, or manager use data and models to solve problems. In natural resource watershed applications, integral parts of a DSS are: (1) identification of a problem, (2) selection of the decision criteria which should include the impact on stakeholders' income as well as costs to the community if applicable, (3) selection of feasible management systems or design alternatives, (4) evaluation of the alternatives by simulation models and/or historic data, and (5) recommendation of a decision.
Operational DSSs require further work in the following areas: (1) expert systems to define the problem, aid in parameter estimation, and interpret output, (2) additional simulation models to evaluate a given problem and a set of alternative management systems using the best and most appropriate science and technology, (3) enhanced decision models that examine the effects of uncertainty in simulation model output and the propagation of uncertainty in the decisionmaking process, (4) data bases provide the DSS with the most up-to-date information available, and (5) GIS interfaces for spatially varying data, processes, and information.
Examples of smaller watershed scale, DSS development activities include systems for evaluation and design of shallow land waste disposal systems (e.g., Lane et al., 1991) and evaluation of alternative farm management systems for environmental and economic sustainability (Yakowitz et al., 1993).
The major benefits to science of the development of operational DSS would be the availability of objective methodologies to evaluate natural resource systems simulation models and to identify topics that require additional research. For decisionmakers, the benefits would be systematic decisionmaking tools which would couple the best simulation modeling with decision theory in repeatable, and thus, scientifically defensible manners.
Some major DSS development activities are under way. The Center for Advanced Decision Support for Water and Environmental Systems (CADSWES) at the University of Colorado is developing a workstation based DSS for the Tennessee Valley Authority, the Bureau of Reclamation, and the Electric Power Research Institute. Also, the Colorado Water Conservation Board is developing a DSS for water planning in the Colorado River Basin.
Several large efforts are under way to develop decision support systems for watersheds. As part of the South Florida restoration effort, a large DSS is being built to evaluate the watershed impacts of various control alternatives. The Watershed and River Systems Management Initiative between Bureau of Reclamation and USGS is supporting the development of computer models and fully integrated data management systems to help water managers and water users increase the environmental, economic, and social benefits of water systems and improve management of water resources facilities. These models were Originally tested on the San Juan and Lower Colorado Rivers but are designed to be used on any Reclamation watershed (Bureau of Reclamation, 1997). A centralized and integrated data center for the Colorado River Basin would collect and disseminate comprehensive, reliable, scientific and economic data for all interested users. The
existing Grand Canyon Monitoring and Research Center could be used as a model for this organization. McLaughlin Water Engineers and Aiken (1997) recommend the development of a DSS for the entire Platte River Basin to help resolve numerous technical issues about hydrology and water quality in the Platte River Basin. They cite how the Colorado River DSS was used in the Colorado River Endangered Fish Recovery Program. A common model and DSS would help reduce fear and mistrust among the states and federal agencies. They also recommend improved scientific studies to better understand the hydrology of the Platte River Basin. They cite the Missouri River Basin modeling as part of the Annual Operating Plan process as an example of how federal leadership with simulation models can help resolve conflicts.
Given the difficulties of using and interpreting complex natural resource simulation models and data at the watershed scale, it is necessary that we develop decision tools to assist decisionmakers in watershed management programs and to facilitate transfer of simulation modeling technology.
TMDL Development as an Illustration of Information Status and Gaps
One example of an area where data gaps limit the usefulness of a watershed management approach relates to implementation of Total Maximum Daily Load (TMDL) requirements. Under the precepts of Section 303(d) of the Clean Water Act (CWA), states must identify pollution-impaired streams and develop plans to reduce pollutant loads. They then set TMDLs for individual water bodies that account for both point and nonpoint sources of pollutants. Development of TMDLs requires a broad understanding of point and nonpoint sources, the processes that influence their magnitude, timing, transport to bodies of water, and attenuation en route, and how they affect aquatic biota. This procedure tends to be highly site-specific, and watershed managers are challenged by frequent gaps in data, information, and modeling in their efforts to comply with this section of the CWA.
Development of a TMDL presupposes that a water body has been classified as water quality impaired, that its condition has been ranked and prioritized with respect to other impaired waters within a state, and that standards for specific contaminants have been established. These initial steps already require substantial data collection and synthesis. A broad range of contaminants must be measured for all likely impaired sites, and their variation with season, discharge, and other factors monitored and understood. Questions regarding the relative importance of varying amounts of a range of contaminants at different sites must be answered; how can we compare the relative importance of nutrients, sediment, low oxygen, and toxic contaminants? Worst case conditions need to be determined. For locations that are influenced by both point and nonpoint sources, it may not be clear whether this should be under low flow (when point sources receive least dilution) or high flow (when nonpoint sources often make their great-
est contribution). Many models are available to help in the identification and ranking process, ranging from simple mass balances and regressions, through steady-state numerical models, to dynamic computer models that predict both temporal and spatial variation in a range of contaminants. The simpler models generally require less site-specific data and produce simple and/or less reliable predictions. The more complex models have the capability of describing changing contaminant levels over broader scales of space, time, and other conditions, but may require considerable data input, and still need to be verified by extensive real word measurements.
Once standards have been established, TMDL development involves allocating loads among all point, nonpoint, and background sources within a watershed. A margin of safety needs to be added, and allowances may be made for future watershed development. Allocation requires a clear understanding of all the significant sources in a drainage basin and how they are linked to and influence water quality in the receiving body of water. For some point sources and contaminants, this maybe relatively straightforward, especially under baseflow conditions. But for nonpoint sources, contaminants with complex biogeochemical behavior, and stormflows, reliably relating inputs to final water quality pushes the limits of current understanding of watershed processes and how to incorporate them into the present generation of models. Models exist, but their ability to reliably predict contaminant loads from nonpoint sources, especially for unusual ''worst case" conditions, is questionable. In spite of this uncertainty, watershed managers. must make decisions, even if they are based on imperfect information.
As of this writing, USEPA makes available through the Center for Exposure Assessment Modeling a total of 21 models that collectively address aspects of urban runoff; leaching and runoff from soils; transport through soil and ground water; conventional and toxic pollution of streams, lakes, and estuaries; near-field mixing and dilution in rivers, lakes, estuaries, and oceans; cohesive sediment transport; river and tidal hydrodynamics; geochemical equilibrium; and aquatic food chain bioaccumulation. These models are based on the best available understanding of watershed processes, and they are constantly being refined and updated, but still remain an imperfect representation of the real world. In addition, these models are only as good as the input data that are available, and for the more sophisticated models, measurement coverage in time and space is rarely adequate. Furthermore, each model tends to focus on only a few elements of the web of processes that link the generation of nonpoint sources to water quality variations in space and time in a receiving water body. Linking these parts remains a manual task, which can become almost prohibitively time consuming.
Numerous additional considerations often are not addressed by the TMDL process. For example, in terms of their relative ecological importance, what is the trade-off between setting standards in terms of ambient contaminant concentrations in a water body as opposed to the total load carried by a stream (normalized per area of contributing watershed)? What interactions exist among con-
taminants, either additive or antagonistic? How should dissolved and particulate forms of contaminants be compared considering the varying uptake pathways, aquatic habitat types, and life histories of different target organisms? What about exchange between dissolved and particulate contaminant forms under varying background conditions, and how should colloidal forms of contaminants be treated? At present, colloidal forms of contaminants are rarely measured, yet they can comprise a major portion of the filter-passing contaminant load. Furthermore, within the dissolved fraction, what is the relative effect on biota of various chemical species, and how can distribution among these species be predicted? These topics are the subject of active research today, and our predictive capabilities are rudimentary.
Partly because of existing data gaps and limitations in our knowledge of the structure and function of watershed ecosystems, development of TMDLs has proceeded slowly. So far roughly 500 TMDLs have been initiated and of these only 225 have been completed and approved. By comparison, the USEPA estimates that there are a total of 15,000 water quality impaired water bodies in the United States.
Conclusion
Watershed science seeks to understand and explain the structure and function of complex ecosystems, and thus it is inherently a multidisciplinary effort that integrates biological, chemical, physical, and social sciences. Implementation of watershed management activities requires more effective integration of ecological, economic, and social considerations, and such integration depends on the availability of appropriate data and information. More. data and information are readily available to the interested citizen, manager, researcher, and decision-maker than ever before—often free over the Internet (see Appendix B for examples). Geographic information systems are an especially valuable tool for watershed management. But despite significant progress over the past decade, there are still gaps in scientific understanding—gaps in basic data related to water quality, gaps in our understanding of watershed processes, and gaps in the capabilities of simulation modeling and decision support systems.
References
Benoit, G., 1994. Clean technique measurement of Pb, Ag, and Cd in fresh water: A redefinition of metal pollution. Environ. Sci. Technol. 28: 1987-1991.
Blodgett, J.E., 1983. Summary of hearings on "National Environmental Monitoring". Congressional Research Service, Washington, D.C.
Briggs, J.C., and J.F. Ficke. 1977. Quality of the rivers of the United States, 1975 water year based on the National Stream Quality Accounting Network (NASQAN). Open-File Report 78-200. U.S. Geol. Surv., Reston, Va.
Dendy, F. E., and W. A. Champion. 1978. Sediment deposition in U.S. reservoirs: summary of data reported through 1975. U.S. Department of Agriculture, Agricultural Research Service Miscellaneous Publication 1362.
Detenbeck, N.E., C.A. Johnston, and G.J. Niemi. 1993. Wetland effects on lake water quality in the Minneapolis/St. Paul metropolitan area. Landscape Ecology 8:39-61.
Eidenshink, J. 1992. The 1990 conterminous U.S. AVHRR data set. Photogrammetric Engineering & Remote Sensing 58:809-813.
Forest Ecosystem Management Assessment Team (FEMAT). 1993. Forest ecosystem management: an ecological, economic, and social assessment. Report of the Forest Ecosystem Management Assessment Team, USDA Forest Service, Portland, Oregon. 530 pp.
Glover, F., Klingman, D. and N. Philips. 1992. Network Models in Optimization and Their Applications in Practice. New York: J. Wiley.
Goodchild, M. R., B. O. Parks, and L. T. Steyaert (eds.) 1993. Environmental Modeling with GIS. Oxford University Press.
Hren, J., C. J. O. Childress, J. M. Norris, T. H. Chaney, and D. N. Myers. 1990. Regional water quality. Environ. Sci. Technol. 24: 1122-1127.
Jensen, S. K., and J. O. Domingue. 1988. Extracting topographic structure from raster elevation data for geographic information system analysis. Photogrammetric Engineering and Remote Sensing 54:1593-1600.
Johnston, C. A., N. E. Detenbeck, J. P. Bonde, and G. J. Niemi. 1988. Geographic information systems for cumulative impact assessment. Photogrammetric Engineering and Remote Sensing 54:1609-1615.
Johnston, C. A., N. E. Detenbeck, and G. J. Niemi. 1990. The cumulative effect of wetlands on stream water quality and quantity: a landscape approach. Biogeochemistry 10:105-141.
Kovar, K., and H. P. Nachtnebel. 1996. Application of Geographic Information Systems in Hydrology and Water Resources Management. IAHS Publication No. 235. International Association of Hydrological Sciences Press, Wallingford, UK.
Lane, L. J., J. Ascough, and T. E. Hakonson. 1991. Multiobjective decision theory—decision support systems with embedded simulation models. ASCE Irrigation and Drainage Proceedings, July, Honolulu, HI. pp. 445-451.
Lytle, D. J., N. B. Bliss, and S. W. Waltman. 1996. Interpreting the State Soil Geographic Database (STATSGO). Pp. 49-52 in M. R. Goodchild, L. T. Steyaert, B. O. Parks, C. A. Johnston, D. Maidment, M. Crane, and S. Glendinning (eds.) 1996. GIS and Environmental Modeling: Progress and Research Issues. Fort Coliins, Colo.: GIS World Books.
Meijerink, A. M. J., H. A. M. de Brouwer, C. M. Mannaerts, and C. R. Valenzuela. 1994. Introduction to the use of geographic information systems for practical hydrology . ITC Publ. No. 23. UNESCO International Hydrological Programme and the International Institute for Aerospace Survey and Earth Sciences (ITC), Enschede, The Netherlands.
Naiman, R. J., P. A. Bisson, R. G. Lee, and M. G. Turner. 1997. Approaches to management at the watershed scale. Pp. 239-254 in K. A. Kohm and J. F. Franklin, editors. Creating a forestry for the 21st century: the science of ecosystem management. Washington, D.C.: Island Press.
National Research Council (NRC). 1992. Restoration of Aquatic Ecosystems. Washington, D.C.: National Academy Press. 552 pp.
National Research Council (NRC). 1996. Upstream: Salmon and Society in the Pacific Northwest. Washington, D.C.: National Academy Press.
National Research Council (NRC). 1997. Watershed Research in the U. S. Geological Survey. Washington, D.C.: National Academy Press.
National Science Foundation/U.S. Environmental Protection Agency (NSF/EPA). 1998. Proceedings: 1998 Water and Watersheds Program Review. Arlington, Vir.: National Science Foundation.
Powell, M. 1995. Building a national water quality monitoring program. Environ. Sci. Technol. 29: 458A-463A.
Reitsma, R. F., E. A. Zoyana, S. C. Chapra, K. M. Strzepek. 1996. Decision Support Systems for Water Resources Management. Chap. 33 in L. Mays (ed.) Water Resources Handbook, New York: McGraw-Hill, pp. 33.1-33.35.
Trimble, S. W., and K. P. Bube. 1990. Improved reservoir trap efficiency prediction. The Env. Prof. 12:255-272.
Trimble, S. W., and R. U. Cooke. 1991. Historical sources for geomorphological research in the United States. Prof. Geographer, 43:212-228.
U.S. Environmental Protection Agency. 1993. The Watershed Protection Approach: A Project Focus. Draft. Washington, D.C.: USEPA Office of Water (WH-553).
U.S. Geological Survey (USGS). 1982. Hydrologic Unit Map of the United States (map, scale 1:5,000,000). Washington, D.C.: U.S. Government Printing Office.
Windom, H. L., J. T. Byrd, R. G. Smith, Jr., and F. Huan. 1991. Inadequacy of NASQAN data for assessing metal trends in the nation's rivers. Environ. Sci. Technol. 25:1137-1142
Yakowitz, D. S., L. J. Lane, and F. Szidarovszky. 1993. Applied Mathematics and Computation 54:167-181.


