
5
Connecting Science and the Decisionmaker
Significant scientific knowledge, data, and information are available to address watershed management problems. However, these scientific tools are not useful to the manager unless they are effective, readily available, and easy to use. The purpose of this chapter is to explore the connection between scientific efforts and the decisionmaker by outlining five important areas where science might reasonably be expected to aid management. We begin by illustrating the major indicators of watershed conditions as they are understood from a scientific perspective but that are also applicable by managers. We review at some length the promising approach of ecological risk assessment as a way of indicating how scientific thinking can improve the effectiveness of decisions. Watershed restoration is a venue for the interaction between science and management that illustrates both the strengths and weaknesses of scientific knowledge in the applied problem-solving arena. The case.' study of watershed management in the state of Washington provides an important object lesson on the integration of science, data, and diverse public policy goals. Finally, we turn our attention to the need for improved process based research to improve scientific tools for use by managers in addressing watershed problems.
Indicators Of Watershed Condition
One area that promises to improve watershed science is the effort to develop simulation models that can help predict watershed conditions. At the international level, the Organization for International Economic Cooperation and Development (OECD) has initiated a significant program to develop environmental
indicators for the impacts of agriculture (OECD, 1997). The OECD program seeks to improve our understanding of the agricultural-environmental relationships affecting sustainability in agriculture so that managers can better develop, monitor, and assess agricultural programs that address the environmental problems.
The OECD's selection criteria for agricultural-environmental indicators include: (1) policy relevance, (2) analytical validity, (3) measurability, and (4) level of aggregation (i.e., scale issues, including both space and time). These criteria could be especially relevant to watershed management if the OECD definitions of various units of scale (i.e., field, farm, watershed, regional, national, and global) were modified so that watersheds were addressed.
In many areas in the American West, rangelands are critical components of watersheds. The National Research Council has defined rangeland health as "the degree to which the integrity of the soil and the ecological processes of rangelands are sustained" (NRC, 1994). The Natural Resources Conservation Service (NRCS), Bureau of Land Management (BLM), and other agencies and organizations charged with management of some 740 million acres (300 million hectares) of western rangelands (about a third of all U.S. land) have initiated programs to identify attributes comprising indicators for rangeland health, focusing on soil stability and watershed function. Research organizations such as the U.S. Department of Agriculture Agricultural Research Service (ARS) and the Land Grant Colleges in the West are also developing research programs to quantify watershed health and its indicators across a range of watershed scales and environments. Efforts to better quantify watershed health are under way in many areas, and one example is presented in Box 5.1.
Ecological Risk Analysis and Uncertainty
One ingredient that is built into successful watershed management is the use of "good science" in decisionmaking, but even the best science is inadequate to remove all uncertainty when dealing with environmental, economic, and social systems. The manager would prefer that the scientist or engineer provide hard and fast numbers with clearly understood implications, but despite the use of the best available models, data, and ideas, experts cannot offer precise understanding about the way. watersheds and their components work. Risk assessment is one method of improving the usefulness of science for the decisionmaker because it provides improved understanding of the degree and types of uncertainty in management applications (NRC, 1993). Ecological risk assessments differ from environmental impact analysis and hazards assessments. The issue of uncertainty is of special importance to watershed managers because they often must work with incomplete information, and because watershed processes exhibit random, or stochastic, behavior. Environmental risk assessment is a scientific procedure that can augment the tool kit of the manager in dealing with an uncertain world where
the objective cannot be to eliminate all risk. Success in watershed management is partly defined by the ability to account for risk and to succeed in spite of it.
Ecological risk assessment seeks to produce a scientific evaluation of ecological risk that enables managers to make informed environmental decisions (EPA, 1996). Ecological risk assessment is important for environmental decisionmakers because of the high cost of eliminating environmental risks associated with human activities and the necessity of making decisions in the face of uncertainty. Risk-based environmental decisionmaking seeks to balance the degree of risk to be permitted against the cost of risk reduction and against competing risks (Suter, 1993). The risk manager is given scientific information to consider along with the other factors (political, social, legal or economic) in selecting a course of action.
"Specifically, ecological risk assessment evaluates the likelihood that adverse ecological effects may occur or are occurring as a result of exposure to one or more stressors" (EPA, 1992). In this definition, stressors can be chemical, physical, or biological, and can affect organisms or an ecosystem function. The focus is on the ecosystem and the effects that human impacts cause. An ecological risk assessment attempts to predict what might occur as a result of a potential threat or to evaluate consequences of past actions. Regional organizations often use the method to evaluate series of complex problems (see Box 5.2).
In an ecological risk assessment, changes in ecological processes can be expressed as a function of changes in exposure to a physical, chemical, or biological stressor. The risk assessment can provide a basis for comparing and ranking alternatives on the basis of risk. An explicit evaluation of uncertainties is inherent in the ecological risk assessment, and the use of well-defined and relevant endpoints helps to ensure that the results will be expressed in a way that the decisionmaker can use them.
The process for developing an ecological risk assessment as laid out in the U.S. Environmental Protection Agency (EPA) Guidelines (1996) has three primary phases (Figure 5.1): problem formulation, analysis, and risk characterization. At the beginning of the process the risk assessor and the risk manager need to discuss the problem at hand. The risk manager is charged with protecting environmental values and needs to make sure that the ecological risk assessment will provide information relevant to that goal. The ecological risk assessor ensures that science is effectively used to address ecological concerns (EPA, 1996). Together they determine the purpose for the risk assessment by defining the decisions to be made in the context of the management goals. Because this would be a watershed-based, or regional ecological risk assessment, there needs to be a clear understanding of the scope of the assessment, with the watershed defining the regional scale.
The problem formulation phase identifies the goals, objectives, and clearly defined assessment endpoints. As explained by EPA (1996), "The ecological resources selected to represent management goals for environmental protection
|
Box 5.1 Willapa Bay Watershed Washington: Quantifying Watershed Conditions  Quantifications of watershed variables for research and management in the Willapa Bay Watershed of Washington provides an instructive example of the types and range of measurable indicators in watersheds. The Willapa Bay Watershed includes 1,180 sq. mi. of four western Washington counties. Its 1,470 miles of streams drain forested and agricultural lands, and supply water and nutrients to coastal wetlands. The long-term residents take pride in their management of lumbering, fishing, and farming, while short-term residents seek second-home and retirement amenities quite different from traditional pursuits. Since the early 1800s, increasing unemployment, protection of scenic amenities, declining commercial fish catches, and lumbering regulations have fueled discord among watershed coalition called the Willapa Alliance with protection of environmental quality. The Alliance's first published report, "Willapa Indicators for a Sustainable Community." The Alliance selected measures with the specific purpose of assessing economic, social, and environmental characteristics of the watershed. Although the parameters address particular needs of the Pacific Northwest watershed, they provide an example of the kinds of measures that may be useful in a range of setting across the nation. The indicators include the following: |
are reflected in the assessment endpoints that drive the assessment process. Assessment endpoints often reflect environmental values that are protected by law, provide critical resources, or provide an ecological function that would be impaired (or that society would perceive as having been impaired) if the resource were altered." The endpoint also needs to be something that will be affected by the known or potential stressor. At a watershed scale there are multiple stressors and multiple endpoints, so the interactions become more complicated. The risk
|
Environmental:
Economic:
Census:
Community:
The Willapa Alliance has not yet solved every problem in the watershed, but it does have a better understanding of trends of change through these indicators. Most of the indicators are quantitative data readily available from county records or (in a few cases) from state or federal sources. Other watershed alliances might choose different specific measures, but the Willapa example demonstrates the sorts of indicators that are informative and easily obtained. |
assessor must therefore recognize the possibilities for synergism, antagonism, and interference in the measurement of effects.
The definition of endpoints can provide a conceptual model that connects ecological entities, stressors, ecosystem processes, and responses. The model may be in text or visual form. The model also includes risk hypotheses, which are statements of assumptions about risk based on available information. An
|
Box 5.2 The Susquehanna River Basin: Competing Problems and an Organizational Response  Problems in the Susquehanna River basin and the establishment of the Susquehanna River Basin Commission illustrate the kinds of issues and resulting organizations that give rise to the use of risk assessment in environmental management. The Susquehanna River Basin is the 16th largest in the United States, draining 27,500 sq. mi. of New York, Pennsylvania, and Maryland. The river flows 444 miles from mountain terrain through urbanized areas to the Chesapeake Bay, forming the largest riverine ecosystem east of the Mississippi. The river supplies 43 percent of the drainage to the Chesapeake Bay, one of the most productive estuarine ecosystems in the nation. Because the productivity of the bay is linked to the delicate balance between salt water from the Atlantic Ocean and fresh water from its inland tributaries, human impacts on the rivers, and especially the Susquehanna, have direct and long-term implications frothe bay. About 4 million people live in the basin, which has 65 percent of its area in forest, 30 percent in agriculture, and 5 percent developed for intensive uses such as urban activities. The basin has experienced chronic water quality problems that extend to impacts in Chesapeake Bay. The river delivers up to 132 million pounds (60 million kilograms) of nitrogen to the bay each year, with 93 percent coming from nonpoint sources including agricultural runoff, atmospheric deposition, septic systems, and urban runoff. These sources contribute smaller but problem |
analysis plan emerges from the combination of the conceptual model and the assessment endpoints.
The second phase is analysis, which includes measures of exposure, ecosystem properties, receptor characteristics, and effects. An exposure profile is developed by analyzing the measures of exposure; a stressor-response profile is developed based on an ecological response analysis of the effects measured. Risk characterization, the final phase, assesses these two profiles together.
Risk characterization requires making an estimate and a description of the risk and communicating those results to the risk manager. Risk estimation determines the likelihood of adverse effects to the assessment endpoints by integrating
|
atic quantities of phosphorus. Additional water quality problems derive from acid mine drainage from coal mines. Water quality is an issue at the outlet of the basin, but within the basin a major issue is water quantity. Generally there is an overabundance of water, but during drought periods water consumption in the basin of about 450 million gallons per day creates a myriad of problems. During the 1994-1995 drought, for example, surface flows were only one-third the normal flows, resulting in fish kills, high stream temperatures, low dissolved oxygen levels, significant crop losses, and severe restrictions on water use in 30 area water delivery systems. The drought was followed in 1996 by floods causing $600 million in damages and producing a massive influx of sediment to the bay. The complex natural system and equally entangled administrative jurisdictions brought about the need for a regional decisionmaking structure. In 1971, federal, state, and local entities formed the Susquehanna River Basin Commission to develop and implement programs to address the basin's outstanding problems. The commission members include representatives from each of the states as well as the federal government. Their specific charge is to resolve problems related to:
Environmental risk assessment has proven to be an important tool used by the commission as it examines options for addressing these varied goals. |
exposure and effects data and evaluating any associated uncertainty. The ideal is to quantify all risk. However, sometimes a lack of specific information makes it necessary to express risks qualitatively using categories such as high, medium, and low.
There are other methods currently in use that seem very similar. They are Environmental Impacts Statements (EIS) as required by the National Environmental Policy Act 1969, risk assessments, and hazard assessments. Though there are some similarities, there are also major differences in focus among these approaches.
The EIS is a special form of the more general method of environmental
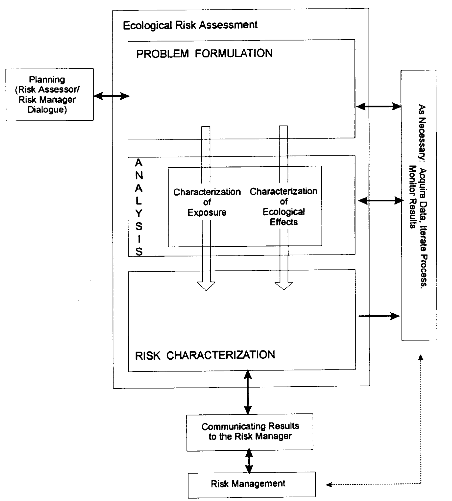
FIGURE 5.1
The framework for ecological risk assessment. Ecological risk assessment is shown as a three-phase process including problem formulation, analysis, and risk characterization. Important activities associated with ecological risk assessment include discussions between risk assessors and risk managers and data acquisition and monitoring. Ecological risk assessments frequently follow an iterative or tiered approach. SOURCE: EPA, 1996.
assessment. The EIS is performed only on major federal actions that would significantly affect the environment. It is a predictive exercise that compares effects on the environment from different alternatives, including a ''no action" alternative. Because an EIS is a full disclosure document, it must identify a full range of the components in the affected environment. Temporal as well as secondary and tertiary effects are identified. This approach has tended to create a checklist or matrix of actions and possible impacts. A deterministic approach is taken, and though uncertainties should be identified, they rarely are. The assessment ends up being a discussion of species and site-specific interactions. Risk assessment grew out of the actuarial work of insurance companies concerned with estimating probability and magnitudes of undesirable events. It evolved partly to evaluate environmental risk assessments that arise or are transmitted through the air, water, soil, or biological food chain to man. It also includes effects of natural hazards such as floods, earthquakes, and landslides on people and on the natural environment. Risk assessment has generally emphasized risks to humans or their property and has ignored ecological effects. It sometimes falsely assumed that what protects human health automatically protects nonhuman organisms and thus ignored or underestimated many ecological risks. For instance, ammonia and chlorine are toxic to fish and bacteria at concentrations that are not harmful to humans.
Hazards assessment is a commonly used method for analyzing the effects of chemicals on the natural environment. It compares the expected concentration in the environment with the estimated toxic threshold, and makes a judgment whether the proposed release is safe, hazardous, or insufficiently characterized for making a decision. Hazards assessment does not use probabilistic methods, and does not attempt to predict the nature or magnitude of the effects (Suter, 1993).
One of the basic understandings of the scientific method is that reported results often contain some error and uncertainty. Yet scientific reports often omit any explicit statement about error, uncertainty, and assumptions made in doing the research, leading to misunderstandings and disagreements about what was found or what the data mean. A related problem occurs when technical professionals must report to general audiences, who are not accustomed to dealing with uncertainty as a ubiquitous and normal part of the natural world. In this case, discussions of kinds and levels of uncertainty can be mistaken for an admission of flawed analysis rather than evidence of careful inquiry. One of the basic underpinnings of ecological risk assessment is that uncertainty and assumptions will be clearly stated. Suter (1993) outlined three basic sources of uncertainty: the inherent randomness of the word (stochastic behavior); imperfect or incomplete knowledge of things that could be known (ignorance); and mistakes or execution of assessment activities (error). Incorrect measures, misidentification, data recording errors, and computational errors are issues of quality assurance. "Fundamental ignorance results in undefined uncertainty, the 'unknown unknowns'
that cannot be described or quantified. More commonly, ignorance is simply a result of practical constraints on our ability to accurately describe, count, or measure everything that pertains to a risk estimate" (Suter, 1993).
EPA (1996) added other categories in its discussion of uncertainty. The authors note that along with descriptive errors, errors in the information itself, and variability (i.e., uncertainty about a quantity's true value and data gaps), unclear communication can also create uncertainty. Sources of uncertainty can also arise in the development and application of models, the structure of process models, and the description of the relationship between two or more variables in empirical models.
Methods for analyzing and describing uncertainties range from simple to complex. In some Cases it is merely necessary to state the assumptions that went into the research. Classical statistical methods can describe uncertainty in measurable parameters. In simulation modeling, sensitivity analyses should be used. The availability of software for certain straightforward analyses has increased the use of probabilistic methods. Whatever method of ecological risk assessment one uses, the sources of uncertainty should be explicitly addressed. This will add credibility to the analysis and the information presented to the decisionmaker.
Watershed Restoration Strategies
In response to policy direction from the Clean Water Act of 1977 and its revisions, government agencies at all levels have an increased interest in environmental restoration as a route to sustainable environmental quality while fostering economic vitality. Restoration is a fertile meeting ground for science and management. Scientists engaged in restoration research quickly learn that their abstract theories do not always play out well in the complex real world, and they must modify or simplify their thinking. Managers engaged in restoration work learn that the systems they try to influence are more complex and interconnected than at first seems the case.
In the vast majority of watersheds in the United States, population growth and natural resource development have altered the characteristics and functions of land and water ecosystems. The last two centuries, and particularly the last 50 years, represent a period of rapid transition for watershed ecosystems. Although the degree of alteration varies widely throughout the nation, significant habitat impacts and losses are common. The variety of impacts and social and economic constraints to restoration suggest that a diversity of strategies are needed to improve watershed conditions.
Where natural communities continue to survive and maintain healthy populations, the protection of intact aquatic and riparian habitats often represents a high priority in watershed protection or restoration efforts. When protection is the goal, human influences and stresses on ecosystem behavior are often prohibited or minimized.
Where watersheds have been degraded by human activities but have the potential to recover the characteristics and features that make them functionally similar to a pristine system, "restoration" may represent the preferred management strategy. These situations might include watersheds where a return to natural streamflow, nutrient, and sediment regimes is possible. Candidates for the restoration option often include areas that have experienced some adverse impacts from historical land and water management, but which are capable of self-recovery. If human disturbances can be modified to reduce or eliminate potential impacts to a watershed's hydrology and sediment production, the prognosis for long-term reestablishment of natural processes is favorable.
Management policies directed at the watershed restoration option can potentially proceed along two major pathways: (1) natural or passive restoration, where the watershed is allowed to recover naturally, and (2) active restoration, which involves human intervention to accelerate the recovery process. In natural restoration, removing the sources of anthropogenic disturbance is all that is necessary to restore the system. For example, where agricultural practices occur in riparian areas, eliminating such practices may allow the long-term reestablishment of riparian vegetation and associated ecological functions. Natural disturbances would combine with the establishment, growth, and succession of riparian plants to assist in restoring aquatic habitats. Similarly, the removal of grazing from streamside zones or a change to grazing policies that allow full recovery of riparian plants along streams may be all that is needed to restore aquatic and riparian functions for many rangeland streams. In forested watersheds that have been heavily logged, establishing no-harvest buffers may allow the restoration of natural plant and animal assemblages. The time required for restoration will vary depending upon local conditions (e.g., species of riparian plants, climate, geomorphic characteristics, and hydrologic disturbance pattern). However, natural restoration always seeks to use the natural abilities of physical (channel adjustments, bank building, scour and fill, etc.), chemical (nutrient transformations), and biological (plant establishment, growth, and succession) processes to functionally restore aquatic and riparian ecosystems.
The first step in active restoration also involves eliminating human activities that are causing environmental degradation. However, where monitoring or observation indicate that recovery will not be complete or may require a very large amount of time, additional management practices can be considered. Active restoration incorporates practices designed to fill an ecological void or accelerate natural recovery. For example, a forested riparian zone may have been harvested years ago, at which time large woody debris was simultaneously removed from the stream channel. Although the growth rates and species composition of the second-growth riparian forest may currently be providing the desired functions within the range of natural conditions, the scarcity of large wood in the stream may not be overcome for many decades. In this situation, placing large woody debris in configurations normally expected for the stream may speed restoration.
In other instances, riparian areas may have been previously used for crop production. Eliminating agricultural practices may initiate natural recovery of riparian functions and aquatic habitat, but because native plant species that would be characteristic of the local riparian system are infrequent, restoration might take an exceptionally long time. In this situation, planting native species of riparian plants obtained from locally adapted genetic stock might accelerate recovery. In rangeland areas where prolonged grazing or other practices have caused the disappearance of willows, cottonwoods, or other key riparian plants along streams, active management may be needed to reestablish a native vegetation community.
The types of practices used in active management can vary widely, but the intent is still the same—to assist or accelerate the restoration of ecological processes and related physical, chemical, and biological characteristics that support natural communities and maintain aquatic productivity. Such practices are intended to aid in reestablishing watersheds that will be, for all practical purposes, functionally equivalent to pristine conditions.
In many wetlands, streams, rivers, and estuaries where habitat alteration and loss have been extensive, restoration per se is no longer a feasible goal. Natural disturbance regimes may have been sufficiently altered that there is little opportunity for them to be restored. Such significant habitat alteration can occur in a variety of circumstances, including where hydrologic and sediment transport regimes are affected by dams, irrigation diversions, changes in fire frequency, or conversion of lands to agricultural practices; where introduced plants have replaced native riparian species; where channel incision has lowered local ground water tables and affected hyporheic interchanges with the stream; where estuaries have been filled; or where road construction, agricultural practices, or urban development have reconfigured channel sinuosity or shifted stream location. For many of these situations, watersheds still have the potential to provide habitat for some native species and provide high quality water and relatively natural conditions for humans to enjoy. However, realizing the potential might require increased levels of effort (time, money, and management persistence). In such cases management can be directed toward reestablishing conditions that are able to provide some (albeit not all) of the ecological processes that occurred historically, a strategy termed "rehabilitation." The rehabilitation option produces some natural habitats, but does not fully restore the watershed to predisturbance conditions.
The rehabilitation option does not seek to restore all of the ecological processes. For example, if a stream previously had a dike constructed along its edge, moving the dike back some distance from the channel would allow the return of streamside vegetation as well as restore some floodplain functions (e.g., temporary storage of floodwaters, sediment deposition on floodplains, and improved interactions between stream and ground water). However, the channel's ability to develop predisturbance sinuosity, density of side channels, or full floodplain functions might remain limited. Even though full restoration is not possible in this example, a major improvement in aquatic and riparian characteristics would
be achieved by repositioning the dike. Rehabilitation projects often represent important and politically acceptable opportunities for developing improved and sustainable habitats for sensitive species.
"Substitution" approaches to watershed management are generally directed toward selectively creating, altering, or modifying habitat features to offset the effects of anthropogenic impacts, sometimes in a different location. While the term "enhancement" carries with it the implied message of improvement and betterment of a system, it is important to realize that if ecosystem needs are misinterpreted, a watershed enhancement project may actually shift an ecosystem from one degraded state to another (NRC, 1992; NRC, 1996). For example, fully spanning logs with bank revetments may be placed in a stream deficient of pools to provide additional pool habitat. However, if the new pools are without cover and losses to predation are increased, or if the logs create waterfalls that become barriers to juvenile or adult fish movements, or if the channel can no longer adjust to high flows and sediment transport by altering sinuosity or creating natural pools the enhancement will actually degrade the stream.
Where habitat losses are unavoidable, "mitigation" (i.e., replacement of lost habitat with habitat at another location) is a management option that attempts to minimize or offset the effects of habitat loss. Although the concept of mitigation is relatively simple, its application often is not. Losses of habitat that occur at a particular site are seldom balanced by mitigation at another site, because such mitigation rarely replaces all relevant ecological interconnections. If a key watershed feature is significantly altered or destroyed, there may be no suitable means of mitigating that impact elsewhere.
Watershed improvement projects tend to focus on the characteristics and needs of a particular site, but the condition of individual habitats, stream reaches, and entire tributary systems within a watershed must be considered for restoration planning to be effective. It may do little good to invest time and money restoring individual habitats (e.g., bird nesting sites, spawning gravels for fish) if other types of habitat are in short supply or downstream barriers to animal migration greatly limit accessibility to the improved site. Likewise, it may do little good to emphasize riparian restoration where excessive sediment production from land uses or water withdrawals upstream from the project prevent riparian recovery. Watershed managers should be aware of how conditions change as a result of a wide range of anthropogenic perturbations and natural disturbance patterns. This awareness can be greatly improved with a thorough watershed-wide assessment of the current range of conditions and disturbance history. The complexity of environmental factors and management options available presents a major challenge to the effective reduction of anthropogenic impacts, yet it is critically important that any strategy adopted accounts for the extent of watershed alteration and the potential for self-recovery.
All of the strategies discussed—passive and active restoration, rehabilitation, enhancement, and mitigation—require improved scientific knowledge and
predictive capabilities to reach their full potential. Only through a better understanding of watershed ecosystem structure and function will it be possible to decide which strategies are appropriate and whether the consequences of ecosystem manipulation will be beneficial or harmful. Such scientific knowledge and understanding are still often lacking for many decisions regarding watershed restoration activities. Future research should put a high priority on integrative interdisciplinary research that can guide ecosystem restoration.
Watershed Analysis in the State of Washington
The integration of data, information, and science is one of the most difficult challenges of watershed management, and because of the variability from place to place in a nation as diverse as the United States, there is no one way to achieve integration. The experience of the state of Washington, however, provides an instructive example to watershed managers on how diverse sets of information, stakeholders, resources, and scientific ideas can be integrated into an effective watershed management strategy.
The state of Washington's approach to managing forestry operations in its watersheds illustrates current uses of data, information and science in watershed management decisions. In the early 1970s, Washington, like other states in the Pacific Northwest, enacted a Forest Practices Act to regulate forestry activities on the state's 12.5 million acres of state and privately owned forests. The Act's purpose was to protect fish and wildlife habitat, prevent soil erosion, maintain water quality, and ensure a sustainable supply of forest products by specifying prompt reforestation of logged areas. In part, the Forest Practices Act was a response to the federal Clean Water Act and its requirement that states formulate nonpoint pollution control plans, but it was also the result of increased public recognition that unregulated forestry operations had caused significant environmental degradation. During the 1970s and early 1980s the Act underwent several revisions in response to new scientific information, but the regulations only considered forestry operations individually; it contained no provisions for regulating more than one operation at a time, and the law did not provide a watershed context. By the late 1980s it was clear that existing laws were not up to the task of controlling the environmental impacts of multiple activities within whole watersheds.
The Washington Forest Practices Board, which sets forestry policies for state and private lands, recognized that the "one-size-fits-all" forest rules based on "Best Management Practices" could not effectively prevent the cumulative harmful effects of multiple forestry activities, defined as "the changes to the environment caused by the interaction of natural ecosystem processes with the effects of two or more forest practices" (Washington Forest Practices Board, 1995).
In 1987 an agreement was reached between Washington state agencies, large and small private land owners, Native American treaty tribes, and environmental
organizations. This agreement, called Timber/Fish/Wildlife (TFW), called upon various constituencies to act together to protect the state's natural resources on commercial forest land without having to continually resort to litigation. Although this agreement has had its share of successes and failures (Halbert and Lee, 1990), it has survived nearly a decade and continues to incorporate scientific information into the decisionmaking process. The original TFW agreement suggested an approach to addressing cumulative effects that contained five components: (1) state, regional, and basin goal setting, (2) use of risk assessment techniques to identify problems, (3) implementation of an adaptive management process, (4) monitoring and evaluation to determine if goals are being met, and (5) reevaluation Of goals as new information becomes available (Washington Forest Practices Board, 1995).
From 1989 to 1991, TFW participants developed a process through which the chief regulatory agency—the Washington Department of Natural Resources—could specify what management practices were needed to minimize cumulative harm in forested watersheds. This process, termed Watershed Analysis, was meant to produce forestry plans tailored to individual watersheds and based on scientific understanding. The watershed analysis protocols developed by TFW participants were formally adopted into law in 1992. Part of the watershed analysis legislation divided Washington state into about 800 watersheds ranging from 10,000 to 50,000 acres (4,000 to 20,000 hectares).
In theory, Washington's approach to watershed analysis is meant to be an adaptive management approach based on biological and physical inventory. The protocol has three phases-resource assessment, prescription writing (rule making), and monitoring—each structured around the boundaries of a particular watershed. Guided by a series of key questions, a team of technical specialists initially develops information and interpretations of resource condition and environmental sensitivities within a watershed. These assessments include maps of sensitive areas as well as reports describing the nature of the sensitivity and the potential risk forest management poses to public resources. This information is fed into a prescription process, or rule-making, in which landowners and agencies develop tailored management plans for the watershed that respond to the resource concerns of the technical specialists. The public is then given an opportunity to review the study and prescriptions before the plan becomes final. Total time to completion is two to five months from initiation of the process to final approval, depending on the size and complexity of the watershed. Once the watershed plan is accepted, the findings are assumed to be valid for five years, after which time the process may be repeated.
In its current form, the resource assessment phase is strongly oriented toward determining the vulnerability of Pacific salmon populations, water quality, and capital structures to logging and road building activities. This orientation is reflected in the structured protocols of the process. Washington's watershed analysis procedure is divided into nine topic areas, or "modules," each conducted by
assessment team members who must undergo a state certification process in one or more modules to participate. The modules are mass wasting (mass soil movements such as landslides), surface erosion, hydrology, riparian function, stream channel processes, fish habitat, potentially vulnerable capital structures (such as bridges), and water quality. (As of early 1998, the water quality module was undergoing development, and a tenth module pertaining to monitoring procedures has also not been completed.)
The state's watershed analysis procedures have been available for approximately four years. During that time only about 5 percent of the state's 800 designated watersheds have undergone a completed watershed analysis. Although this represents a small fraction of the area of state and privately owned forests, most stakeholders feel the approach should be retained. Many, however, have opted to continue operating under standard forest practices rules, thus choosing to forego the potential benefits of tailored, site-specific management plans. Although the reasons for this reluctance have not been fully examined, it appears that many landowners feel they cannot afford the assessment phase (costs of $1-2 per acre have been suggested) or are still somewhat uncomfortable with a process that provides for increased public input into policy decisions.
As a vehicle for bringing traditional adversaries together, watershed analysis in Washington state has been generally successful. For example, the Indian tribes and the environmental community have long complained of having little or no say in land use decisions, and have often used litigation to delay or stop projects they felt were harmful to watershed resources. The watershed analysis process, however, has brought them a seat at the table. As recognized stakeholders in watershed analysis, outside interest groups are free to bring whatever technical expertise they have to the assessment phase, and to provide input to the prescription phase. The importance of bringing everyone with a legitimate concern to the table cannot be underestimated. Not all conflicts have been resolved, but more often than not the prescriptions are based on consensus—a situation that is somewhat unique with respect to forestry operations on state and private lands in the Pacific Northwest.
It is still not clear, however, how well the watershed analysis process is working scientifically and how well its prescriptions are protecting the resources they are designed to safeguard. At its core, watershed analysis has lofty goals: to be an effective adaptive management strategy and to provide a framework for implementing ecosystem management at a watershed scale (Montgomery et al., 1995). Recently, Collins and Pess (1997a-c) have completed an examination of the first 20 watershed analyses with regard to their efficacy (1) as a cumulative effects assessment method, (2) as a framework for implementing ecosystem management, (3) as a watershed restoration tool, (4) as an adaptive management strategy, and (5) as a method for identifying and reducing the dominant direct effects of land management on aquatic resources. They identified a number of significant shortcomings in the process, many of which were related to a lack of monitoring
and extensive use of untested assumptions and models in the hazard assessment process. These failures underscore the need for management informed by science.
Washington's watershed analysis procedure is noteworthy on several counts. First, it explicitly recognizes watershed boundaries as management units and provides a spatial definition of what these units are. Second, the process facilitates co-management of forests and aquatic resources, thus forestalling at least in part some of the bitter environmental disputes that have marked the practice of forestry in the region over the last two decades. Third, the procedure is meant to be adaptive and to be based on principles of ecosystem management. Fourth, the procedure is designed to incorporate the latest decision support technology, including GIS (slope stability, stream habitat, riparian condition) and simulation models (soil erosion, stream temperature changes, woody debris dynamics).
Application of watershed analysis has revealed some significant shortcomings, some of which are related to the newness of the process, some of which are related to lack of scientific information or failure to make use of it when it is available, and some of which are related to the policies of involved organizations (NRC, 1996). In terms of implementing watershed-wide management plans, the current process is limited to forestry operations on state and private lands. Both the agricultural community and some county and municipal land use organizations have resisted participating in watershed analysis. Washington does not have an Agricultural Practices Act similar to its Forest Practices Act. Federal land managers have implemented their own versions of watershed analysis, which usually leads to different, more environmentally restrictive management prescriptions. Lack of effectiveness monitoring severely limits adaptive feedback on site-specific prescriptions. The procedure makes few allowances for natural variability or the beneficial role of natural disturbances in creating and maintaining fish and wildlife habitat. Instead, it tends to impose uniform sets of environmental targets on watershed conditions, regardless of whether these targets are appropriate or achievable. Finally, the procedure lacks a clear rationale for targets that are set.
These shortcomings notwithstanding, Washington's watershed analysis approach incorporates most of the components of an adaptive management system. After several years of implementation, weaknesses of the procedure are becoming clear. The question now is: will participating organizations recognize these deficiencies and take appropriate steps to correct them, or will the watershed analysis protocols become "hardened" into a form that inhibits them from doing what they were designed to do in the first place—provide a decision-support tool flexible enough to enable sound management plans tailored to individual watersheds?
Process-Based Watershed Research
The goals of process-based watershed research are twofold: First, understand the physical, chemical, and biological processes in natural resource sys-
tems, and second, develop tools allowing decisionmakers to make use of that understanding. The overall goal of linking the understanding to decisionmaking tools is usually approached using simulation models, computer programs encapsulating our knowledge in a form useful to managers. These simulation models are especially important in making the connection between science and management because they are placed where the two actually meet and intertwine with each other in an interactive way. Table 5.1 is a summary of selected computer simulation models used in watershed research and development activities and in watershed management. These models were sponsored/developed by EPA, the U.S. Army Corps of Engineers Hydrologic Engineering Center (HEC), ARS, and the U.S. Geological Survey (USGS). These agencies, developed and support these models in cooperation with other federal agencies, universities, state and local agencies, and consulting companies. Therefore, these models are widely used within these agencies and by other agencies and private organizations throughout the world. However, the models described below were selected to show a range of technology and of applications. No attempt was made to include all agencies, technologies, or applications and thus, the compilation is illustrative rather than comprehensive.
The development, testing, and parameterization of simulation models is not a trivial task, because the models are extremely complex; there is a lack of data for internal model verification, validation, and parameterization; objective criteria for model evaluation are not standardized; and model output (point or distributed) is often difficult to interpret. Wurbs (1994) summarized a large number of available water resources models. Most of these models are used to evaluate components of the watershed -- for instance, there are ground water models, urban stormwater runoff models, water distribution system models, and nonpoint pollution models. The discussion of water resources models can be divided into the following categories (Wurbs, 1994):
- demand forecasting and balancing supply with demand
- water distribution system models
- ground water models
- watershed runoff models
- stream hydraulics models
- river and reservoir water quality models
- reservoir/river system operation models
Water resources handbooks edited by Maidment (1993) and Mays (1996) contain extensive information on water resources models. A contemporary watershed model should include simulation of the following features:
- water quantity and quality
- single even and continuous simulation
TABLE 5.1 Selected Hydrologic Models Used in Watershed Management
|
AGNPS - Agricultural Nonpoint Source Pollution Model. (Young et al., 1989) |
|
The model was developed by the U.S. Department of Agriculture, Agricultural Research Service. The primary emphasis of the model is on nutrients, soil erosion, and sediment yield for comparing the effects of various best management practices on agricultural pollutant loadings. The AGNPS model can simulate sediment and nutrients loads from agricultural watersheds for a single storm event or for a continuous simulation. The watershed must be divided into a uniform grid (square cells). The cells are grouped by dividing the basin into subwatersheds. However, water flow and pollutant routing is accomplished by a function of the unit hydrograph type, which is a lumped parameter approach. The model does not simulate pesticides. |
|
AGNPS is also capable of simulating point inputs such as feedlots, wastewater discharges, and stream bank and gully erosion. In the model, pollutants are routed from the top of the watershed to the watershed outlet in a series of steps. The modified universal soil erosion equation is used for predicting soil loss in five different particle sizes (clay, silt, sand, small aggregates, and large aggregates). The pollutant transport portion is subdivided into one part handling soluble pollutants and another part handling sediment absorbed pollutants. The input data requirements are extensive, but most of the data can be retrieved from topographic and soil maps, local meteorological information, field observations, and various publications, tables, and graphs provided in the user manual or references. |
|
ANSWERS — Areal, Nonpoint Source Watershed Environment Response Simulation. (Beasley and Huggings, 1981) |
|
The model was developed by the Agricultural Engineering Department of Purdue University. It is a distributed parameter model designed to simulate rainfall-runoff events. Currently the model is maintained and distributed by the Agricultural Engineering Department, University of Georgia, Tifton, Georgia. To use the ANSWERS model, the watershed is divided into a uniform grid (square elements). The element may range from one to four hectares. Within each element the model simulates the processes of interception, infiltration, surface storage, surface flow, subsurface drainage, sediment detachment, and movement across the element. The output from one element then becomes a source of input to an adjacent element. Nutrients (nitrogen and phosphorus) are simulated using correlation relationships between chemical concentrations, sediment yield, and runoff volume. Snowmelt or pesticides movement cannot be simulated. A single storm rainfall hyetograph drives the model. |
|
BASINS — Better Assessment Science Integrating Point and Nonpoint Sources. (Lahlou et al., 1996) |
|
This model is a multipurpose environmental analysis system for use by regional, state, and local agencies in performing watershed and water quality based studies. It was developed by the U.S. Environmental Protection Agency (EPA) to address three objectives:
|
|
A GIS provides the integrating framework for BASINS. The GIS organizes spatial information so it can be displayed as maps, tables, or graphics. Through the use of the GIS, BASINS has the ability to display and integrate a wide range of information (e.g., land use, point source discharges, water supply withdrawals) at a scale selected by the user. For example, some users may need to examine data at a state scale to determine problem areas, compare watersheds, or investigate gaps in data. Others may want to work at a much smaller scale, such as investigating a particular river segment. These features make BASINS a unique environmental analysis tool. The analytical tools in BASINS are organized into two modules. The assessment and planning module, working within the GIS, allow users to quickly evaluate selected areas, organize information, and display results. The modeling module allows users to examine the impacts of pollutant loadings from point and nonpoint sources. The modeling module includes the following: QUAL2E, Version 3.2, a water quality and eutrophication model; TOXIROUTE, a model for routing pollutants through a stream system; NPSM_HSPF, version 10, a nonpoint source model for estimating loadings. The latest versions of both QUAL2E and HSPF are included in the BASINS package. |
|
HEC-1 Hydrologic Engineering Center, Flood Hydrograph Package. (Hydrologic Engineering Center, 1991) |
|
The current standard version, Version 4.0, represents improvements and expansions to the hydrologic simulation capabilities with interfaces to the HEC Data Storage System (HEC-dss). The dss connection allows HEC-1 to interact with the input and output of other simulation models. New hydrologic capabilities in HEC-1 include: Green and Ampt infiltration, Muskingum-Cunge flood routing, reservoir releases input, and improved numerical solution of kinematic wave equations. This new release of this model also automatically performs numerical analysis stability checks for the kinematic wave and Muskingum-Cunge routings. |
|
HSP-F Hydrologic Simulation Program - FORTRAN. (Donigian et al., 1984) |
|
The HSP-F is a simulation model developed under EPA sponsorship to simulate hydrologic and water quality processes in natural and man-made water systems. It is an analytical tool that has application in planning, design, and operation of water resources systems. The model enables the use of probabilistic analysis in the fields of hydrology and water quality management. It uses such information as time history of rainfall, temperature, evaporation, and parameters related to land use patterns, soil characteristics, and agricultural practices to simulate the processes that occur in a watershed. The initial result of an HSP-F simulation is a time history of the quantity of water transported over the land surface and through various soil zones down to the groundwater aquifer. Runoff flow rate, sediment loads, nutrients, pesticides, toxic chemicals, and other water quality constituent concentrations can be predicted. The model can simulate continuous, dynamic, or steady state behavior of both hydrologic/hydraulic and water quality processes in a watershed. |
|
PRMS - Precipitation-Runoff Modeling System. (Leavesley et al., 1983) |
|
The Precipitation-Runoff Modeling System is a modular, distributed-parameter, physically based watershed model that was developed to evaluate the effects of various combinations of precipitation, climate, and land use on watershed response. Watershed response to normal and extreme rainfall and snowmelt can be simulated to evaluate changes in water-balance relations, flow regimes, flood peaks and volumes, soil-water relations, sediment yield, and groundwater recharge. Parameter optimization and sensitivity analysis capabilities are provided to fit selected model parameters and to evaluate their individual and combined effects on model output. |
|
HUMUS - Hydrologic Unit Model for the United States. (Wang and Srinivasan, 1997) |
|
The Resources Conservation Act of 1997 as amended (RCA), required the Department of Agriculture to appraise the status, condition, and trends in the uses and conservation of nonfederal soil and water related natural resources. The HUMUS project has been designed to provide the technical basis for conducting the appraisal of water resources for the 1997 RCA Appraisal Report. It is intended to provide better information than has ever been obtained before about the uses of water on irrigated and nonirrigated agricultural lands and of the physical and economic effects of changing agricultural practices and cropping patterns on future water needs and supplies. The major components of the HUMUS project are: 1) a basin scale Soil and Water Assessment Tool (SWAT, Arnold et al., 1994) to model the surface and sub-surface water quality and quantity, 2) a Geographic Information System (GIS) to collect, manage, analyze and display the spatial and temporal inputs and outputs, and 3) relational databases needed to manage the nonspatial data and drive the models. The HUMUS project will simulate and validate approximately 350, 6-digit hydrologic unit areas (watersheds) that have been delineated by the USGS for the 18 major river basins in the U.S. Databases used in the analyses include: national resources inventory, national agricultural statistical survey, state soil survey data base, weather parameters, stream flow and reservoir operation data, agricultural census data, input and output of the simulation models and reports for the 350, 6-digit watersheds. |
|
KINEROS - A Kinematic Runoff and Erosion Model. (Woolhiser et al., 1990) |
|
The kinematic runoff and erosion model KINEROS is an event-oriented, physically based model describing the processes of interception, infiltration, surface runoff, and erosion from small agricultural and urban watersheds. The watershed is represented by a cascade of planes and channels; and the partial differential equations describing overland flow, channel flow, and erosion, and sediment transport are solved by finite difference techniques. Spatial variability of rainfall and infiltration, runoff, and erosion parameters can be accommodated. KINEROS may be used to determine the effects of various watershed management practices such as urban developments, small detention reservoirs, or lined channels on flood hydrographs and sediment yield. |
|
SPUR - Simulation of Production and Utilization of Rangelands. (Wight and Skiles, eds., 1987) |
|
The SPUR model is a comprehensive rangeland simulation model developed to provide information for research and management. SPUR is a physically based model designed to provide biophysical simulation capability for rangeland ecosystems. The model is driven by daily maximum and minimum air temperature, precipitation, solar radiation, and wind run. SPUR simulates the daily growth of individual plant species or functional species groups. Animal growth is simulated on a steer-equivalent basis, and net gain is used to calculate economic benefits. The hydrology component calculates upland surface runoff volumes, peak flow, snowmelt, streamflow, and upland and channel sediment yields. Two versions of SPUR address different levels of landscape resolution. The field-scale version was designed to simulate plant and animal interactions at a pasture or field level. The basin-scale version was designed to simulate small watershed processes. |
- physical, chemical, biological, socioeconomic, and institutional components
- windows environment for use on personal computers
- lumped or distributed parameters in the model
- assistance with parameter selection (e.g., parameter optimization methods)
- linkage to optimization models
- linkage to decision support system
- surface, vadose zone, and ground-water components
Unfortunately, no available model comes close to meeting all of these criteria. We continue to rely on models developed during the past 30 years and link them as best we Can to perform some or all of the above functions. Links rarely take the form of active feedback loops, and the nature of such loops often remains a mystery.
The Hydrologic Engineering Center of the U.S. Army Corps of Engineers has made a major commitment to upgrade and integrate their models as part of their NEXGEN effort. HEC-RAS, an updated version of HEC-2, is the first output of this program (U.S. Army Corps of Engineers, 1995a and 1995b). Examples of existing models that are used in the absence of newer models are HSPF (Bicknell et al., 1992), SWMM (Huber and Dickinson, 1988), and SWRRB (Arnold et al., 1990), all of which are supported by the EPA's Center for Exposure Assessment Modeling, located in Athens, Georgia.
A major modeling effort is needed to develop and implement state-of-the-art models for watershed evaluations. In a review article, Goodrich and Woolhiser (1991) examined the state of the art in our understanding of entire catchment response. They concluded that even at watershed scales of up to roughly 200 sq. mi. (500 sq. kin.), hydrologists lacked detailed and processes-based understanding, and thus also lacked the ability to develop simulation models to adequately describe hydrologic response. Notably, this failure is for a single, physical component of the functioning of the entire watershed, one that might be expected to be relative easy to describe and predict.
Results of attempts to model the hydrologic response of the 60 square mile (150 sq. km) Walnut Gulch Watershed in Arizona seem to support the need for improved models. Michaud and Sorooshian (1994) applied a distributed, kinematic cascade event model called KINEROS (Woolhiser et al., 1990), a simple lumped model (SCS, 1964), and a distributed version of the SCS model to Walnut Gulch. KINEROS and the distributed SCS model were comparable in their ability to fit measured data when calibrated, and both were superior to the lumped model. Also, KINEROS was more accurate when used without calibration. However, none of the models were able to accurately simulate peak runoff rates or runoff volumes. Nichols et al., (1994) used a distributed, continuous simulation model (SWRRB, Arnold et al., 1990) to simulate runoff from the same Walnut Gulch Experimental Watershed. When calibrated, the model accurately simulated average annual runoff volumes, but not maximum peak flows.
For the decisionmaker, implementing simulation models and interpreting their output is complicated by the complexity of the models and by the nature of natural resource decisions that often involve conflicting objectives. Although complex simulation models aid the decisionmaker by predicting the outcome of a particular management practice or system of practices, the abundance of information provided complicates the ability of the decisionmaker to analyze the information and come to a decision that satisfies more than one objective. A framework is needed that facilitates the efficient transfer of technology to user groups and gives the decisionmaker the ability to apply the technology easily and in a repeatable and scientifically defensible manner. Improved simulation models may be easier to use and more complete by taking advantage of newly developed geographic information systems. Effective simulation models must use GIS as a major platform not only for merely displaying data, but also for analysis. Research programs and the computerized models they use must be able to incorporate data with locational identifiers that are drawn from a geographically variable environment. Scientific research focused on incorporating these improvements in simulation models can only be effective if it is undertaken in concert with the managers who will ultimately use the models. Cooperation between researchers and users is paramount to a successful next generation of simulation models, and such cooperation requires innovative research funding arrangements.
Conclusion
To improve implementation of watershed management, efforts must be made to better connect science to decisionmaking. One of the primary goals of watershed science should be to increase our understanding of watersheds and how they function and present that information in ways that are useful to managers in practical settings. Risk assessment is one method for improving the usefulness of science because it provides improved understanding of the degree and types of uncertainty in management applications; the issue of uncertainty is of special importance to watershed managers because they must often work with incomplete information and because watershed processes inevitably exhibit some random behavior. One area of special promise is simulation modeling, because these can give decisionmakers interactive tools for both understanding the physical system and judging how management actions might affect that system.
Despite this wealth of data and a substantial scientific understanding of watershed components and their processes, our models and available methods for explaining the interaction of many components, predicting their future behavior, and especially for integrating ecologic, social, and economic approaches are inadequate and outdated. Decisionmakers have access to no truly integrated contemporary watershed models that satisfy minimum criteria for effectiveness, usefulness, and ease of application. Despite rapid advances in geographic information systems technology, in many cases users employ these powerful software
packages only to create attractive maps, without extending their efforts to analysis and linkages with models. The nation needs from its scientific and engineering establishment new models that 1) link directly to geographic information systems and decision support systems, 2) incorporate social and economic science as integral parts rather than as afterthoughts, and 3) span a variety of scales for application. To serve public users, such models should be in the form of computer programs that are as easy to use as a typical word processor or spreadsheet so that they serve not only those who create them, but also those who truly need them: the managers and decisionmakers.
References
Arnold, J. G., J. R. Williams, A. D. Nicks, & N. B. Sammons. 1990. SWRRB: A Basin Scale Simulation Model for Soil and Water Resources Management. College Station, Texas: Texas A&M Press.
Arnold, J. G., J. R. Williams, R. Srinivasan, K. W. King, and R. H. Griggs. 1994. Soil and Water Assessment Tool, USDA-ARS, Grassland, Soil and Water Research Laboratory, Temple, TX.
Beasley, D. B., and L. F. Huggings. 1981. ANSWERS Users Manual, EPA 905/982-001, U.S. Environmental Protection Agency, Chicago, Ill.
Bicknell, B. R. 1992. Hydrologic Simulation Program - Fortran: User's Manual for Release 10. Environmental Research Laboratory, EPA, Athens, Ga.
Collins, B. D., and G. R. Pess. 1997a. Evaluation of forest practices prescriptions from Washington State's watershed analysis program. Water Resources Bulletin 33(5):969-996.
Collins, B. D., and G. R. Pess. 1997b. Washington State's watershed analysis program compared to five management paradigms. Water Resources Bulletin 33(5):967-1010.
Donigian, A. S., Jr., J. C. Imhoff, B. R. Bicknell, and J. L. Kittle, Jr. 1984. Application Grade for the Hydrological Simulation Program—FORTRAN EPA 600/3-84-066, Environmental Research Laboratory, U.S. EPA, Athens, Ga.
Goodrich, D. C., and D. A. Woolhiser. 1991. Catchment hydrology. Rev. of Geophysics, Supplement, AGU, pp. 202-209.
Halbert, C. L., and K. N. Lee. 1990. The Timber, Fish and Wildlife Agreement: Implementing alternative dispute resolution in Washington State. Northwest Environmental Journal 6:139-175.
Huber, W. C., and R. E Dickinson. 1988. Storm Water Management Model, Version 4: User's Manual. Environmental Research Laboratory, EPA, Athens, Ga.
Hydrologic Engineering Center. 1991. Using HEC-1 on Personal Computer, User's Manual and Training Document No. 32, U.S. Army Corps of Engineers, Davis, Calif.
Lahlou, M., L. Shoemaker, M. Paquette, J. Bo, R. Choudhury, R. Elmer, and F. Xia. 1996 Better Assessment Science Integrating Point and Nonpoint Sources (BASINS), Version 1.0, User's Manual, U.S. Environmental Protection Agency, Washington, D.C. 20460.
Leavesley, G. H., R. W. Lichty, B. M. Troutman, and L. G. Saindon. 1983. Precipitation—Runoff Modeling System—User's Manual, Water Resources Investigation, Report 83-4238, Washington, D.C.: U.S. Geological Survey, 207 pp.
Maidment, D. R. Ed. 1993. Handbook of Hydrology. New York: McGraw-Hill.
Mays, L. W. Ed. 1996. Water Resources Handbook. New York: McGraw-Hill.
Michaud, J., and S. Sorooshian. 1994. Comparison of simple versus complex distributed runoff models on a midsized semiarid watershed . Water Res. Res. 30(3):593-605.
Montgomery, D. R., G. E. Grant, and K. Sullivan. 1995. Watershed analysis as a framework for implementing ecosystem management. Water Resources Bulletin 31:369-386.
National Research Council (NRC). 1992. Restoration of aquatic ecosystems. Washington, D.C.: National Academy Press.
National Research Council (NRC). 1993. A Paradigm for Ecological Risk Assessment. In Issues in risk assessment. Washington, D.C.: National Academy Press.
National Research Council (NRC). 1996. Upstream: salmon and society in the Pacific Northwest. Washington, D.C.: National Academy Press.
National Research Council (NRC). 1994. Rangeland Health: New Methods to Classify, Inventory, and Monitor Rangelands. Washington, D.C.: National Academy Press.
Nichols, M. H., L. J. Lane, H. M. Arias, and C. Watts. 1994. Comparative modeling of large watershed responses between Walnut Gulch, Arizona, USA, and Matape, Sonora, Mexico. In. Variability is Stream Erosion and Sediment Transport (Proc. of the Canberra Symposium, Dec. 1994, Ed. by L. J. Olive, R. J. Loughran, and J. A. Kesby). IAHS Pub. No. 224, pp. 351-358.
Organization for Economic Cooperation and Development (OECD). 1997. Environmental Indicators for Agriculture. Paris: OECD Publications Services.
Soil Conservation Service (SCS). 1964. Hydrology. In SCS National Engineering Handbook, U.S. Department of Agriculture, Washington, D.C.
Suter, G. W., II. 1993. Ecological Risk Assessment. Boca Raton, Fla. Lewis Publishers.
U.S. Army Corps of Engineers. 1995a. HEC-RAS River Analysis Systems—User's Manual, Version 1.0. Davis, Calif.: Hydrologic Engineering Center.
U.S. Army Corps of Engineers. 1995b. HEC-RAS River Analysis System—Hydraulic Reference Manual, Version 1.0. Davis, Calif.: Hydrologic Engineering Center.
U.S. Environmental Protection Agency. 1992. Framework for ecological risk assessment. EPA/625/3-91/022. Washington, D.C.: Risk Assessment Forum, U.S. Environmental Protection Agency.
U.S. Environmental Protection Agency. 1996. Proposed Guidelines for Ecological Risk Assessment; Notice. 61 CFR 175 47552-47631. Washington, D.C.: U.S. Environmental Protection Agency.
Wang, H. and R. Srinivasan. 1997. WWW Publication of HUMUS — ''HUMUS on Line", Annual Conference and Exposition Proceedings of the ACSM/ASPRS, Vol. 4, pp. 578-588.
Washington Forest Practices Board. 1995. Standard methodology for conducting watershed analysis under Chapter 222-22 WAC, Version 3.0. Olympia, Washington: Washington Department of Natural Resources.
Wight, J. R., and J. W. Skiles (eds.). 1987. SPUR—Simulation of Production and Utilization of Rangelands: Documentation and user guide.
Woolhiser, D. A., R. E. Smith, and D. C. Goodrich. 1990. KINEROS, A Kinematic Runoff and Erosion Model: Documentation and User Manual. U.S. Department of Agriculture, Agricultural Research Service, ARS-77, 130 pp.
Wurbs, R. A. 1994. Computer Models for Water Resources Planning and Management. Institute for Water Resources Report IWR 94-NDS-7. Fort Belvoir, Va.: U.S. Army Corps of Engineers.
Young, R. A., C. A. Onstad, D. D. Bosch, and W. P. Anderson. 1989. AGNPS: A nonpoint source pollution model for evaluating watersheds. J. Soil and Water Cons. 44:168-172.


