
3
REVIEW OF DETAILS OF NORTHEAST GROUNDFISH STOCK ASSESSMENTS
Nature puts no question and answers none which we mortals ask. She has long ago taken her resolution.
Henry David Thoreau
This chapter contains detailed technical comments about the stock assessment process. Although incorporating the suggestions contained in this chapter would improve assessments, the committee believes that the current assessments are still valid for making management decisions.
DATA
As mentioned in Chapter 2, the National Marine Fisheries Service (NMFS) has documented the data and an array of information collected over a long period of time that are used in assessments. One notable feature of the Stock Assessment Review Committee (SARC) process is that the evaluation of data sources is explicit and leads to research recommendations for improvements in data collection and documentation (see Appendix D). Some of the recommendations that the committee feels are especially critical are repeated in this report, as well as additional recommendations regarding data collection and treatment.
Dealer and Vessel Data
Problems related to collecting catch and landings information are detailed in the SARC report (NEFSC, 1997a). The new system put into place in 1994 contains a major structural flaw: dealer reports and vessel trip reports cannot be uniquely linked. The system requires a thorough audit and overhaul to fix this and other problems. There needs to be further efforts to verify reported landings. There are several ways to attempt to do this, for example, sociological studies of fishermen's behavior, experimental fishing using gear that the harvesters are using in the area they are fishing, and statistical analyses (Myers et al., 1997).
Misreporting of landings is usually a significant issue only when fisheries are managed by setting a total allowable catch. In the U.S. fishery, there is no total allowable catch set. Most Canadian fisheries have a total allowable catch specified, but their enforcement system may adequately deal with misreporting.
Observer Program
Apparently, information obtained by independent observers aboard fishing vessels is minimal at best; few trips have been observed in recent years. In 1994, 1995, and 1996, a total of 22, 16, and 18 trips, respectively, were observed in the entire otter trawl fleet (DeLong et al., 1997). If fishery regulations continue to restrict harvesters from catching the number of fish they are accustomed to catching, then logbooks may not contain accurate information on levels of catch, location, discards, and so on. Often, the only solution is to station observers on fishing vessels to collect accurate information. Evaluation of the need for a strengthened observer program should be a part of the stock assessment process.
Disaggregated Catch Per Unit Effort
Catch per unit effort (CPUE) has not been used in assessments of the New England groundfish stocks since 1994. With the current quality of logbook data and the various restrictions that recently have been imposed on fisheries, the skepticism about the usefulness of current aggregated catch-and-effort data in constructing CPUE series as expressed by NMFS and the SARC is appropriate. However, harvesters have a greater trust in the data that they themselves provide, and therefore an effort should be made to validate and use CPUE data.
With disaggregated catch-and-effort data, the CPUE series might, however, provide valuable information about the spatial distribution of effort and abundance. Such series might be of value in the regular assessments of stocks and for monitoring purposes. Their value as instruments for monitoring stocks and fisheries depends on data quality, and on the time lag between the collection of new data and the revision of the CPUE index. With an appropriate system for gathering and analyzing catch-and-effort data, this time lag could be shortened, thus helping to improve fisheries monitoring.
To obtain valid CPUE series, changes in fishing technology, fishing competence, and restrictions on effort must be accounted for in the analysis. One approach is to disaggregate the data not only by vessel, but also by skipper and management events. The idea is to focus on periods with constant technology (e.g., same gear, same engine), constant fishing competence (e.g., same skipper and key crew), and same external conditions (e.g., management regime with respect to closed areas and periods, days at sea limitation, rules for discards and bycatch). The catch series will be highly variable within each such period, but by analyzing all spells together, in a generalized linear model, a CPUE series related to relative abundance might be recovered (Hilborn and Walters, 1992).
To obtain data of sufficient quality for disaggregated CPUE analysis, a subset of fishing vessels could be delegated to provide more detailed logbook data than are recorded in the mandatory logbooks. With reliable and detailed catch by time and area, such disaggregated fishery-based data might also be of value for types of analysis other than CPUE series.
Handling Zeros When Estimating Door Conversion Factors and Other Data
To weight data from surveys with different trawl doors (BMV and Polyvalent) equally, a conversion factor has to be estimated. Because zero catch occurs with substantial frequency during the surveys, an ad hoc approach was taken in the NMFS analysis. In experimental data, pairs of hauls with trawls using the two types of doors, and pairs with zero catch for either of the two trawls were excluded.
The handling of zeros is also a problem in other analyses. Using a root normal rather than a lognormal distribution might be a simple fix, because the square root transformation works with zero values. In addition, these data could be treated in a statistical model along the lines of Coe and Stern (1982).
Survey Coverage
A major factor in deciding the accuracy of stock assessments is the variability in survey indices. When considering total abundance, the survey variability is directly related to the number of stations considered. The present surveys are somewhat lacking in coverage (Azarovitz, 1981), and considerable benefits potentially could be obtained by increasing survey coverage. For example, in the 1996 spring survey there was a single tow with dramatically higher catches of haddock (Figure 3.1). Increasing the number of stations in the surveys is of major importance. Reallocating stations will not achieve the same effect. Increasing the total number of stations sampled, in conjunction with improved reallocation of the number of samples in each stratum, will increase the precision of the mean and decrease the standard error (Gunderson, 1993). In particular, a portion of the new stations should be allocated to the closed areas, where higher fish densities should be expected if the closed areas are effective. The current number and spatial allocation of fishing sets in the closed areas will not allow an assessment of the effects of closed areas with any confidence. This lack of assessment becomes quite critical when the utility of closed areas in reducing fishing mortality is to be evaluated.
Even though reallocation of stations may not lead to improvements, reevaluation of the survey design could lead to improvement. The use of adaptive sampling (Thompson and Seber, 1996) could lead to a significant improvement in survey design efficiency. Therefore it would be fortuitous for NMFS to examine alternative survey designs which may improve the precision of its surveys.
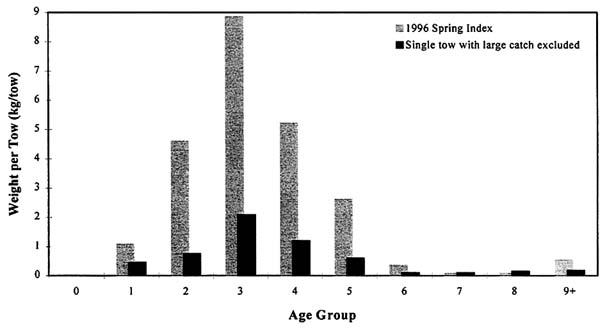
FIGURE 3.1 Mean number of haddock per tow at age captured in the Georges Bank strata sets (offshore strata 01130-1250, 01290-01300) during spring 1996 research vessel survey conducted by the Northeast Fishery Science Center. SOURCE: Adapted from NEFSC, 1997a.
Age Sampling
Age readings are commonly a source of serious problems in stock assessments. The samples taken for age reading fall into two categories: age samples from the commercial fishery and age samples from the surveys. Typically, catches in numbers at age form an important basis for stock assessments, and it is important that the age samples provide accurate information on the age composition in the catches.
Because age samples are commonly taken as a fixed proportion of the tons landed, it is clear that when catches are low, it will be very difficult to keep track of the relative size of year classes if the sample sizes are allowed to become very small as they were for some groundfish species (Table 3.1; NEFSC, 1997a; Brown, 1997; Cadrin et al., 1997; Mayo, 1997; O'Brien, 1997; Overholtz et al., 1997).
For example, a sample size of only 200 fish for a species with two important age groups will result in fairly inaccurate estimates of the proportion in each one. An optimistic estimate of the standard deviation in an important age group could be obtained using the binomial distribution, whereas more appropriate simulation procedures can also be used. To keep track of the age composition, follow year classes, and avoid outliers in fishing mortalities based on virtual population analysis (VPA), it may be necessary to increase sample sizes considerably. A part of future stock assessments should be an evaluation of sample size requirements for ageing to meet specified precision and accuracy goals in stock assessment outputs such as biomass and fishing mortality estimates.
Recreational Sampling
The primary source of marine recreational data for the New England region and the nation is the Marine Recreational Fisheries Statistics Survey (MRFSS) conducted by NMFS with the cooperation of the coastal states. MRFSS is a design-based survey that produces estimates of total effort and catch in directed recreational fisheries over broad coastal areas. It has two components, one to obtain effort data and the other to obtain catch rates. Effort data are obtained from interviewing anglers in households that have been contacted by telephone through random-digit dialing of coastal county phone prefixes. Random-digit dialing is an inexpensive, though inefficient, method to obtain data and results in estimates that can be precise because of the large sample size. Because bias is incurred when anglers self-report their catch rates, these data are combined with data obtained from on-site interviews where the survey clerk sees and measures the catch. Although data quality from on-site surveys is high, they require trained clerks, involve transportation, and result in fewer interviews. Thus, on-site interviews are more costly to obtain, fewer interviews occur, and catch rates are estimated with less precision.
TABLE 3.1 Number of Age Samples Collected for Five Groundfish Stocks 1993-1996
Recreational catch is difficult to measure precisely without incurring considerable cost. In MRFSS, catch is calculated by multiplying catch rates from the on-site surveys and effort obtained through telephone interviews. Catch rates are highly variable because the skill levels of anglers and motivations for catching fish differ greatly. Most anglers catch few fish in a given trip, whereas a few anglers catch many. Thus, when the catch rate per trip is plotted, its distribution is highly skewed. Although an increase in interviews results in better precision, skewness in the confidence intervals is slow to disappear. Skewness is undesirable and difficult to eliminate but does tend to result in conservative management decisions.
Stock assessments are most reliable when catch data are precise. The difficulty in integrating recreational catch data into stock assessment rests largely in the uncertainty of the catch estimates. When recreational catch is a minor part of total catch, this imprecision adds little to the overall uncertainty. When recreational catch is a major or dominant proportion of total catch, uncertainty in the stock assessment predictions is driven by the imprecision of the recreational catch. In the few instances when this occurs, the expense of increasing the number of on-site interviews or developing a specifically targeted survey may be justified.
Only two of the New England groundfish stocks have appreciable recreational catches: Gulf of Maine Georges Bank cod. Recreational catches are incorporated into these assessments but are sufficiently precise to be useful. As the stocks rebuild, the commercial catch will increase with a concomitantly diminished contribution from the recreational catch. Because of changes in the demography of coastal populations, a significant increase in marine angling is not anticipated. Hence, the catch from commercial fishing should increase more than that from angling. Although it is unlikely, if the recreational catch were to increase in these fisheries, the committee would recommend an increase in the number of on-site interviews through increased participation of the New England coastal states.
Recreational fisheries are sampled for biological characteristics of the catch such as species composition, length, and age. Length can be converted to age by using age-length key tables generated by compiling samples of fish lengths and ages. Fish can also be aged by collecting hard parts such as otoliths and scales. This procedure is problematic because it is time-consuming and disfigures the fish in a manner that many anglers find unacceptable. Time is often better spent obtaining another interview than obtaining hard parts. As long as sufficient length samples are taken and the appropriate methodology is used, estimated catch at age will be precise enough to use in stock assessments.
Environmental/Ecosystem Data
Stock assessments would be much improved by the addition of a section related to environmental and ecosystem considerations. This section would describe data series and information related to oceanography and environmental conditions, and perhaps the extent to which these variables explain changes in recruitment of fish populations. For example, in the assessment of Georges Bank haddock, environmental changes or stock depensation (or both) could explain the reductions in recruitment in recent years. The current assessment does not describe these two possibilities.
In addition, information on stomach contents could be included as a means of examining species interactions. Information about the man-induced impacts (e.g., pollution, drilling, and fishing gear) on habitat and environment could be described. Finally, complex interactions among the fish populations, the environment, and fishery management could be explored. The exploration of these interactions is especially valuable because harvesters who spend time on the water believe that these factors are important.
ASSESSMENT MODELS
The following material describes current and alternative approaches to fish stock assessment models. General principles are given first, followed by an outline of the approaches used in current Northeast groundfish assessments and alternative approaches that should be considered. Several of these concerns have been addressed in documents provided to the committee, but others have not. As with other sections of this report, many of the concerns raised here may not change the overall picture of stock status obtained from assessments. They are suggestions to be considered in the future. Some of these suggestions will lead to somewhat different projections and possibly to higher estimates of variance. The use of alternative methods and data sources will strengthen the advice based on these assessments. More elaborate consideration of stock assessment models and their role in fishery management is contained in the National Research Council report Improving Fish Stock Assessments (NRC, 1998).
Initial Evaluation of Input Data
Before a formal stock assessment is undertaken, the available data must be studied closely to determine if they are likely to satisfy the general requirements for such data sets. In particular, some estimates of the relative variability and internal consistency of different data sets are necessary to verify the likely accuracy of final population estimates and the relative weight to be given to different data sources.
Simple models, or smoothers, can be used for this purpose. For example, such methods will yield the inherent variability in survey indices at age before any stock assessment is undertaken. This information is important, if only to show which age groups are unreliable and which sets of indices may not be adequate as parts of the assessment. Such an analysis will provide some information on appropriate weighting to be used in any assessments.
Approaches to Assessment Modeling
As with all biological models, several approaches can be taken to fish stock assessment modeling. Most of the models in use around the world are based on the same foundation, but some aspects of implementation vary considerably. In particular, some models are based on the assumption that catches are measured without error and that the age disaggregation of these catches is also without error.
To ensure that the advice based on these assessments is as good as possible, several different models should be used during the assessment process. At the beginning, when an overall picture is being formed, creativity in modeling and flexibility in analysis are of overriding importance. Particularly useful are parallel assessments conducted by different individuals, possibly at different institutions, in order to ensure that the widest possible range of alternatives is considered. Alternative assessments are already considered to some extent, as described below, but further investigations should be encouraged.
Current Model Assumptions
The primary assessment models chosen for the five stocks under consideration are all based on the assumption that catch-at-age data are without error and that survey indices follow a lognormal distribution. It is further assumed that the survey data have the same variance at age on a logarithmic scale for all age groups. Even within the assessment procedure used, it is possible to evaluate the adequacy of most of these assumptions and the effect of changing them.
Alternative Model Assumptions
The present ADAPT models have been tested extensively against other models used around the North Atlantic region and found to perform similarly (NRC, 1998). In other areas, completely different classes of models have been developed with different emphases. These models should be tested to verify the importance of different assumptions. The verification of model assumptions will become particularly important in future years if the current low fishing mortalities continue to prevail.
Alternative assessment methods should be used to consider the effects of including variability of catch data (through a formal statistical model), other sources of stochasticity or uncertainty in the system, and internal estimation of parameters of stock and recruitment models.
Formal statistical models (ADAPT or other) allow statistical evaluation of various concerns. For example, formal statistical tests can be used to evaluate the effects of outliers or even to determine how much they have to be downweighted. Although all formal statistical tests have to be viewed with some caution in these highly nonlinear systems based on data with unknown statistical properties, formal measures are useful when evaluating such effects as outliers.
Similarly, different weightings and transformations should be compared, in order to understand which components of the objective function dominate the estimate of fishing mortality. This should be done by investigating different weighting of the various fleets in each assessment. It is important to know which indices are driving the assessments. The fact that they are now given equal weight does not mean that each has the same influence on the results. If estimates of the variances in each age group are available, these should be used to give initial weights related to the inverse of the variance.
Correlations between age-disaggregated indices of abundance within each year may be a source of concern when estimating stock sizes. The importance of this effect has to be investigated on a case-by-case basis using methods that incorporate the covariance between age group indices from surveys. These correlations can be important in some cases, even yielding much lower estimates of stock size than previously obtained (Myers and Cadigan, 1995). Some Canadian assessments take these correlations into account.
Further Extensions in Time
Several of the assessments use rather short time series. Although this may be adequate for estimating the current stock size, a much longer view of stock sizes through increased use of historical data is needed. For Georges Bank haddock, a VPA back to 1931 provides this perspective (NEFSC, 1997a). Such a historical perspective is particularly needed for Gulf of Maine cod. All of the stock estimates can be extended backward in time through the use of the survey time series. A simple method is to assume the same catchabilities at age for the surveys over time and then to use simple scaling, as shown in Appendix F. However, this method results in much more variable estimates than ADAPT, although it does show a tendency toward higher abundances in the past. A more advanced approach would involve an age-structured assessment method such as Stock Synthesis or Automatic Differentiation Model Builder, which can use total catch and age-specific survey indices for the entire period, and incorporate catch-at-age information for the time period for which it is available. Alternatively, it may be possible to extend the catch-at-age data back in time and continue to use ADAPT.
Natural Mortality
Only a few assessment models allow for the estimation of natural mortality (M) internally. Usually M is assumed to be known from other sources. In recent years, increased emphasis has been placed on models that explicitly incorporate the estimation of natural mortality (e.g., McAllister and
Ianelli, 1997). As a rule, these models are Bayesian, incorporating a prior distribution on many parameters, including the posterior distribution of natural mortality in the output. Taking into account the uncertainty in natural mortality is particularly important with regard to estimations of uncertainty and predictions of stock size.
Model Verification
Having obtained a stock assessment, available procedures should be used to compare the assessment to all possible data sources, in particular, any data sources not used in the assessment. Specifically, because no effort data after 1994 are used in present assessments, to compare the actual number of days at sea or other effort restrictions on the fishing mortality being inflicted on various stocks would be useful.
At the same time, the results of the stock assessment should be compared with qualitative information available from the fleets. Thus, evidence of a sharp reduction in fishing mortality should be considered in conjunction with corroborative evidence from harvesters about whether they really notice the effect of effort limitations. This evidence is needed to prevent cases in which effort limitations have no effect due to either miscalculation of historical effort or evasions of the system.
As discussed in Chapter 2, available indications are that the present management system has indeed reduced fishing mortality for four out of the five stocks as observed in the present assessments. However, alternative analyses are needed to validate the estimates of fishing effort as a routine part of the assessments.


