
2
Body Composition
At the present time, all active-duty military personnel must be weighted and assessed for physical fitness annually or semiannually. If their weight exceeds the maximum for their height according to the screening tables of their service, they are referred for a second tier of assessment, determination of percent body fat, to ascertain that the increased weight is due to fat rather than lean tissue. Personnel whose body fat is found to exceed the limit for their service are referred to a military weight control program, which carries professional consequences. In addition to regular mandatory weighing, a commander may require an individual in his or her command to be weighted at any time if the commander believes that the individual presents an overweight appearance in uniform. Similar attention is not devoted to personnel who are underweight; however, this was not always the case.
Historical Background
Beginning during World War II, the body composition of prospective soldiers was assessed to ensure that they possessed a minimum weight for their height and an appearance that was believed to be commensurate with fitness and health, in the judgment of a physician. However, in response to a growing impression throughout the late 1970s that the average service-member appeared to be overweight and unfit, President Jimmy Carter commissioned a study in
1981 of the physical fitness of the military services (Study of the Military Services Physical Fitness, DoD, 1981). As a result of this study, the Department of Defense (DoD) issued Directive 1308.1 (1981) mandating that all services establish a system of body fat assessment to evaluate overweight. Weight-for-height tables such as the actuarial tables published by the Metropolitan Life Insurance Company, which established upper limits of weight for height that minimized risk of morbidity and mortality, were to be used as the initial screen. Assessment of body fat was to be performed on those who exceeded the maximum weight for their height. Fitness assessments were to be performed on all soldiers as well (see Chapter 3). Each service was given responsibility for establishing its own method of body fat assessment. The method generally chosen was that of skinfold thickness measurement and use of the Durnin-Womersley equation (1974) to predict percent body fat. The Marine Corps was the first service to validate and employ equations based on circumferential measurements for body fat assessment (Wright et al., 1980). In 1987, an amendment to the DoD Directive specified that a circumference-based body fat estimation procedure was to be used, standardized against the criterion method of hydrostatic (underwater) weighing. Subsequently, each of the other services derived its own gender-specific equations (Table 2-1), selecting by factor analysis the circumferential measurements and other factors that best predicted body fat as determined by underwater weighing of its own subject population (Hodgdon, 1992). Unlike those of the Army, Navy, and Marine Corps, the initial Air Force equation included an estimate of fat-free mass (FFM); however, this method was subsequently abandoned, and slight modifications of the Navy equations are now in use by the Air Force. The current standards are described in Table 2-2 and will be discussed in greater detail later.
According to DoD Directive 1308.1 (1981), which mandated body fat assessment, the maintenance of a desirable body composition was "an integral part of physical fitness, general health, and military appearance" (p. 1). The study panel that was given responsibility to set upper body fat limits for the DoD recommended upper limits of 20 percent body fat for men and 29 to 30 percent for women, based on information in the textbook of McArdle et al. (1981) showing that the average body fat of physically fit young men was 20 percent and that of fit young women was approximately 30 percent, corresponding to an average maximal aerobic capacity of 50 and 39 ml/kg/min for men and women, respectively (these body fat figures contained a margin of 5% to allow for deviation from the mean and measurement error). However, the DoD decreased the maximum allowable body fat for women from the recommended 29 to 30 percent to a figure of 26 percent, in the belief that it was desirable to recruit women whose body fat was closer to that of the average man, as such women, possessing a higher than average proportion of FFM, might also be more similar to men in strength and endurance. There has been considerable discussion regarding whether these original standards were based more on considerations or beliefs about fitness, health, or possibly appearance. According to Friedl (1997), the standards were intended to enhance readiness. However, except for the exclusion of extremely obese individuals, the standards could not select for fitness or performance capability; they were intended to promote fitness and prevent obesity.
A 1995 update to DoD Directive 1308.1 established new upper limits for body fat of 26 percent for men and 36 percent for women, however each service was permitted to set upper limits of less than 26 and 36 percent. Thus, for example, the Army maintains progressively increasing upper limits of body fat for increasing age (the upper body fat limit for women ranges
TABLE 2-1 U.S. Military Body Composition Equations
|
Army (Vogel et al., 1988) |
|
Men |
|
Percent fat = 76.5 × Log10(abdomen II* - neck) - 68.7 × Log10(height) + 46.9 R = 0.82, SEE = 4.02 |
|
Women |
|
Percent fat = 105.3 × Log10(weight) - 0.200 × wrist - 0.533 × neck - 1.574 × forearm + 0.173 × hip - 0.515 × height - 35.6 R = 0.82, See = 3.60 |
|
Navy (Hodgdon and Beckett, 1984a, b) and Air Force |
|
Men |
|
Density = -0.191 × Log10(abdomen II - neck) + 0.155 × Log10(height) + 1.032 Percent fat = 100 × [(4.95/density) - 4.5] R = 0.90, SEE = 3.52 |
|
Women |
|
Density = -0.350 × Log10(abdomen I† + hip + neck) + 0.221 × Log10 (height) + 1.296 Percent fat = 100 × [(4.95/density) - 4.5] R = 0.85, SEE = 3.72 |
|
Marine Corps (Wright et al., 1980, 1981) |
|
Men |
|
Percent fat = 0.740 × abdomen II - 1.249 × neck + 40.985 R = 0.81, SEE = 3.67 |
|
Women |
|
Percent fat = 1.051 × biceps - 1.522 × forearm - 0.879 × neck + 0.326 × abdomen II + 0.597 × thigh + 0.707 R = 0.73, SEE = 4.11 |
|
NOTE: Circumference measurements and height are in centimeters. SEE, standard error of the estimate. * Abdomen II is the circumference, measured in transverse plane, at the level of the umbilicus. † Abdomen I is the ''natural waist" and is defined as the smallest circumference, measured in the transverse plane, obtained between the lower margin of the xiphoid process and the umbilicus. SOURCE: Adapted from Hodgdon (1992). |
TABLE 2-2 Variables or Standards Used by the U.S. Military Services for Assessing Body Composition of Personnel
|
Variables or Standards |
DoD Directive/Instruction |
Army |
Navy |
Air Force |
Marine Corps |
Coast Guard |
|||
|
Frequency of Weight/Height, BF, and Fitness Assessment |
Formally evaluated and tested at least annually |
Semiannual |
Semiannual PRT optional for members > 50 years (NAVOP 064/90, 1990) |
Annual |
Semiannual |
At least annual and upon random urinalysis testing |
|||
|
Assessment Procedures* |
Circumference measure technique |
Circumference measure if maximum allowable weight for height exceeded |
Circumference measure if maximum allowable weight for height exceeded |
Circumference measure if maximum allowable weight for height exceeded |
Circumference measure if maximum allowable weight for height exceeded |
Frame size determined by wrist measure (see COMDTINST M1020.8C, 1994) |
|||
|
|
|
|
|
|
|
|
|
Circumference measure if maximum allowable weight for height exceeded |
|
|
Men's BF Standard |
Range: 18–26% |
Age |
Max %BF |
22% |
Age |
%BF |
18% |
Maximum allowable weight by frame size or if exceeded |
|
|
|
|
17–20 |
20 |
|
> 29 |
20 |
|
Age |
%BF |
|
|
|
21–27 |
22 |
|
30+ |
24 |
|
< 30 |
23 |
|
|
|
28–39 |
24 |
|
|
|
|
31–39 |
25 |
|
|
|
40+ |
26 |
|
|
|
|
40+ |
27 |
|
|
|
(AR 600-9, 1986) |
|
|
|
|
|
|
|
|
Women's BF Standard |
Range: 26–36% |
Age |
Max %BF |
30% (NAVADMIN 071/93, 1993) |
Age |
%BF |
26% |
Maximum allowable weight by frame size or if exceeded |
|
|
|
|
17–20 |
30 |
|
> 29 |
28 |
|
Age |
%BF |
|
|
|
21–27 |
32 |
|
30+ |
32 |
|
< 30 |
33 |
|
|
|
28–39 |
34 |
|
|
|
|
31–39 |
35 |
|
|
|
40+: |
36 |
|
|
|
|
40+ |
37 |
|
|
|
(AR 600-9, 1986) |
|
|
|
|
|
|
|
|
NOTE: DoD, Department of Defense; BF, body fat; PRT, physical readiness test; NAVOP, Naval Operational Message; COMDTINST, Commandant Instruction; AR, Army Regulation; NAVADMIN, Naval Administrative Message. A more detailed table appears in Appendix B. * See Table 2-1 for equations. |
|||||||||
from 30% for women 17–20 years of age to 36% for women 40 and older); the Navy maintains an upper body fat limit of 36 percent but requires women whose body fat exceeds 30 percent to enter a weight reduction program; and the Air Force maintains an upper body fat limit of 28 percent for women under 30 years and 32 percent for women 30 and over. The question of whether these body fat standards and the means used to assess them are truly related to health, fitness, or even appearance is still of prime significance, as is the question of whether one body fat standard and one method of assessment should be adopted by all services. These issues are particularly important for women in the military and have been the focus of at least one legal case (Adde, 1996).
Summary
Since 1981, the military has employed a two-tiered system of assessing body weight and fatness in its soldiers, as one means of ensuring readiness. All soldiers are weighed annually or semiannually; those whose weight exceeds the service-specific upper limit for their height must undergo circumferential body fat determination. Soldiers who exceed the body fat limits for their service and gender are referred to a military weight control program and suffer professional consequences. The methods by which body fat is assessed, the standards used, and the relationships among body fat, physical performance, health, and appearance of soldiers remain significant issues in the military today.
Overview Of Body Weight And Composition
Body weight, after adjusting for stature, is related to an individual's health, functionality, and appearance. This section examines general body composition concepts. Subsequent sections provide an overview of measurement methods, and explore various influencing factors of importance to the military. The final portion of the chapter provides an overview of associations among body weight and composition, and health, functional issues of military significance, and appearance. Body weight per se is the sum of individual body composition components or compartments, which are of greater physiological or pathological significance than composite body mass.
General Concepts
Body weight or mass represents the sum of over 35 body composition components (Wang et al., 1992). Interpretation of body weight in relation to health issues requires adjustment for stature. Both relative underweight and overweight are accompanied by impaired physical performance and increased risk of morbidity and mortality. Setting weight standards for optimum health and physical performance is a subject of great scientific and public health importance and a current active research area.
A growing literature supports the use of body mass index (BMI, formerly referred to as Quetelet's index, defined as weight in kilograms divided by the square of height in meters), as a predictor of morbidity and mortality risk (Seidell et al., 1996; Troiano et al., 1996). BMI varies
from a low of about 14 kg/m2 to over 100 kg/m2, with "health" considered by most federal agencies as between approximately 18 kg/m2 to 28 kg/m2. Studies on the predictive value of BMI have included both cross-sectional observations and longitudinal prospective studies. BMI tabulations now supplant earlier mortality tables based on body weight and height such as those published by the Metropolitan Life Insurance Company (1983) for a first level of body fat assessment.
Body Mass Index
The association between morbidity/mortality and BMI varies among studies, but the consensus is that both low and high BMIs increase the risk of multiple degenerative conditions and diseases (Seidell et al., 1996; Troiano et al., 1996). The increased health risk of low BMI persists even after controlling for conditions associated with low relative weight such as malignancies and personal habits such as smoking. The 1995 Nutrition and Your Health: Dietary Guidelines for Americans suggested a range of BMI of 19 kg/m2 to 25 kg/m2 for healthy Americans (USDA/DHHS, 1995) with no age adjustment for this BMI range. The Dietary Guidelines now supplant the earlier National Research Council Recommended Healthy Weight Guideline (1989). The 1989 National Research Council Guideline was based on body weight and height with an adjustment of the healthy weight range for age. The lower weights more often applied to women, who tend to have less muscle and bone. The Dietary Guidelines' BMI range for health also suggests that higher weights may apply to people with more muscle and bone, such as many men.
The BMI range of 19 to 25, recommended by the Dietary Guidelines as being consistent with minimal risk, is supported by several recent studies. A longitudinal study of nurses (Manson et al., 1995) found a significant trend in the relationship between risk of death from all causes and increasing BMI relative to those with BMI less than 19 among women who had never smoked and whose weight had remained stable over the previous 4-y period; women in the BMI range of 19.0 to 26.9 were found to have similar risk (1.2–1.3) relative to women with BMI less than 19. Risk did not increase significantly until BMI reached 27. Kannel and coworkers (1996) reported that the BMI associated with lowest risk of cardiovascular disease for women is 21.1. Findings similar to those of Manson and coworkers (1995) were obtained in a more recent 12-y study of women who had never smoked (Stevens et al., 1998). While a BMI of 17 to 18.4 has been associated with chronic energy deficiency (James et al., 1988), data presented later in this chapter show that women with low BMI can be extremely physically fit.
The Dietary Guidelines' BMI range of 19 to 25 kg/m2 is not supported by all investigators, however. In a recent meta-analysis, Troiano and colleagues (1996) demonstrated using available literature that weight levels now considered moderately overweight are not associated with significantly increased all-cause mortality. Moreover, body weight at or just below currently recommended limits was not associated with significantly increased mortality. Troiano and colleagues suggested that weight loss to increase longevity may be inappropriate for persons with BMIs in the range of 26 to 27 kg/m2. (Discussions of health risks associated with dieting appear in later chapters.) In a 12-y longitudinal study, Seidell et al. (1996) also could not confirm a higher mortality risk in obese Dutch women compared to their lean counterparts. Van Itallie (1985) in a review recently cited by Rosenbaum and coworkers (1997) found that risk of noninsulin
dependent diabetes mellitus (NIDDM) and cardiovascular disease was increased three- to fourfold at a BMI greater than 28.
As an example of how current military weight-for-height table values correspond to BMI, the maximum allowable Army weights-for-height for women age 17 to 20 years correspond to a mean (± SEM) BMI of 22.8 ± 0.1; for women age 21 to 27 years, mean BMI is 23.4 ± 0.1; for women ages 28 to 39 years, mean BMI is 24.1 ± 0.1 and for women age 40 years and over, mean BMI is 24.9 ± 0.1.
However, as shown by Behnke and colleagues in the 1940s in a population of athletes and Navy personnel, increased weight for height may signify greater than average muscle mass rather than excess body fat in the individual (Welham and Behnke, 1942). Thus, a second level of body composition assessment must be applied to distinguish accurately between those who are overfat and those with greater than average muscle mass among those individuals whose BMI exceeds the designated maximum.
Components of Body Composition
The composition of the human body can be described on increasingly complex levels: atomic, molecular, cellular, anatomical, and whole body (see Figure 2-1) (Baumgartner et al., 1995; Wang et al., 1992). Readiness, fitness, and health in military women focus on two of these levels, molecular, and anatomical.
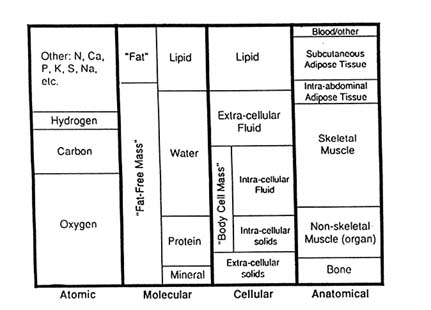
FIGURE 2-1 First four levels of body composition and their main components.
SOURCE: Baumgartner et al. (1995). Permission for use granted by Obesity Research.
On the molecular level the body can be divided into four main components: lipid, water, protein, and minerals (Wang et al., 1992). In addition to fat, the remaining molecular components of the body, namely, water, proteins, and minerals, are found in relatively stable proportions to one another and are grouped under FFM (Wang et al., 1992).
At the anatomical level, the body includes adipose tissue, skeletal muscle, bone, visceral organs, and other related components (Wang et al., 1992). Adiposity and fatness are closely related, and the two, for military purposes, can be considered equivalent components. An individual's fat mass is related to overall energy balance, health, fitness, and appearance. Increases in fat mass and percent body fat are associated with greater morbidity and mortality due to such factors as lipid-mediated cardiovascular risk (Seidell et al., 1987). Increased fatness is associated with a decrease in some aspects of fitness, as will be discussed briefly in this chapter and in greater detail in Chapter 3. Percent body fat and fat distribution also contribute to the subjective assessment of appearance.
The difference between body weight and fat mass is FFM, a component associated with both strength and endurance. Under usual circumstances, skeletal muscle constitutes about one half of FFM (Wang et al., 1996). Hence, FFM and closely related adipose tissue-free mass are usually considered surrogate measures of skeletal muscle mass. For example Hodgdon and colleagues (1990) observed a positive association among Navy women between FFM (but not fat mass) and maximal box lifting capacity and other strength measures. Gender differences in strength disappeared when adjusted for FFM, presumably reflecting greater skeletal muscle mass in men than in women (Conway et al., 1989).
Early studies of strength and endurance relied on FFM as a surrogate for skeletal muscle mass, but the recent introduction of whole-body multislice magnetic resonance imaging (Heymsfield et al., 1997) and dual-energy x-ray absorptiometry (DXA) provides two important opportunities: the possibility of expanding body composition-functional studies, and the potential of developing anthropometric skeletal muscle prediction models. As an example of skeletal muscle functional studies, Mello and colleagues (1995) evaluated appendicular skeletal muscle mass by DXA and manual material handling in males and females. They observed a significant correlation between muscle mass and lift/carry tasks. Development of anthropometric skeletal muscle mass prediction models has been proposed as a goal for future military research efforts (Friedl, 1997).
Skeletal muscles are all anchored to bones, and the skeleton is an integral component of the anatomical body composition level. The skeleton consists of structural proteins enmeshed in a calcium hydroxyapatite mineral matrix. At the molecular level bone mineral mass and density are evaluated for whole-body or regions using DXA methods. Imaging methods such as magnetic resonance imaging can quantify skeletal mass and dimensions or bone-related components at the anatomical level. The element calcium, found almost entirely in bone, was evaluated in classical skeletal studies using a method referred to as neutron activation analysis. Genetic, dietary, and exercise/training factors all influence the risk of skeletal injuries in the military.
An important body composition concept is that stable relationships exist between some components at the same or different levels. For example, a stable relationship exists in healthy adults between two components at the molecular level, total body water (TBW) and FFM. In populations, the ratio of TBW to FFM is approximately 0.73 (Wang et al., 1992). Stable body
composition associations such as FFM hydration allow development of body composition models. A classic example is that measured TBW can be used to estimate FFM (that is, FFM equals TBW/0.73) and fat (fat equals body weight-FFM). However, individual differences exist in these body composition relationships and some of the observed variation can be explained by age, gender, and ethnicity-related factors. Body composition methods account, to varying degrees, for these small but important between-individual differences and this topic is discussed in the methodology sections below.
Summary
Body weight in relation to stature has been associated with risk for a variety of health conditions as well as with performance ability. A growing consensus among health professionals and agencies that establish guidelines for health promotion and disease prevention supports the use of the BMI as a predictor of morbidity and mortality risk; although the exact range of values that corresponds to the lowest health risks remains the subject of considerable research, a range of 19 to 25 has been adopted by the 1995 Dietary Guidelines. Body composition can be described on atomic, molecular, cellular, anatomical, and whole body levels. On the molecular level, the body consists of fat, water, protein, and minerals. The water, protein, and mineral components exist in relatively stable proportions and constitute FFM. At the anatomical level, the FFM component consists of water, skeletal muscle, bone, and the visceral organs. The relatively stable relationships that exist between some components of body composition, such as TBW and FFM, have enabled the development of measurement techniques.
Body Composition Measurement
A brief discussion of body composition assessment methods follows. For the purpose of this discussion, assessment methods will be divided into expedient anthropometric methods, that is, those that can be applied in field situations with minimal equipment; and criterion methods, which require costly and immobile equipment, but the results of which may be used to validate the expedient methods.
Field Methods
Anthropometric methods are suitable for field use as the required equipment is inexpensive, portable, and widely available. Measurements pose no subject risk, and minimal technician training is required.
Once an anthropometric dimension is acquired, the measurement is inserted into a prediction formula and the component of interest is then calculated. The prediction formula is developed by selecting a group of anthropometric dimensions for measurement, often skinfold thickness and circumferences. A criterion method is then chosen for quantifying the component of interest, usually FFM or body fat. A group of subjects is then evaluated for anthropometric dimensions and criterion-derived body composition. Statistical methods are next used to develop
the anthropometric body composition prediction formula. Prediction models are usually developed by setting body fat or FFM as dependent variables and anthropometric measures (such as weight, height, and circumferences), age, and ethnicity as potential independent variables. The last stage of model development is to cross-validate the prediction formula in a new subject group. Prediction formula validity is related to a number of factors, including selected anthropometric dimensions, criterion method accuracy and reproducibility, representativeness of subjects on whom the formula is developed, and statistical modeling methods.
Because visceral adipose tissue is associated with chronic disease risk (as described further below), three anthropometric measures have been suggested as indirect markers of visceral adipose tissue; these are waist circumference, hip circumference, and saggital diameter (Williamson, 1993). A growing number of studies support waist circumference as the strongest visceral adipose tissue correlate among the three, suggesting the inclusion of a measure of adipose tissue distribution in circumference protocols. A waist-hip ratio greater than 0.8, which has been associated with increased upper body strength and performance, is also associated with increased risk for NIDDM, cardiovascular disease (approaching male risk), and certain types of cancer among women.
Military Anthropometric Measurements
Two anthropometric measures have been used by the military: circumferences and skinfolds. Circumferences can be measured with low technical error and a high coefficient of reliability by well-trained technicians (Norton and Olds, 1996). That is, between-measurement and between-observer differences are small for experienced and trained technicians. Skinfolds also can be measured easily, although technical errors are fewer and coefficients of reliability are greater for circumferential measurements (Norton and Olds, 1996). Intra- and interexaminer reliabilities of skinfold thicknesses and circumference measurements were evaluated by Mueller and Malina (1987). The investigators found that circumferences were more reliably measured than skinfold thicknesses (circumferences, 0.97 and 0.96 for intra- and interexaminer reliabilities; skinfolds, 0.94 and 0.92). Additionally, Heaney and coworkers found that circumference measurements were more easily learned than skinfold thickness measurements by active-duty Navy personnel (unpublished report cited by Hodgdon, 1992). Based on circumferences, fat and FFM prediction models have been developed with similar predictive value to skinfold-based prediction models (Katch and McArdle, 1973).
The development of body fat equations for each service has been reviewed by Hodgdon (1992). As described earlier, the Marine Corps was the first service to develop and use circumferential estimations of body composition. Marine Corps equations were developed by Wright and coworkers of the Institute of Human Performance in Fairfax, Virginia, using a sample of (279 male and 181 female) Marine Corps personnel (Wright et al., 1980, 1981). The equations were standardized against underwater-weighing and compared to assessments based on skinfold measurements of the same individuals.
The Army equations were developed by Vogel and coworkers (1988) on an ethnically diverse sample of 1,392 Army personnel (1,126 men and 266 women) who otherwise did not reflect the profile of the total Army population with respect to any demographic variables. A total
of 38 anthropometric measurements was obtained on each subject and equations were constructed using factor analysis to determine the most predictive sites for measurement. The equations were standardized against the method of underwater weighing. Friedl (1997) has noted that the female equation was validated on a largely Caucasian population because of methodological problems with the underwater weighing of many of the African American and Hispanic subjects. The body fat standards originally adopted by the Army were those recommended by the DoD panel in 1981 because of their relationship to fitness.
The Navy equations were developed using a similar procedure and a sample of Navy personnel (Hodgdon and Beckett, 1984a, b). According to Hodgdon and Beckett, the Navy body fat standards themselves were actually established by deriving regression equations for body fat as a function of height and weight for a sample of 1,354 Navy personnel, and then calculating the body fat that would be expected for individuals whose weights fell at the cut-off for obesity defined by the 1985 National Institutes of Health Consensus Conference on the health implications of obesity (these weights were 20% above the midpoint weights for individuals of medium frame size according to the 1983 Metropolitan Life Insurance tables). The mean value for critical percent body fat across all heights was 33.5 ± 0.2 for women; to this figure was added approximately one standard error for body composition measurement using the Navy equations and the resulting figure of 36 percent was adopted as the upper limit for percent body fat for women. Thus the Navy body fat standards were actually based on considerations of health.
As described above, the first Air Force equations included a measurement of the flexed biceps circumference as an index of FFM. The use of these equations, which were developed using a mixed sample of military and civilian personnel (197 men and 38 women), has since been abolished in favor of a slight variation of the Navy's equations (AFI 40-502, 1994).
Anthropometric prediction equations are population specific, and ideally, evaluated subjects should be similar to those from whom the specific equation was developed. Because of gender, age, ethnic, and occupation/task variability within each branch of the military, development and subsequent application of the equations must consider this heterogeneity and, optimally, be applicable across all servicemen and women. Results of an unpublished study described by Friedl (1996), which found that the Army equation was no better than BMI at predicting women's body fat, would seem to call into question the value of assessing body fat among active-duty women. However, these results are not supported by other studies that found a strong relationship between the Marine equation's prediction of body fat (Wright et al., 1980) and criterion measures; a strong relationship between the body fat predicted by all three equations and criterion measures (Hodgdon, 1992); and a stronger relationship between circumference-derived body fat and physical fitness than that between weight-for-height and fitness in both men and women (Conway et al., 1989). Friedl (1997) acknowledges that the predictive ability of circumferential equations for women can be improved significantly with alternative methods of subject selection and choice of a criterion method for validation.
A separate but related issue is that of military service-specific equations. In support of the concept of a common body composition equation among the services, Friedl and Vogel (1997) recently demonstrated that each of the service-specific equations (for males) provided similar results in male soldiers across the services, but the female equations did not provide similar estimates of body fat for female soldiers across the services. A study by Westphal and coworkers
(1995) of women in Army basic combat training compared the ability of the four female equations currently in use to predict changes in body composition over the 8-wk period of basic training and to assess the women's compliance with body fat standards. Each of the four equations resulted in significantly different predicted body fat for the same women. The Marine Corps equation predicted the lowest body fat, suggesting that although the Marine Corps upper limit for body fat is lower than those of the other branches, use of its equation would ultimately result in the retention of a population of women who had the same approximate maximum body fat as that of women in the other services. The Navy equation overpredicted body fat of women with greater upper body strength (those able to lift more than 100 lb [45 kg]), in part because of the increased abdominal circumference of these women. Comparing the circumferential measures of all four services, Westphal and coworkers (1995) found wrist and abdominal circumference to be the best independent correlates of body fat; however, comparing the individual components of the equations used by each service showed hip circumference (used by the Army, Navy, and Air Force) to be the best. Both the Navy and Air Force perform a measure of waist circumference, the Marine Corps measures abdominal (navel) circumference, and the Army measures neither. In this study, waist and abdominal circumference were not strongly correlated with measured body fat; other research with Army subjects has shown that the correlation between abdominal fat and total body fat is significant only in the fattest women (Vogel and Friedl, 1992a).
Criterion Methods
An important aspect of developing anthropometric body composition equations is standardization against a reference or criterion method. Ideally, the selected criterion method should be accurate and precise in heterogeneous populations that vary in age, gender, and ethnicity. In the past, all military branches have used underwater weighing as the reference method to partition body weight into fat and FFM. The underwater weighing two-component model is based on assumed constant densities of fat and FFM. However, as discussed further below, evidence is mounting that water, protein, and mineral FFM fractions may vary considerably among individuals. They may also vary systematically between genders and among age- and ethnic groups (Lohman, 1992). Because the percentage of female and non-Caucasian soldiers is increasing (see Table 2-3 for current ethnicity distribution), and the average age of female soldiers is increasing, the subject population used to develop and validate the military equations (a predominantly young, Caucasian population) is becoming increasingly less representative of the military population whose body composition the equations are being used to predict. Furthermore, questions persist regarding the ways in which underwater weighing is performed and technical problems are overcome (for example, determination of residual volume) (McArdle et al., 1996). Finally, longitudinal studies have shown that underwater weighing does not reliably measure small changes in body composition.
An improved three-compartment model that accounts for the water component of fat-free body mass was suggested by Siri in 1961. Siri's three-compartment model is based on measured body weight, body volume, and body water. Fat estimates using this model are less vulnerable to hydration variation than are those using the classic two-compartment model.
TABLE 2-3 Ethnicity of U.S. Military Personnel by Branch and Rank as of September 30, 1996
|
|
Enlisted (%) |
|
|
Officer (%) |
|
|
||
|
Ethnicity |
Army |
Air Force |
Navy |
Marine Corps |
Army |
Air Force |
Navy |
Marine Corps |
|
Caucasian |
42 |
65 |
58 |
59 |
70 |
82 |
82 |
83 |
|
African American |
48 |
25 |
31 |
25 |
20 |
10 |
9 |
9 |
|
Hispanic |
4 |
4 |
8 |
11 |
3 |
2 |
2 |
4 |
|
Other |
2 |
2 |
1 |
2 |
5 |
5 |
4 |
2 |
|
SOURCE: Defense Manpower Data Center (Rosslyn, Va., 1996). |
||||||||
In the past decade, several four-compartment models were developed that extend the three-compartment model by including bone mineral estimates. In healthy, weight-stable ethnically similar subjects within the same age range, two-, three-, and four-compartment models would all be expected to provide similar fat estimates. In disease, unstable conditions, or when applied across broadly ranging subject groups that differ in age, gender, and race, the four-compartment methods usually provide fat estimates with improved accuracy. For example, the two-compartment model would provide less accurate estimates of body fat in a patient with liver disease, ascites, and bone demineralization than would a four-compartment model. African American and Caucasian subjects differ in bone mineral, and this variation is not accounted for in two-and three-compartment models. The major advance that has made the choice of these models possible is the ready access to TBW and bone mineral estimates in addition to several approaches for measuring body volume. The four-compartment method is widely used as a reference for body fat estimation when developing other body composition methods, and agreement now exists that, compared with earlier two-compartment methods, four-compartment methods are superior reference standards for fat and FFM estimation in heterogeneous populations (Heymsfield et al., 1996; Withers et al., in press).
A typical molecular four-compartment study requires several hours for completion, usually beginning with isotope dilution (either by 2H2O, 3H2O, or H218O) for TBW and measurement of body weight. Underwater weighing for body volume and DXA studies for bone mineral estimation then follow. Four measured variables, TBW, body weight, body volume (underwater weighing), and bone mineral mass (DXA) are then used to calculate total body FFM and fat.
An important recent advance in body composition measurement is the use of DXA alone to estimate body composition (IOM, 1997). DXA has primarily been used clinically for the measurement of bone mineral content and bone mineral density to assess the risk for osteoporosis. DXA entails scanning the body with x rays of differing energies; the attenuation of these rays by body tissues is subjected to computer analysis to yield a three-component estimate of total bone mineral mass, total body fat-free soft tissue, and body fat. As a means of measuring body composition, DXA appears to be more precise and reproducible than underwater weighing when repeated measurements are made over 1 day in the same subject, resulting in coefficients of
variation of about 1 percent for total-body bone mineral, 2 percent for fat-free soft tissue, and 0.8 percent for fat (Kohrt, 1997). DXA is also more convenient to use than underwater weighing for both the subject and the investigator. In addition, DXA yields information about regional body composition and has the advantage of producing results that are independent of ethnic differences if the software allows. Most DXA systems with appropriate software are capable of estimating whole-body and regional bone mineral, body fat, and fat-free soft tissues. Because extremity fat-free soft tissue is mainly muscle, except for a small amount of skin and connective tissue, DXA also is capable of providing appendicular skeletal muscle mass estimates as was demonstrated by Mello and colleagues (1995).
Friedl (1997) notes that DXA is more convenient in large-scale military field research studies and has better reproducibility than underwater weighing (±0.5% vs. ±1.0% body fat). He further notes that the accuracy of the DXA soft tissue analysis compares well with the four-compartment model for male and female soldiers (Friedl, 1997). Additionally, comparisons of DXA results with body fat estimates from anthropometry or total-body potassium also produced good results. While DXA shows much promise in its ability to assess fat accurately, measurements of FFM are susceptible to changes in hydration status and protein content as well as an inability to analyze the composition of soft tissues close to bone, requiring further refinement of this methodology. At present, the regional assessment of body composition by DXA is inferior to that of magnetic resonance imaging and computerized tomography.
Although some concern still exists regarding the calibration of DXA and other technical issues, there is little question that within the next several years it too may serve as a practical reference method. Preliminary evidence suggests that the military is considering DXA as a reference method in the future; the feasibility of this will increase after cross-validation has been performed against accepted multicomponent reference methods.
Summary
Since the mid-1980s, the military has used anthropometric equations to assess body fat in soldiers. Each service has derived its own gender-specific equations, standardized against the criterion method of underwater weighing, a two-compartment method whose measurements are influenced by ethnic and age-related differences in FFM. The populations of active-duty soldiers used to validate the equations have, with time, become less representative of the ethnic and age-diversity of the current military population. The need to ensure readiness without discrimination on the basis of ethnicity or age, or exclusion of the strongest soldiers has led the military to pursue improvement in expedient methods of body composition assessment, particularly as applied to women. Proposed improvements have included development of a DXA-based body composition assessment protocol as a criterion method. An additional question faced by the military is whether one circumferential equation can be developed and applied to all active-duty service-women. While agreement among the service-specific equations for men has been good, this has not been true for the equations applied to women.
Factors Affecting Body Composition
Body Composition and Age
Most investigators agree that body weight becomes progressively more difficult to maintain with age. As an example of this phenomenon, Williams (1997) recently argued that body weight and associated circumferences will increase with advancing age unless food intake is significantly reduced or physical activity levels are substantially increased (even in otherwise active individuals). Nevertheless, the Dietary Guideline Committee (1995) could find no rationale to liberalize the upper BMI range consistent with good health as individuals increase in age.
A large number of cross-sectional studies demonstrate an increase in fatness (percent body fat) with age, independent of body weight change, in women (Forbes, 1987; Gallagher et al., 1996b). In a study of non-exercising civilian women, the mean percent body fat of women with BMI of 25 increased from 30 between the ages of 17 and 20 to 34 for women 40 and older (Table 2-4) (Gallagher et al., 1996a). The implication of this is that lean body mass decreases with age.
Currently, the Army and the Air Force set their body fat limits according to age, while the Navy and Marine Corps standards are age-independent. The maximum body fat for Army women increases from 30 percent for women between the ages of 17 and 20 to 36 percent for women 40 and older. The Air Force sets an upper limit of 28 percent for women 29 years of less and 32 percent for women 30 and older. To date, no longitudinal studies have been performed with career military personnel to examine the effect of body weight standards on long-term weight and body fat stability in these individuals.
Genetic Influences on Body Composition
Adoption and twin studies that have assessed the relationship between body composition and genetics (Bouchard, 1996, 1997) have provided heritability estimates that are quite varied. In studies of monozygotic twins, BMI heritability estimates were reported in the range of 40 to 70
TABLE 2-4 Effects of Age on Relationship between Body Mass Index* and Percent Body fat
percent while those from adoption studies grouped around approximately 30 percent or less. Nuclear family evidence from epidemiological studies provided a broad heritability of approximately 40 percent. When several types of relatives are joined in the study design, the heritability estimates fall into the range of 25 to 40 percent.
The effect of environmental factors on the genetic control of body composition has been investigated by under- and over-feeding studies. The results indicate that there are as yet undetermined synergistic effects of genetics and environment on body composition (Rosenbaum et al., 1997).
Ethnic Differences in Fat-Free Mass
The most well-documented difference in body composition between Caucasians and other ethnic groups, particularly African Americans, is an increased density of FFM in non-Caucasians that is reflective of a heavier and denser skeletal mass. The increase in bone mass observed among African American women compared to Caucasian women is due to total body bone mineral mass and greater appendicular lengths, and has been observed across the entire adult lifespan (Gallagher et al., 1996b). The mechanisms that account for these differences, which appear to involve genetic regulation of vitamin D receptor metabolism, were reviewed by Wood (1996) and are presented in the workshop summary (Appendix A). As will be discussed below, the validity of methods of body composition assessment that are based on an assumption of constant bone density among all ethnic groups is called into question by the finding of differences in bone mineral density in some populations.
Ethnic Differences in Total Body fat and Fat Distribution
Increasing evidence suggests that total body fat as well as regional fat distribution are influenced by genetic factors and that these are important factors to consider in describing population differences. The striking increase in the prevalence of obesity in the last decade measured in NHANES III (Kuczmarski et al., 1994) occurred disproportionately among Mexican American (46.7%) and non-Hispanic African American women (48.6% compared with 32.9% for Caucasian women).
In a review of ethnic differences in percent body fat and fat distribution, Gasperino (1996) concluded that percent body fat of African American women was lower than that of Caucasian women. This finding was confirmed by Aloia and coworkers (1997) who compared percent body fat in 23 pairs of African American and Caucasian women matched for height and weight. In contrast to these findings, however, two other studies reported no difference between African American women and Caucasian women with respect to percent body fat adjusted for BMI over a range of ages (Gallagher et al., 1996a) and percent body fat adjusted for body size among girls 3 to 18 years of age (Ellis et al., 1997). In the latter study, percent body fat of Hispanic girls exceeded that of Caucasian girls. Thus, no clear picture emerges from recent studies regarding ethnic differences in percent body fat of women, possibly due to differences in measurement methodology.
The possibility of ethnic differences in body fat distribution in the United States has also been studied (Conway, 1995). Several studies have reported that upper body fat of African American women is greater than that of Caucasian women of similar BMI (Adams-Campbell et al., 1990; Burke et al., 1992; Zillikens and Conway, 1990). In addition, the waist-hip ratio of African American women has been reported to be greater than that of Caucasian women in several studies (Croft et al., 1996; Gasperino, 1996), while others have reported no difference or smaller waist-hip ratio among African American women (Conway et al., 1995; Stevens et al., 1994; Thomas et al., 1997; Yanovski et al., 1996). Stevens and coworkers (1994) also found the average waist/midarm circumference ratio to be lower in a group of 242 African American women than in 312 Caucasian women. Studies comparing distributions of visceral and subcutaneous adipose tissue between African American and Caucasian women have found lower levels of upper body visceral adipose tissue in 9 African American women compared to 11 of their Caucasian counterparts (Conway et al., 1995); lower levels of total, visceral, and subcutaneous adipose tissue in 20 normal weight African American girls compared to 20 Caucasian girls (Yanovski et al., 1996); and finally lower visceral adipose tissue and visceral-subcutaneous adipose tissue ratios for a given waist-hip ratio when adjusted for total body fat among 25 African American women compared with 25 Caucasian women (Albu et al., 1997). The reasons for these discrepancies among studies is not known but may be associated with methodological differences. However, Thomas and coworkers (1997), who found that African American women had the smallest waist-hip ratio but the largest waist and gluteal circumferences among 143 women of four ethnic origins (Caucasian, African American, Hispanic, and Native American), also showed that the variation within each ethnic group exceeded the variation between groups such that it was not possible to predict a woman's ethnic origin based on body fat distribution (waist-hip ratio).
Implications of ethnic differences in body fat distribution. Differences in body fat distribution, particularly increases in waist-hip ratio, suggestive of increased deposition of intra-abdominal fat, have been associated with an increase in risk for particular diseases, but these same waist-hip ratio differences are associated with greater upper body strength in women. Similarly, as discussed above, because all military services currently employ circumferential methods of body fat prediction (standardized against underwater weighing) to determine qualification for accession into and retention in the armed forces, ethnic differences in total bone density or regional body fat deposition could potentially favor one ethnic group over another, although no data were found to suggest that this has occurred.
Summary
While there is little disagreement that body weight maintenance becomes more difficult with increasing age, current guidelines do not suggest relaxing the upper BMI limit that is believed to be consistent with good health, for older individuals. Research also suggests that percent body fat increases with age, independent of change in body weight. The Army and Air Force body fat standards make allowances for age-associated increases in body fat, while those of the Navy and Marine Corps do not. Estimates of heritability of BMI range from 25 to 40 percent.
Studies suggest that genetics and environmental factors interact synergistically to influence body composition. The most well-documented difference in body composition attributable to ethnic variation is that of increased skeletal density among African American women relative to Caucasian women. Ethnic differences in total body fat and fat distribution have been more difficult to demonstrate, with some studies showing clear differences and others showing greater withingroup than between-group variation. The issue of ethnic differences in FFM and body fat distribution has significant implications for the design of anthropometric equations to assess body fat in military women as well as the choice of a criterion method to validate those equations.
Influences Of Body Composition On Health, Fitness, And Appearance
Body Composition and Health
Body Fat Distribution
Evidence for a relationship between body fat as indicated by BMI and health risk was presented earlier. There is abundant evidence that fat or adipose tissue distribution also influences health. A number of the health risks associated with overweight may be more strongly related to the pattern of body fat distribution than to total fat. Individuals with an excess accumulation of abdominal fat appear to be at increased risk for cardiovascular disease, hypertension, and NIDDM (Bouchard, 1988; Wing et al., 1992). Results of the San Antonio Heart Study, for example, which included 491 Mexican American women, demonstrated that while waist-to-hip ratio and BMI were both predictors of risk for NIDDM, waist-to-hip ratio was actually a stronger predictor (Haffner and Bauer, 1992). Gender differences in insulin resistance are clearly related to differences in waist-to-hip ratio (Laws et al., 1997).
Evidence also has suggested, however, that increased waist-to-hip ratio may not be as strong a risk factor for disease in non-Caucasians as it is for Caucasians. Dowling and Pi-Sunyer (1993) reported that African American women with upper body obesity as defined by increased waist-to-hip ratio had less insulin resistance and glucose intolerance, and lower serum triglycerides than Caucasian women of comparable upper body obesity. Results of the Insulin Resistance Atherosclerosis Study, a large multicenter study of NIDDM and cardiovascular disease risk in African Americans, Hispanics, and Caucasians, have also suggested that upper body obesity, independent of total body fatness, may be a greater risk factor for Caucasians than for non-Caucasians (Karter et al., 1996). More research in this area is clearly needed. Pending the results of additional body composition-clinical outcome studies, most investigators currently use BMI as a measure of health risk.
Body Composition and Risk for Injury
Another aspect of health risk of considerable interest to the military and one that has been examined in relation to body composition and BMI is injury risk. A weak association was reported
in the review of Jones and coworkers (1994) between BMI and exercise-related injuries, including stress fracture of the lower extremities. Some support exists for a bimodal relationship between BMI and injury risk, with subjects who have either high or low BMIs at greater injury risk.1 In their study, Jones and coworkers (1992) reported a gender difference in injury risk, with men showing the aforementioned bimodal distribution related to BMI while risk was significantly increased only in women with low BMI. The authors hypothesized that injury-prone women with low body fat may not have adequate FFM to support their weight without ''undue stress." Kowal (1980) has published data on the nature and causes of women's injuries that occurred as part of an endurance training program. Higher weight and percent body fat, possibly secondary to lack of prior fitness, were significantly related to increased incidence of injury during training.
Body Composition and Fitness
Fatness influences fitness because excessive adiposity may add a functionally inert component of weight that must be carried during various physical activities. According to Friedl (1997), the absence of grossly obese soldiers has limited the ability of the military to demonstrate strong relationships between fatness and physical performance. Nevertheless, when Conway and colleagues (1989) examined the association between circumference-derived fatness measures in Navy men and women and measures of physical fitness, significant negative correlations were observed between fatness and physical fitness measures that tended to be greater in magnitude than the associations observed between body weight/height indices and physical fitness. In another study of Navy personnel, Beckett and Hodgdon (1987) evaluated fatness in active-duty women and found a negative association between underwater weighing-derived fat mass and two measures of fitness and endurance: box carrying capacity and running performance. A study of male and female Canadian Forces troops (for whom BMI was used as an index of body fat until body fat standards were eliminated in 19922) found a strong association between increasing BMI (> 25) and decreasing fitness and performance (except for grip strength) (Jette et al., 1990). The complex associations among fatness, fitness, and health are demonstrated by the study of Marchitelli and colleagues (1995), in which women who exceeded the fat standard after 8 weeks of basic combat training had lower high density lipoprotein levels, increased cardiovascular risk, and significantly increased 2-mi run times (that is, lower endurance) but were significantly stronger (as measured by performance on machine lift and bench press, for example) than their less fat counterparts. A potential explanation for greater strength accompanying increased levels of fatness is that heavier women may have a larger FFM.
Khosla and McBroom (1984) calculated BMIs for 824 female Olympic finalists from 47 events included in the 1972 and 1976 Olympics (Table 2-5). Gymnasts and rowing coxswains had the lowest BMIs: the BMIs of gymnasts averaged 18.6 to 18.7 and ranged from 16.0 to 20.0, while the BMIs of coxswains averaged 18.6 and ranged from 15.8 to 29.8. Not surprisingly, shot putters and discus throwers had the highest BMIs: shot putters' BMIs averaged 28.1 (range 23.9 to 31.1) and discus throwers' BMIs averaged 28.4 (range 23.6 to 34.7). Women who competed in activities requiring all-around strength and endurance, that is those involved in the pentathlon, canoeing, handball, rowing, swimming, and volleyball, demonstrated average BMIs of 18.6 to 25.9. Thus, it may be argued that women with BMIs ranging from 16 to 35 have demonstrated extreme physical fitness. These data suggest that while all-around fitness may be associated with a BMI range of 19 to 26, women of BMI as high as 35 and as low as 16 have demonstrated excellent athletic performance.
In several large epidemiological studies (Blair et al., 1989; Paffenbarger et al., 1986), decreased mortality and morbidity risk have been shown to correlate more closely with activity level than body fat. According to these findings, it is possible to be active and fit, with a low health risk, and still be fat by the body fat standard.
Body Fat Standards Versus Fitness Standards
It is generally acknowledged that increasing body fatness is associated with lowering of weight-bearing endurance performance while increasing lean mass, often accompanied by greater body fat and weight, is compatible with greater strength (IOM, 1992). Setting a high body fat limit thus favors selection of women who are strong but lack optimum endurance and vice versa, thus creating a paradox.
Additionally, within any BMI or percent body fat range, women will vary greatly in overall "fitness." Hence two women of the same fatness can have very different lifting capacity or ability to complete a 2-mi run. According to Jones et al. (1992), body composition explains only 5 to 30 percent of between-individual differences in endurance performance and other factors such as sit-ups and vertical jumps. As fitness is a key component to military readiness, fitness standards must be considered in conjunction with standards of body weight and composition. This will be discussed in greater detail in Chapter 3.
Body Composition and Appearance
With respect to the role of body composition in appearance, two aspects of body composition prevail; these are total fatness and fat distribution. Both excessive thinness and overweight may be associated with an undesirable military appearance. Localized accumulations of adipose tissue associated with excessive weight gain, such as adipose tissue deposited within the abdominal cavity or around the hips and thighs, may also influence overall appearance. References to the appearance standard in military directives describe it predominantly in terms of abdominal
TABLE 2-5 Mean Body Mass Index (BMI) of Female Olympic Athletes, 1972–1976
|
Event |
n |
Mean BMI* ± SD |
Range |
|
Archery |
10 |
21.7 ± 1.4 |
19.3–23.8 |
|
Athletics 100m run |
15 |
20.9 ± 2.1 |
18.4–24.3 |
|
Athletics 200m run |
15 |
20.5 ± 1.8 |
18.4–24.3 |
|
Athletics 400m run |
16 |
19.6 ± 1.0 |
17.3–21.0 |
|
Athletics 800m run |
16 |
20.0 ± 1.4 |
17.5–22.5 |
|
Athletics 1,500m run |
18 |
19.0 ± 1.1 |
17.6–20.8 |
|
Athletics 100m hurdles |
16 |
21.3 ± 1.0 |
20.3–23.3 |
|
Athletics high jump |
16 |
20.6 ± 0.8 |
19.3–21.6 |
|
Athletics long jump |
16 |
20.6 ± 1.0 |
19.3–21.8 |
|
Athletics shot |
16 |
28.1 ± 2.4 |
23.9–31.1 |
|
Athletics discus |
16 |
28.4 ± 3.1 |
23.6–34.7 |
|
Athletics javelin |
15 |
23.3 ± 1.4 |
21.1–25.8 |
|
Athletics pentathlon |
16 |
22.3 ± 1.9 |
20.2–26.8 |
|
Basketball |
36 |
22.5 ± 2.0 |
19.0–29.0 |
|
Canoeing kayak 1 |
22 |
22.8 ± 1.6 |
20.3–25.3 |
|
Canoeing kayak 2 |
36 |
23.2 ± 1.3 |
19.4–25.2 |
|
Canoeing kayak 3 |
8 |
22.7 ± 1.5 |
20.9–25.0 |
|
Equestrian dressage |
12 |
20.0 ± 2.1 |
18.2–25.4 |
|
Equestrian 3 day |
1 |
21.0 |
N/A |
|
Equestrian jumping |
2 |
21.2 ± 0.4 |
20.9–21.5 |
|
Fencing foil |
18 |
22.0 ± 1.6 |
18.6–24.2 |
|
Gymnastics beam |
13 |
18.5 ± 1.3 |
16.0–20.0 |
|
Gymnastics floor |
18 |
18.7 ± 1.2 |
16.0–19.9 |
|
Gymnastics vault |
12 |
18.6 ± 1.3 |
16.0–19.9 |
|
Gymnastics asymmetric bars |
12 |
18.6 ± 1.3 |
16.0–20.0 |
|
Hand ball |
42 |
22.8 ± 1.4 |
20.0–25.9 |
|
Rowing sculls single |
11 |
22.4 ± 1.5 |
18.2–24.1 |
|
Rowing sculls double |
12 |
22.4 ± 1.4 |
20.1–24.9 |
|
Rowing coxless pairs |
12 |
23.0 ± 1.8 |
21.1–25.1 |
|
Event |
n |
Mean BMI* ± SD |
Range |
|
Rowing coxed quad† |
30 |
23.1 ± 1.6 |
21.0–25.6 |
|
Rowing coxed fours† |
30 |
23.9 ± 1.9 |
21.2–28.7 |
|
Rowing eight† |
27 |
24.1 ± 2.5 |
20.6–28.1 |
|
All coxswains |
15 |
18.6 ± 1.5 |
15.8–29.8 |
|
Swimming 100m f.s. |
15 |
21.1 ± 1.4 |
18.0–23.3 |
|
Swimming 200m f.s. |
14 |
21.0 ± 1.5 |
18.0–23.3 |
|
Swimming 400m f.s. |
13 |
20.5 ± 1.3 |
18.0–22.0 |
|
Swimming 800m f.s. |
15 |
20.7 ± 1.4 |
18.1–23.2 |
|
Swimming 100m back stroke |
15 |
21.0 ± 1.6 |
17.3–22.8 |
|
Swimming 200m back stroke |
15 |
20.6 ± 1.4 |
17.9–22.5 |
|
Swimming 100m breast stroke |
16 |
21.5 ± 1.9 |
19.4–26.2 |
|
Swimming 200m breast stroke |
16 |
21.9 ± 1.7 |
20.3–26.2 |
|
Swimming 100m butterfly |
16 |
21.6 ± 1.4 |
19.7–24.1 |
|
Swimming 200m butterfly |
16 |
21.2 ± 1.6 |
19.4–24.1 |
|
Swimming 200m medley |
7 |
21.3 ± 1.0 |
20.1–22.5 |
|
Swimming 400m medley |
9 |
20.5 ± 1.3 |
18.1–22.2 |
|
Swimming spring dive |
16 |
20.1 ± 0.9 |
18.0–22.1 |
|
Swimming platform dive |
16 |
20.6 ± 1.5 |
18.7–25.1 |
|
Volleyball |
70 |
23.1 ± 1.7 |
20.0–30.1 |
|
* Originally listed as bulk index (g/cm2; BMI, kg/m2). † Physical characteristics of coxswains are excluded in calculating mean and standard deviation (SD); details on all coxswains are listed separately. SOURCE: Adapted from Khosla and McBroom (1984). |
|||
girth (AR 600-9, 1986; Vogel and Friedl, 1992b). Hodgdon, in his review of standards and methods used by the military to assess body composition (1992), emphasized the subjective nature of military appearance assessments. To explore the relationship between military appearance assessments and fatness, Hodgdon and colleagues (1990) evaluated appearance judgments by 11 Navy headquarters staff based on visual inspection and compared these judgments to body fat estimation in 251 female Army personnel dressed in Class A uniforms. Only a modest correlation was observed between appearance ratings and percent fat (r = 0.46), leading the authors to conclude that factors other than body composition, notably subjective judgment, influence appearance ratings. In the 1992 Committee on Military Nutrition Research (CMNR) report on Body Composition and Physical Performance (IOM, 1992) a presentation by Shephard (1992) raised
the point that in some occupations, image is considered an important aspect of effectiveness, and that because the image of a soldier is one of leanness, an overfat appearance could weaken this image and threaten deterrence; there is no research on this issue. The report itself recommended that if, in spite of the lack of demonstrable association between appearance and task performance, appearance standards were determined to be crucial to military operations, objective evaluation criteria would need to be developed, since violations of the appearance standard that were attributed to excess body fat could have negative career consequences. There is no evidence that objective appearance evaluation criteria have been developed.
Another appearance-related concern is an overemphasis on thinness as a measure of attractiveness, observed in the civilian population, that is often linked with the onset of abnormal eating behaviors and related morbidity in women (see Chapter 4 and summary of Garner's presentation in the workshop summary [Appendix A]). The concern is that issues of appearance may begin to have a negative impact on health and fitness, and therefore maintenance of readiness among military women.
Summary
There is clear evidence for a relationship between body fat distribution and risk for chronic illness among Caucasians, with increased waist-hip ratio predicting an increased risk for NIDDM and cardiovascular disease. Although more research is needed, this relationship appears to be weaker among non-Caucasians. BMI that is significantly higher or lower than the normal range increases the risk for stress fracture among military recruits in basic combat training. The relationship between body composition, physical fitness, and performance is complex: military women who exceed the weight-for-height standards or the body fat standards demonstrate increased performance of some strength tasks, but poorer performance on some tests of aerobic fitness and endurance, possibly the result of larger FFM accompanying increased weight and fatness. Body fat alone cannot be used to predict physical ability. The relationship between percent body fat and subjective judgment of appearance in a military uniform is also not strong.
Concluding Remarks
According to Friedl, the military assesses weight and body fat as a means to prevent obesity and promote physical fitness by motivation. The methods used to assess body fat must be accurate enough to classify soldiers, must not grossly over- or underestimate the body fat of individuals, and must not discriminate against particular groups because of age or ethnic differences in body composition. The equations currently in use underpredict body fat for individuals of higher body fat and overpredict body fat slightly at the lower end; nevertheless, there is concern that some of the women with greatest physical strength and lifting capability are those most at risk for exceeding the body fat standards and being referred to weight control programs, with significant professional consequences. An additional concern is the variability in comparative body fat estimates rendered by applying each service's equation to the same individuals, suggesting the need for a single equation to be developed for all military women. Anthropometric prediction
models can now be optimally derived using criterion methods that are of high technical quality and that are minimally influenced by individual differences in chemical composition. Validation of these methods can include adequate numbers of subjects who have characteristics similar to those on whom the method will ultimately be applied; appropriate anthropometric dimensions obtained by trained observers can be incorporated; and modern statistical modeling approaches can be used to develop and cross-validate the models.
References
Adams-Campbell, L.L., M. Nwankwo, F. Ukoli, J. Omene, G.T. Haile, and L.H. Kuller. 1990. Body fat distribution patterns and blood pressure in black and white women. J. Natl. Med. Assoc. 82(8):573–576.
Adde, N. 1996. Body fat test methods come under fire. Former Air Force staff sergeant contests weight-related discharge. Army Times. September 30.
Albu, J.B., L. Murphy, D.H. Frager, J.A. Johnson, and F.X. Pi-Sunyer. 1997. Visceral fat and race-dependent health risks in obese nondiabetic premenopausal women. Diabetes 46(3):46–62.
Aloia, J.F., A. Vaswani, R. Ma, and E. Flaster. 1997. Comparison of body composition in black and white premenopausal women. J. Lab. Clin. Med. 129(3):294–299.
AR (Army Regulation) 600-9. 1986. See U.S. Department of the Army, 1986 .
Baumgartner, R.N., S.B. Heymsfield, and A.F. Roche. 1995. Human body composition and the epidemiology of chronic disease. Obes. Res. 3:73–95.
Beckett, M.B., and J.A. Hodgdon. 1987. Lifting and carrying capacities relative to physical fitness measures. Report No. 87-26. San Diego, Calif.: Naval Health Research Center.
Blair, S.N., H.W. Kohl III, R.S. Paffenbarger, D.G. Clark, K.H. Cooper, and L.W. Gibbons. 1989. Physical fitness and all-cause mortality: Prospective study of healthy men and women. J. Am. Med. Assoc. 262:2395–2401.
Bouchard, C. 1988. Genetic factors in the regulation of adipose tissue distribution. Acta Med. Scand. Suppl. 723:135–141.
Bouchard, C. 1996. Long-term programming of body size. Nutr. Rev. 54:S8–S16.
Bouchard, C. 1997. Human variation in body mass: Evidence for a role of the genes. Nutr. Rev. 55:S21–S30.
Burke, G.L., P.J. Savage, T.A. Manolio, J.M. Sprafka, L.E. Wagenknecht, S. Sidney, L.L. Perkins, K. Liu, and D.R. Jacobs Jr. 1992. Correlates of obesity in young black and white women: The CARDIA Study. Am. J. Public Health 82:1621–1625.
COMDTINST (Commandant Instruction) M1020.8C. 1994. See U.S. Department of the Navy, U.S. Coast Guard Headquarters, 1994.
Conway, J.M. 1995. Ethnicity and energy stores. Am. J. Clin. Nutr. 62(suppl. 5):1067S–1071S.
Conway J.M., S.Z. Yanovski, N.A. Avila, and V.S. Hubbard. 1995. Visceral adipose tissue differences in black and white women. Am. J. Clin. Nutr. 61:765–771.
Conway, T.L., T.A. Cronan, and K.A. Peterson. 1989. Circumference-estimated percent body fat versus weight-height indices: Relationships to physical fitness. Aviat. Space Environ. Med. 60:433–437.
Croft, J.B., D.S. Freedman, N.L. Keenan, D.P. Sheridan, C.A. Macera, and F.C. Wheeler. 1996. Education, health, behaviors, and the black-white difference in waist-hip ratio. Obes. Res. 4(6):505–512.
DoD (Department of Defense). 1981. See U.S. Department of Defense, Office of the Assistant Secretary of Defense for Manpower, Reserve Affairs, and Logistics. 1981.
DoD (Department of Defense) Directive 1308.1. 1981. See U.S. Department of Defense, 1981.
DoD (Department of Defense) Directive 1308.1. 1995. See U.S. Department of Defense, 1995.
Dowling, H.J., and F.X. Pi-Sunyer. 1993. Race-dependent health risks of upper body obesity. Diabetes 42:537–543.
Durnin, J.V.G.A., and J. Womersley. 1974. Body fat assessed from total body density and its estimation from skinfold thickness: Measurements on 481 men and women aged from 16 to 72 years. Br. J. Nutr. 32:77–97.
Ellis, K.J., S.A. Abrams, and W.W. Wong. 1997. Body composition of a young, multiethnic female population. Am. J. Clin. Nutr. 65(3):724–731.
Forbes, G.B. 1987. Human Body Composition: Growth, Aging, and Activity. New York: Springer-Verlag.
Friedl, K.E. 1996. Methodological problems in the assessment of women's body composition by the military: Identification of valid and reliable methods for field use. Presentation at the workshop on Assessing Readiness in Military Women: The Relationship to Nutrition. September 9–10, Irvine, Calif.
Friedl, K.E. 1997. Military application of body composition assessment technologies. Pp. 81–126 in Emerging Technologies for Nutrition Research: Potential for Assessing Military Performance Capability, S.J. Carlson-Newberry and R.B. Costello, eds. Committee on Military Nutrition Research, Food and Nutrition Board, Institute of Medicine. Washington, D.C.: National Academy Press.
Friedl, K.E., and J.A. Vogel. 1997. Validity of percent body fat predicted from circumferences: Classification of men for weight control regulations. Mil. Med. 162:194–200.
Gallagher, D., M. Visser, D. Sepulveda, R.N. Pierson, T. Harris, and S.B. Heymsfield. 1996a. How useful is body mass index for comparison of body fatness across age, sex, and ethnic groups Am. J. Epidemiol. 143(3):228–239.
Gallagher, D., M. Visser, Z. Wang, T. Harris, R.N. Pierson Jr., and S.B. Heymsfield. 1996b. Metabolically active component of fat-free body mass: Influences of age, adiposity, and gender. Metabolism 45:992–997.
Garner, D.M. 1996. Health consequences and assessment of disordered eating and weight control behaviors. Presentation at the workshop on Assessing Readiness in Military Women: The Relationship to Nutrition. September 9–10, Irvine, Calif.
Gasperino, J. 1996. Ethnic differences in body composition and their relation to health and disease in women. Ethn. Health 1(4):337–347.
Graham, W.F. 1996. Cross-sectional profile of body composition among active-duty Navy and Marine Corps personnel. Presentation at the workshop on Assessing Readiness in Military Women: The Relationship to Nutrition. September 9–10, Irvine, Calif.
Haffner, S.M., and R.L. Bauer. 1992. Excess androgenicity only partially explains the relationship between obesity and bone density in premenopausal women. Int. J. Obes. Relat. Metab. Disord. 16(11):869–874.
Heymsfield, S.B., Z.M. Wang, and R. Withers. 1996. Multicomponent molecular-level models of body composition analysis. In Human Body Composition. A.F. Roche, S.B. Heymsfield, and T.G. Lohman, eds. Champaign, Ill.: Human Kinetics Publishers, Inc.
Heymsfield, S., R. Ross, Z.M. Wang, and D. Frager. 1997. Imaging techniques of body composition: Advantages of measurement and new uses. Pp. 127–152 in Emerging Technologies for Nutrition Research: Potential for Assessing Military Performance Capability, S.J. Carlson-Newberry and R.B. Costello, eds. Committee on Military Nutrition Research, Food and Nutrition Board, Institute of Medicine. Washington, D.C.: National Academy Press.
Hodgdon, J.A. 1992. Body composition in the military services: Standards and methods. Pp. 57–70 in Body Composition and Physical Performance, Applications for the Military Services, B.M. Marriott and J. Grumstrup-Scott, eds. Committee on Military Nutrition Research, Food and Nutrition Board, Institute of Medicine. Washington, D.C.: National Academy Press.
Hodgdon, J.A., and M.B. Beckett. 1984a. Prediction of percent body fat for U.S. Navy men from body circumferences and height. Report no. 84-11. San Diego, Calif.: Naval Health Research Center.
Hodgdon, J.A., and M.B. Beckett. 1984b. Prediction of percent body fat for U.S. Navy women from body circumferences and height. Report no. 84-29. San Diego, Calif.: Naval Health Research Center.
Hodgdon, J.A., P.I. Fitzgerald, and J.A. Vogel. 1990. Relationships between body fat and appearance ratings of U.S. soldiers. Report No. 90-01. San Diego, Calif.: Naval Health Research Center.
IOM (Institute of Medicine). 1992. Body Composition and Physical Performance, Applications for the Military Services, B.M. Marriott and J. Grumstrup-Scott, eds. Committee on Military Nutrition Research, Food and Nutrition Board. Washington, D.C.: National Academy Press.
IOM (Institute of Medicine). 1997. Emerging Technologies for Nutrition Research: Potential for Assessing Military Performance Capability, S.J. Carlson-Newberry and R.B. Costello, eds. Committee on Military Nutrition Research, Food and Nutrition Board. Washington, D.C.: National Academy Press.
James, W.P., A. Ferro-Luzzi, and J.C. Waterlow. 1988. Definition of chronic energy deficiency in adults. Report of a working party of the International Dietary Energy Consultative Group. Eur. J. Clin. Nutr. 42(12):969–981.
Jette, M., K. Sidney, and W. Lewis. 1990. Fitness performance, and anthropometric characteristics of 19,185 Canadian Forces personnel classified according to body mass index. Mil. Med. 155:120–126.
Jones, B.H., M.W. Bovee, and J.J. Knapik. 1992. Associations among body composition, physical fitness, and injury in men and women Army trainees. Pp. 141–172 in Body Composition and Physical Performance, Applications for the Military Services, B.M. Marriott and J. Grumstrup-Scott, eds. Committee on Military Nutrition Research, Food and Nutrition Board, Institute of Medicine. Washington, D.C.: National Academy Press.
Jones, B.H., D.N. Cowan, and J.J. Knapik. 1994. Exercise, training, and injuries. Sports Med. 18:202–214.
Kannel, W.B., R.B. D'Agostino, and J.L. Cobb. 1996. Effect of weight on cardiovascular disease. Am. J. Clin. Nutr. 63(suppl. 3):419S–422S.
Karter, A.J., E.J. Mayer-Davis, J.V. Selby, R.B. D'Agostino, S.M. Haffner, P. Sholinsky, R. Bergman, M.F. Saad, and R.F. Hamman. 1996. Insulin sensitivity and abdominal obesity in African-American, Hispanic, and non-Hispanic white men and women. The Insulin Resistance and Atherosclerosis Study. Diabetes 45(11):1547–1555.
Katch, F.I., and W.D. McArdle. 1973. Prediction of body density from simple anthropometric measurements in college-age men and women. Hum. Biol. 45:445.
Khosla, T., and V.C. McBroom. 1984. Physique of Female Olympic Finalists: Standards on Age, Height, and Weight of 824 Finalists from 47 Events. Heath Park, Cardiff: Welsh National School of Medicine
Kowal, D.M. 1980. Nature and causes of injuries in women resulting from an endurance training program. Am. J. Sports Med. 8:265–269.
Kuczmarski, R.J., K.M. Flegal, S.M. Campbell, and C.L. Johnson. 1994. Increasing prevalence of overweight among U.S. adults: The National Health and Nutrition Examination Surveys, 1960 to 1991. J. Am. Med. Assoc. 272(3):205–211.
Laws, A., H.M. Hoen, J.V. Selby, M.F. Saad, S.M. Haffner, and B.V. Howard. 1997. Differences in insulin suppression of free fatty acid levels by gender and glucose tolerance status. Relation to plasma triglyceride and apolipoprotein B concentrations. Insulin Resistance Atherosclerosis Study (IRAS) Investigators. Artrioscler. Thromb. Vasc. Biol. 17(1):64–71.
Lohman, T.G. 1992. Advances in Body Composition Assessment. Champaign, Ill.: Human Kinetics Publishers, Inc.
Manson, J.E., W.C. Willett, M.J. Stampfer, G.A. Colditz, D.J. Hunter, S.E. Hankinson, C.H. Hennekens, and F.E. Speizer. 1995. Body weight and mortality among women. N. Engl. J. Med. 333:677–685.
Marchitelli, L.J., K.A. Westphal, K.E. Friedl, and M.A. Sharp. 1995. Relationship between military body fat standards, physical fitness, and cardiovascular risk factors in female soldiers [abstract]. FASEB J. 9(part II):A1013.
McArdle, W.D., F.I. Katch, and V.L. Katch. 1981. Exercise Physiology: Energy, Nutrition, and Human Performance. Philadelphia: Lea and Fibiger.
McArdle, W.D., F.I. Katch, and V.L. Katch. 1996. Exercise Physiology: Energy, Nutrition, and Human Performance, 4th ed. Philadelphia: Lea and Fibiger.
Mello, R.P., B.C. Nindl, M.A. Sharp, V.J. Rice, R.K. Bills, and J.F. Patton. 1995. Predicting lift and carry performance from muscular strength, anaerobic power, and body composition variables [abstract]. Med. Sci. Sports Exerc. 26:S152.
Metropolitan Life Insurance Company. 1983. Metropolitan Life Insurance Company: 1983 Metropolitan height and weight tables. Stat. Bull. 64: 2–9.
National Research Council. 1989. Diet and Health: Implications for Reducing Chronic Disease Risk. Committee on Diet and Health, Food and Nutrition Board, Commission on Life Sciences. Washington, D.C.: National Academy Press.
NAVADMIN (Naval Administrative Message) 071/93. 1993. See U.S. Department of the Navy, 1993.
NAVOP (Naval Operational Message) 064/90. 1990. See U.S. Department of the Navy, 1990.
Norton, K., and T. Olds, eds. 1996. Anthropometrica: A Textbook of Body Measurement for Sports and Health Courses, 1st ed. Sydney, Australia: UNSW Press.
Paffenbarger, R.S., R.T. Hyde, A.L. Wang, and C.C. Hsieh. 1986. Physical activity, all-cause mortality, and longevity of college alumni. N. Engl. J. Med. 314:605–613.
Rosenbaum, M., R.L. Leibel, and J. Hirsch. 1997. Obesity. N. Engl. J. Med. 337(6):396–407.
Seidell, J.C., P. Deurenberg, and J.G.A.J. Hautvast. 1987. Obesity and fat distribution in relation to health—current insights and recommendations. World Rev. Nutr. Diet 50:57–91.
Seidell, J.C., W.M. Verschuren, E.M. Van Leer, and D. Kromhout. 1996. Overweight, underweight, and mortality: A prospective study of 48,287 men and women. Arch. Intern. Med. 156:958–963.
Siri, W.E. 1961. Body composition from fluid space and density: Analysis of methods. Pp. 223–244 in Techniques for Measuring Body Composition, Proceedings of a Conference, Quartermaster Research and Engineering Center, Natick, Mass., January 22–23, 1959, J. Brozék and A. Henschel, eds. Washington, D.C.: National Academy of Sciences/National Research Council.
Stevens, J., M.W. Plankey, J.E. Keil, P.F. Rust, H.A. Tyroler, and C.E. Davis. 1994. Black women have smaller abdominal girths than white women of the same relative weight. J. Clin. Epidemiol. 47(5):495–499.
Stevens, J., J. Cai, E.R. Pamuk, D.F. Williamson, M.J. Thun, and J.L. Wood. 1998. The effect of age on the association between body mass index and mortality. N. Engl. J. Med. 338(1):1–7.
Thomas, K.T., C.S. Keller, and K.E. Holbert. 1997. Ethnic and age trends for body composition in women residing in the U.S. Southwest. I. Regional fat. Med Sci Sports Exerc. 29(1):82–89.
Troiano, R.P., E.A. Frongillo, J. Sobal, and D.A. Levitsky. 1996. The relationship between body weight and mortality: A quantitative analysis of combined information from existing studies. Int. J. Obes. Relat. Metab. Disord. 20:63–75.
U.S. Department of Defense, Office of the Assistant Secretary of Defense for Manpower, Reserve Affairs, and Logistics . 1981. Reserve affairs and logistics: Study of the military services physical fitness. Unpublished report. Washington, D.C.
U.S. Department of Defense. 1981. Department of Defense Directive 1308.1. "Physical Fitness and Weight Control Programs." June 29. Washington, D.C.
U.S. Department of Defense. 1995. Department of Defense Directive 1308.1. "Physical Fitness and Body fat Programs." July 20. Washington, D.C.
U.S. Department of the Army. 1986. Army Regulation 600-9. "The Army Weight Control Program." September 1. Washington, D.C.
U.S. Department of the Navy. 1990. Naval Operational Message 064/90. "Physical Readiness Program." June 22. Washington, D.C.
U.S. Department of the Navy. 1993. Naval Administrative Message 071/93. "Physical Readiness Program Changes." April 29. Washington, D.C.
U.S. Department of the Navy, U.S. Coast Guard Headquarters. 1994. Commandant Instruction M1020.8C. "Allowable Weight Standards for the Health and Well-Being of Coast Guard Military Personnel." Washington, D.C.
USDA (U.S. Department of Agriculture)/DHHS (U.S. Department of Health and Human Services). 1995. Nutrition and Your Health: Dietary Guidelines for Americans, 4th ed. Washington, D.C.: Government Printing Office.
Van Itallie, T. 1985. Health implications of overweight and obesity in the United States. Ann. Intern. Med. 103:983–988.
Vogel, J.A., and K.E. Friedl. 1992a. Body fat assessment in women. Special considerations. Sports Med. 13:245–269.
Vogel, J.A., and K.E. Friedl. 1992b. Army data: Body composition and physical capacity. Pp. 89–103 in Body Composition and Physical Performance, Applications for the Military Services, B.M. Marriott and J. Grumstrup-Scott, eds. Committee on Military Nutrition Research, Food and Nutrition Board, Institute of Medicine. Washington, D.C.: National Academy Press.
Vogel, J.A., J.W. Kirkpatrick, P.I. Fitzgerald, J.A. Hodgdon, and E.A. Harman. 1988. Derivation of anthropometry based body fat equations for the Army's weight control program. Technical report no. T17-88. Natick, Mass.: U.S. Army Research Institute of Environmental Medicine.
Wang, Z.M., R.J. Pierson, and S.B. Heymsfield. 1992. The five level model: A new approach to organizing body composition research. Am. J. Clin. Nutr. 56:19–28.
Wang, Z.M., M. Visser, R. Ma, R.N. Baumgartner, D. Kotler, D. Gallagher, and S.B. Heymsfield. 1996. Skeletal muscle mass: Evaluation of neutron activation and dual-energy x-ray absorptiometry methods. J. Appl. Physiol. 80:824–831.
Westphal, K.A., K.E. Friedl, M.A. Sharp, N. King, T.R. Kramer, K.L. Reynolds and L.J. Marchitelli. 1995. Health, performance, and nutritional status of U.S. Army women during basic combat training. Technical Report No. T96-2. Natick, Mass.: U.S. Army Research Institute of Environmental Medicine.
Williams, P.T. 1997. Evidence for the incompatibility of age-neutral overweight and age-neutral physical activity standards from runners. Am. J. Clin. Nutr. 65:1391–1396.
Williamson, D.F. 1993. Descriptive epidemiology of body weight and weight change in U.S. adults. Ann. Int. Med. 119:646–649.
Wing, R.R., R.W. Jeffery, L.R. Burton, C. Thorson, L.H. Kuller, and A.R. Folsom. 1992. Change in waist-hip ratio with weight loss and its association with change in cardiovascular risk factors. Am. J. Clin. Nutr. 55:1086–1092.
Withers, R.T., J. Laforgia, S.B. Heymsfield, Z.M. Wang, and R. Pillans. In press. Two, three and four-compartment chemical models of body composition analysis . Anthropometrica
Wood, R.J. 1996. Calcium needs of premenopausal women. Presentation at the workshop on Assessing Readiness in Military Women: The Relationship to Nutrition. September 9–10, Irvine, Calif.
Wright, H.F, C.O. Dotson, and P.O. Davis. 1980. An investigation of assessment techniques for body composition of women Marines. U.S. Navy Med. 71:15–26.
Wright, H.F., C.O. Dotson, and P.O. Davis. 1981. Simple technique for measurement of percent body fat in man. U.S. Navy Medicine 72:23–27.
Yanovski, J.A., S.Z. Yanovski, K.M. Filmer, V.S. Hubbard, N. Avila, B. Lewis, J.C. Reynolds, and M. Flood. 1996. Differences in body composition of black and white girls. Am. J. Clin. Nutr. 64(6):833–839.
Zillikens, M.C., and J.M. Conway. 1990. Anthropometry in blacks. The applicability of generalized equations and differences in fat patterning between blacks and Caucasians. Am. J. Clin. Nutr. 52:45–51.


