
3
Physical Fitness Policies and Programs
The Department of Defense (DoD) considers physical fitness an important component of the ''general health and well-being" and readiness of military troops (DoDD 1308.1, 1981) and defines physical fitness as including cardiorespiratory endurance, muscular strength and endurance, and whole-body flexibility, as well as balance, agility, and explosive power. Annual assessment of these parameters is mandated in DoD Directive 1308.1; remedial (run/walk) programs are provided for those who fail the physical fitness or readiness test (PFT or PRT). However, due to limited training hours, the DoD does not require (but does allow) ongoing physical training during duty hours. The specifics of requirements and testing are left to the individual services, based on their needs and mission. The purpose for instituting this requirement for physical fitness was to ensure an optimum body composition (within body fat standards) and appearance for all military personnel.
At present, a dilemma exists within the military. Optimum physical fitness for readiness, and for performance of the more strenuous job classifications that have been opened to women, requires maintenance of significant strength, endurance, and muscle mass; optimum appearance may require a low body weight, with an associated low fat mass, which may be accompanied by diminished muscle mass. Thus, "readiness" and appearance may not go together or may even be incompatible in some instances.
It has become necessary to evaluate the relative importance of the two reasons for the physical fitness standards in the military, that is, fitness and appearance. Body composition standards
are discussed in Chapter 2. This chapter seeks to investigate the elements of physical fitness and their relationship to health, readiness, and body composition; to explore the present programs and policies in the military and other uniformed (law enforcement and firefighting) service organizations; and to make recommendations for future programs and assessments.
Definition Of Fitness
In 1994, Bouchard and Shepard proposed a model describing the relationships among physical activity, fitness, and health for the International Consensus Conference on Physical Activity, Fitness, and Health. They defined fitness as "matching of the individual to his or her physical and social environment" (p. 81) (see Figure 3-1) and pointed out that the two goals of fitness were performance and health. Performance-related fitness was proposed to include motor skills; cardiorespiratory power and capacity; muscular power, strength, and endurance; body size; body composition; motivation; nutritional status; and genetics. Health-related fitness was defined as having "an ability to perform daily activities with vigor" (p. 81) and a low risk of developing degenerative diseases. The components of health-related fitness include body composition, strength and endurance, cardiovascular and respiratory function, and intracellular metabolism. Clearly, these two goals of fitness lie on a continuum.
Thus, the issue of physical fitness requirements in the military (or the general population) is twofold. A basic level of physical fitness is required for overall health in all individuals (ACSM, 1990; DHHS, 1991, 1996; International Proceedings and Consensus Statement, 1994; NIH, 1995), and there is a level of fitness required for the optimum performance of one's chosen lifestyle, including occupation and recreational activities.
The civilian literature provides a large body of information supporting the importance of physical activity in overall health and contains a variety of recommendations for amount and quality of exercise required to achieve health and performance-related fitness.
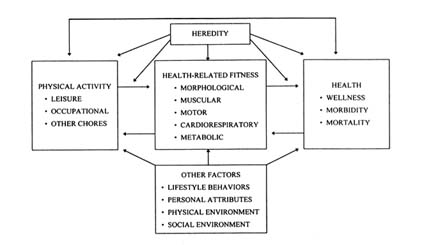
FIGURE 3-1 Relationships among habitual physical activity, health-related fitness, and health status. SOURCE: Reprinted by permission from C. Bouchard and R. J. Shephard (1994), "Physical activity, fitness, and health: The model and key concepts" in Physical Activity, Fitness, and Health: International Proceedings and Consensus Statement, edited by C. Bouchard, R. J. Shephard, and T. Stephens (Champaign, Ill.: Human Kinetics), 78.
The American College of Sports Medicine (ACSM) has maintained a position stand since 1978 ("Recommended Quantity and Quality of Exercise for Developing and Maintaining Fitness in Healthy Adults") outlining the amount of exercise shown in an extensive body of literature to be optimum for achieving and maintaining physical fitness in the general population. They differentiate between the amount of exercise needed for general health and the amount needed for improvement in fitness level, as defined by an improvement in maximum oxygen consumption (VO2max). In the updated position stand (1990), ACSM recommended the frequency (3–5 times/wk), intensity (60–90% of maximum heart rate), duration (20–60 minutes of continuous aerobic activity depending on intensity), and mode (activity using large muscle groups that can be maintained continuously) of the exercise required for development and maintenance of a level of physical fitness similar to that required by all military troops for readiness. In this version of the position stand, resistance exercise is an added recommendation—conditioning of the major muscle groups at least 2 d/wk to ensure sufficient strength to perform normal activities of daily living, maintain fat-free mass (FFM), and control body weight.
In 1991, the U.S. Department of Health and Human Services published Healthy People 2000 (DHHS, 1991), in which it indicated one of its goals to be an increase in the activity level of the general population to improve health (Items 1.1 to 1.14). In 1995, the National Institutes of Health convened a consensus conference on physical activity and cardiovascular health at which the participants agreed that a minimum of 30 minutes each day of moderate physical activity (defined as brisk walking) would improve health, and that for most individuals, more exercise of greater intensity would further improve health. This group also agreed that resistance exercise should be incorporated into an ongoing exercise program at least 2 days each week.
In 1996, the U.S. surgeon general (DHHS, 1996) issued a report, Physical Activity and Health, outlining and evaluating the literature available, which supports exercise as an important part of an overall program of health, and recommending a minimum of 150 kcal/d of strenuous exercise to protect against the risk of heart disease, colon cancer, hypertension, and diabetes.
Clearly, some disagreement exists among these groups of individuals as to the amount of physical activity required for health. There is a consensus, however, that regular physical activity is part of a healthy lifestyle that is compatible with readiness, and that daily physical activity generally increases health and fitness. Extrapolation to the military situation suggests that a consistently ready, fit, and healthy force is one that routinely engages in at least the level of exercise recommended by the ACSM. In addition, however, military personnel must be ready to perform the maximum requirements of their job specialties at any moment.
Much evidence in the civilian literature supports the need for job-related training. Individuals who routinely practice the highest demand activities of their job description experience fewer injuries during performance of those activities while on duty (Jackson, 1994). Failure to maintain training level results in a very rapid decline in physiological function. Detraining of strength manifests in a decrease in muscle mass in as little as 1 week (Brooks et al., 1996), and endurance capacity can diminish in 2 weeks (Coyle et al., 1984) or less (Hickson et al., 1985). Firefighters, who achieve competence in specific job capabilities during training, have been shown to lose those competencies when they rely on customary day-to-day job activities (Ellam et al., 1994). Studies in both military and civilian sectors show that individuals participating in a routine strenuous activity program experience fewer stress fractures. Thus, to provide for a military
force ready for deployment at a moment's notice, job-specific physical fitness training must be ongoing.
Summary
Fitness, which has been defined as the matching of an individual to his physical and social environment, has two goals: health and performance. Physical fitness requirements in the military consist of a basic level of overall fitness required for the health of all individuals and a higher level of fitness that is required for the performance of occupational activities. A number of government and civilian organizations have proposed levels of physical activity that they believe are required for health maintenance. Although there is disagreement among these groups regarding the exact amounts required, there is consensus on the need for daily physical activity, both endurance and resistance, in a healthy lifestyle. In addition to this, the military must address the need for ongoing, job-specific performance training.
Current Military Physical Fitness Standards, Testing, And Programs
Health-Related Fitness
Evaluating an individual's physical fitness determines his or her appropriateness for military service both at the time of accession (enlistment) and for purposes of retention. Current military fitness tests are a result of work initiated in response to a DoD symposium conducted in 1981 to review the assessment of military physical fitness as a part of readiness. That symposium indicated the following: (1) services could not provide an accurate assessment of the physical fitness of their personnel; (2) services did not provide total physical fitness programs to personnel of all ages and in all military occupations; (3) leadership and expertise in physical fitness were lacking; and (4) current civilian knowledge was not being incorporated into fitness training (DoD, 1981). As a result of this symposium, DoD Directive 1308.1 (1981) was issued (as described on the first page of this chapter); the report also resulted in the formation of a task force and establishment of the Army Physical Fitness School.
Physical fitness testing at the time of an individual's enlistment varies among the services. The Air Force administers a strength test, the incremental dynamic lift test,1 at the time of enlistment for determination of job qualification. As will be discussed later, this test was also used at one time by the Army, but it has since been discontinued. Neither the Navy nor the Marine Corps performs a similar assessment of physical fitness at enlistment beyond the height/weight and body composition assessments. By the end of basic combat training (BCT), all active-duty personnel are expected to pass the physical fitness test for their branch of service.
The DoD-mandated physical fitness evaluation for retention also varies among the services (Table 3-1 and Appendix B). The exam for most services includes an evaluation of both cardiorespiratory endurance (1.5- to 3-mi run, cycle ergometer test, or 500-yd swim) and strength (push-ups, pull-ups, sit-ups); as shown in Table 3-1, adjustment of scores for gender or age is not uniform across the services. The Air Force testing differs markedly from the other services in that it requires only a submaximal cycle ergometry test as a determination of aerobic capacity. Passing scores are age adjusted, and lower passing values for women reflect the data showing that VO2max in women is about 10 ml/kg lower than in men for the same body size (McArdle et al., 1996). The validity of this method has been put in question by some studies (Pollock et al., 1994; Williford et al., 1994), which show that the equations used to predict VO2max from submaximal performance underpredict values for men by as much as one fitness level, thus resulting in failure of some aerobically fit individuals to meet the standard.
The frequency of fitness testing varies by service and to some extent within each service. The Army performs its PFT semiannually. A PRT is given to Navy and Marine Corps personnel one to four times a year, depending on the command. The Air Force test is conducted annually. Failure results in referral of a person to a remedial run/walk program.
Data from the military suggest that simply enforcing the PFT has not achieved an improvement in the overall fitness of military troops. In 1988, the Army Physical Fitness School was given the task of measuring the fitness of the active-duty Army. The PFT was administered at a number of Army posts within the continental United States to measure the fitness of a sample of 5,347 males and 676 females in 60 of the 277 military occupational specialties (MOSs, which are classified by strength requirement [see Table 3-2 and Appendix C]). Reasons cited for the high failure rate (Table 3-3) of younger soldiers included less motivation, less training, and deselection of the less-fit soldiers with time in the service. The study concluded that renewed emphasis on physical conditioning, especially of younger soldiers, was necessary (O'Connor et al., 1990).
In 1995, the Army Fitness School repeated the survey of Army personnel fitness (Table 3-3), using a random sample of approximately 3,000 active-duty soldiers stratified by age, gender, and MOS. An apparent gender disparity in fitness was complicated by the result that in women, performances on the 2-mi run and sit-ups reached or exceeded the maximum required for women more often than they did in men; conversely, the push-up event appeared to favor men. The report recommended that (1) effort scales be reconfigured to be equal for both genders, (2) passing scores be relaxed except for those in the two youngest age groups (17–21 and 22–27), (3) minimum aerobic capacity standards be set at the same rating for men and women, and (4) older age groups be established (Tomasi et al., 1995). In response to the results of this survey and its recommendations as well as other information, a proposal is under consideration by the U.S. Army Chief of Staff to modify the requirements for passing the Army PFT. If the modification is approved, the number of push-ups that both men and women will be required to perform will be increased by a small number; women will be required to perform the same number of sit-ups as men; and the time allowance for the 2-mi run will be decreased (to increase stringency) for both women and men (Personal communication, L. F. Tomasi, Fort Benning, Ga., 1997). A decision is expected during the 1998 fiscal year.
TABLE 3-1 Variables or Standards Used by the U.S. Military Services for Assessing Fitness of Personnel
|
Variable or Standard |
DoD Directive/Instruction |
Army |
Navy |
Air Force |
Marine Corps |
Coast Guard |
|
Frequency of Fitness Assessment |
Formally evaluated and tested at least annually |
Semiannual |
Semiannual PRT optional for members > 50 years (NAVOP 064/90, 1990) |
Annual |
Semiannual |
At least annual and upon random urinalysis testing |
|
Fitness Test |
Annual |
Adjusted for age and gender (AR 350-41, 1993) |
Sit-reach Curl-ups × 2 min Push-ups × 2 min 1.5-mi run/walk or 500-yd swim (age and gender adjusted) |
Submaximal cycle ergometer test, percent of standard based on VO2max, age and gender specific (AFI 40-501, 1996) |
Men: 3-mi run Curl-ups Push-ups Pull-ups × 2 min |
None |
|
|
Adjusted for age and gender |
2-mi run; Sit-ups × 2 min*; Push-ups × 2 min |
+ BF standards (OPNAVINST 6110.1D, 1990) |
|
Women: 1.5-mi run Curl-ups Push-ups Bent-arm hang × 2 min |
|
|
|
Cardiovascular and muscular endurance |
|
|
|
|
|
|
|
(DoDI 1308.3, 1995) |
|
|
|
|
|
|
Duty Time for Physical Fitness |
May authorize 1 1/2 hrs, 3×/wk |
Authorize duty time |
Commanding officer's discretion |
Commanding officer's discretion |
Part of weekly training day |
Commanding officer's discretion |
|
NOTE: DoD, Department of Defense; PRT, physical readiness test; NAVOP, Naval Operational Message; DoDI, Department of Defense Instruction; AR, Army Regulation; BF, body fat; OPNAVINST, Naval Operations Instruction; AFI, Air Force Instruction. A more detailed table appears in Appendix B. * Number of sit-ups performed in 2 minutes. |
||||||
TABLE 3-2 Summary of Job Classification Strength Requirements for Enlisted Women in the U.S. Military Services as of September 1996
|
|
Branch of Service |
|
|
|
Strength Requirement |
Army |
Navy |
Air Force |
|
Very heavy* |
|
|
|
|
Percent OCC classifications in this strength category |
41.4% |
23.9% |
5.7% |
|
Total number of women in this strength category |
17,617 |
3,889 |
226 |
|
Percent women in this strength category |
32.7% |
11.3% |
<1.0% |
|
Heavy† |
|
|
|
|
Percent OCC classifications in this strength category |
14.8% |
20.9% |
NA |
|
Total number of women in this strength category |
9,269 |
6,157 |
NA |
|
Percent women in this strength category |
17.2% |
17.8% |
NA |
|
Moderate‡ |
|
|
|
|
Percent OCC classifications in this strength category |
22.2% |
9.0% |
11.4% |
|
Total number of women in this strength category |
15,535 |
7,207 |
4,404 |
|
Percent women in this strength category |
28.9% |
20.9% |
8.6% |
|
Medium§ |
|
|
|
|
Percent OCC classifications in this strength category |
16% |
4.5% |
27.8% |
|
Total number of women in this strength category |
9,619 |
2,053 |
13,593 |
|
Percent women in this strength category |
17.9% |
5.95% |
26.5% |
|
Light |
|
|
|
|
Percent OCC classifications in this strength category |
56.0% |
41.7% |
55.1% |
|
Total number of women in this strength category |
1,780 |
15,178 |
32,997 |
|
Percent women in this strength category |
3.3% |
44.0% |
64.4% |
|
Total enlisted women with assigned MOSs |
53,820 |
34,484 |
51,220 |
|
NOTE: More detailed tables appear in Appendix C. For Marines and Coast Guard, job classifications are not subject to strength testing; therefore, strength level categories cannot be assigned. As female military personnel are not permitted to serve in designated combat or combat-related assignments, these military occupational specialties have not been included in this table. OCC, occupational classification; MOS, military occupational specialty. * Army defines very heavy strength requirement as ability to lift on occasional basis over 100 lb (45 kg) with frequent or constant lifting in excess of 50 lb (23 kg). Corresponds to Navy's high/high and Air Force's high strength requirements. † Army defines heavy strength requirement as ability to lift on occasional basis a maximum of 100 lb (45 kg) with frequent or constant lifting of 50 lb (23 kg). Corresponds to Navy's high/moderate strength requirements. ‡ Army defines moderate heavy strength requirement as ability to lift on occasional basis a maximum of 80 lb (36 kg) with frequent or constant lifting of 40 lb (18 kg). Corresponds to Navy moderate/moderate strength requirements. § Army defines medium strength requirement as ability to lift on defines medium strength requirement as ability to lift on occasional basis a maximum of 50 lb (23 kg) with frequent or constant lifting in excess of 25 lb (11 kg). Corresponds to Navy's moderate/low and Air Force's moderate requirements. Army defines light strength requirement as ability to lift on occasional basis a maximum of 20 lb (9 kg) with frequent or constant lifting of 10 lb (5 kg). Corresponds to Navy's low/moderate and low/low and Air Force's low requirements. SOURCE: Army: Adapted from Sharp et al. (1980) and MAJ Kurt Berry (U.S. Total Army Personnel Command, Alexandria, Va.); Navy: Adapted from DoD 132.1-1 (1995) by LT Leslie Cox (Bureau of Naval Personnel [BUPERS], Washington, D.C.) and Ross Vickers (Naval Health Research Center, San Diego, Calif.). Air Force: Adapted from Air Force Specialty Code, including Air Force Manual 36-2108 (1994), attachment 39, by MAJ Joanne M. Spahn (Nutritional Medicine Service, 3rd Medical Group/SGSD, Elmendorf AFB, Alaska). |
|||
TABLE 3-3 Failure Rate of Army Personnel on Physical Performance Tests
|
|
Study Date 1988* |
Study Date 1995† |
||
|
|
Age (years) |
Failure (%) |
Age (years) |
Failure (%) |
|
Males |
18–21 |
29 |
All ages |
11.4 |
|
|
22–31 |
17 |
17–26 |
26.8 |
|
|
32–51 |
11 |
> 27 |
7.4 |
|
|
>52 |
17 |
|
|
|
Females |
18–21 |
36 |
All ages |
13.4 |
|
|
22–26 |
18 |
17–26 |
32 |
|
|
>26 |
10 |
> 27 |
9.1 |
|
* N = 5,347 males; 676 females. †N = 3,000. SOURCE: Adapted from O'Connor et al. (1990) and Tomasi et al. (1995). |
||||
it is widely acknowledged that the periodic military fitness tests establish a minimum level of fitness (the Army PFT was based on an arbitrary, perceived level of fitness needed for Army task performance [Vogel, 1992]). Nevertheless, the results of the study by Tomasi and coworkers (1995) suggest that even this level of fitness is not achieved by a significant number of Army personnel. Although a comparable recent survey of Navy personnel was not identified, it is known that in fiscal year 1996, 658 enlisted personnel and 24 officers were separated from Navy service for failure to pass the physical fitness portion of the Navy PRT (Personal communication, LCDR R. Hernandez, Bureau of Naval Personnel [BUPERS], Washington, D.C., 1997). A 1991 report (Destadio, 1991) suggested a similar lack of fitness among Air Force personnel throughout the 1980s.
Studies of fitness in military women are sparse. An overview of physical fitness in female cadets at the various military academies (Baldi, 1991) suggested that women entering the military academies have been increasingly fit, and that basic training can increase that fitness significantly, especially in those who were less fit at the beginning of training. Consequent to the improvement in performance by women, modifications in the physical fitness tests have been proposed by some branches of the service (Navy, Army) so that men and women will be required to perform more similarly on strength-related tests.
However, injury rate in women both in basic training and field maneuvers is greater than that in men (Jones et al., 1992; Moore, 1996). Jones and coworkers (1992) have studied injuries among men and women in Army basic training over a 10-y period, assessing the factors contributing to injury risk. They have found that women have a higher risk of all types of lower-extremity, musculoskeletal injury than men, including stress fracture of the tibia. This increased risk was associated with higher or lower than average body mass index (BMI), but there was no relationship between injury risk and body fat in women. Previous exercise experience or aerobic
fitness (Jones et al., 1993) was found to be an important factor in injury risk in women. Other studies of stress fractures in women suggest that adequacy of energy intake may also be a factor in predicting injury risk (Marcus et al., 1985).
Ongoing Physical Fitness Training in the Military
As emphasized by Knapik (1996) at a symposium on physical performance in the military, the maintenance of physical fitness requires regular periods of physical training of sufficient frequency, duration, and intensity. The DoD supports ongoing physical training as a means of passing the PFT/PRT (DoDD 1308.1, 1981). At present, each service interprets this policy independently (see Table 3-1). Only the Army and Marine Corps have policies that includes fitness training as part of duty time; the other services leave authorization of physical fitness training during duty time to the commanding officer of each facility, and thus implementation is intermittent.
Army Regulation 350-41 (1993) mandates vigorous physical activity three to five times per week during normal duty hours, and the Army has established the U.S. Army Physical Fitness School at Fort Benning, Georgia (formerly at Fort Benjamin Harrison, Indiana), which trains 2,000 to 3,000 master fitness trainers each year to work with troops to develop ongoing fitness programs and perform the fitness testing. The Air Force has mandated that health and wellness centers be established on all Air Force bases (Friedman, 1996), with the mission of providing a center for exercise and diet programs and employing qualified personnel to conduct the programs and fitness tests. As of 1996, 22 such centers had been established, with a final goal of 77. The Navy has a Health and Physical Readiness Program, although no specific fitness training is provided. Within this service at least, performance of individuals on the Navy PRT has been traced directly to the perceived attitude of the commander (Bourne et al., 1994).
Few systematically collected data are available regarding the numbers of military facilities or commands that provide duty time for physical activity or conduct organized physical activity programs; however, a number of active-duty women who were interviewed acknowledged that the amount of time allowed for physical activity during the duty day varied considerably from one worksite to another and that many, especially those working in health care, were given no time for regular physical activity (Friedman, 1996; Hernandez, 1996; King, 1996). Two self-report surveys of military personnel (Bray et al., 1995; Hourani, 1996) have found that approximately 60 percent of active-duty women report exercising vigorously for 20 or more minutes, 3 or more days per week. Anecdotal reports suggest that many service personnel increase their activity level within a month of their fitness evaluations to ensure retention and then decrease their activity for the subsequent months, which results in a varied fitness (and potentially body weight, health, and readiness) level across the year. No data were available regarding the methods that active-duty women employ to maintain fitness.
Occupation-Related Fitness
Each branch of the military service performs specific and specialized functions in promoting peace and protecting the populace in war. In response to the increasing entry of women into the Armed Forces during the late 1970s, the Government Accounting Office (GAO) in 1976 recommended that the DoD develop physical standards for job performance based on the Department of Labor system of classification. Consequently, each service defined its critical occupational specialties according to a variety of criteria, including upper body strength (light = occasionally lift 20 lb [9 kg], frequently lift 10 lb [5 kg]; medium = occasionally lift 50 lb [23 kg], frequently lift 25 lb [11 kg]; moderately heavy = occasionally lift 80 lb [36 kg], frequently lift 40 lb [18 kg]; heavy = occasionally lift 100 lb [45 kg], frequently lift 50 lb [23 kg]; and very heavy = occasionally lift 100 lb [45 kg], frequently lift in excess of 50 lb [23 kg]; see Table 3-2) and the physical profile serial designated as P-U-L-H-E-S (physical capacity or stamina, use of upper and lower extremities, hearing acuity, normal color vision, and special psychiatric characteristics). Acceptance into and continued participation in these occupational specialties depends on maintenance of a fitness level adequate to perform the tasks described for the MOS.
Attempts to institute job-specific performance tests in the military date back to the Army Air Corps Aviation Psychology Program during World War II (Hogan, 1991). In the 1970s, as MOSs opened to women, the U.S. Army Research Institute of Environmental Medicine (USARIEM) was tasked with developing a battery of performance tests to match the various MOSs, but these tests were never applied. In 1981, the Army Office of the Deputy Chief of Staff for Personnel formed a Women in the Army Policy Review Group, and the Exercise Physiology Division at the U.S. Army Research Institute of Environmental Medicine was again given responsibility for developing and validating a gender-neutral military entrance physical strength capacity test (MEPSCAT). The incremental dynamic lift proved to be the best predictor of performance on a series of job-related (simulated) criterion performance tasks (CPTs) and was selected for implementation pending validation studies. The study that subsequently validated the incremental dynamic lift (Myers et al., 1984) has been criticized, however, for misanalyzing the data and showing a higher correlation between incremental dynamic lift and simulated task performance on the criterion performance tasks than actually exists (GAO, 1996).
In 1993, legislation was passed that permitted women to fill all MOSs that did not involve direct combat and opened many more billets to women. The number of women in each service currently participating in each MOS category is listed in Table 3-2. As a result of this legislation, the GAO was asked to re-examine the question of job-specific performance testing. Each branch of the military performs fitness testing independently, and the Air Force is the only branch that requires new recruits to take a strength test for MOS assignment (the incremental dynamic lift). Although few data have been collected by any of the branches regarding assessment of task performance capability, since 1989 the Army has collected such data for a select number of MOSs. These data show that fewer than 15 percent of women in heavy-lifting MOSs were strength-qualified for their jobs by the end of advanced individual training. This suggests either that they would be unable to perform parts of their jobs, that the jobs were misclassified, or that task adaptation would prevent their inability to lift the required weight from interfering with their performance (Teves et al., 1985). Few Army personnel reveal trouble completing their tasks. In
contrast, a 1994–1995 self-report survey conducted by the U.S. Army Research Institute (ARI) revealed that 21 to 49 percent of personnel reported difficulty at some time in completing physically demanding tasks, although often this difficulty was handled by working around problems and reassigning tasks. The GAO recommended that the services assess whether a significant problem exists in physically demanding occupations and identify solutions. Recommended solutions included establishing valid performance standards to increase job sustainment, utilization of personnel, and safety; providing additional job training; and redesigning tasks (GAO, 1996).
From 1972 to 1980, the Canadian Forces employed a fitness testing procedure that consisted of a 1.5-mi run, with scoring based on the (Cooper) Institute of Aerobic Fitness program. Because of the morbidity and mortality risk associated with attempting to pass the test after inadequate training, a new testing strategy was sought. The program that was developed subsequently, the Canadian Forces Exercise Prescription test (ExPres), includes a preliminary health screen; an evaluation of aerobic and muscular strength and endurance that is based on the Canadian Standardized Test of Fitness (including a submaximal step test, sit-ups, push-ups, and bilateral test of grip strength); an individually tailored rehabilitative exercise program (prescription) based on the results of the evaluation; and ongoing training (Lee et al., 1990). To establish Minimal Physical Fitness Standards that complied with Canadian Human Rights Commission legislation (which mandates that performance standards must be demonstrably related to the requirements of the job), the ExPres test was validated against a battery of five tasks representing various jobs a typical military person would be expected to perform (Stevenson et al., 1992, 1994). While the ExPres is considered a reasonable measure of general physical ability, it is not considered an adequate assessment of task-specific performance, particularly for the infantry and others with occupations that demand high strength; thus, there has been ongoing effort to develop gender-neutral, task-specific performance tests and standards that can be administered with a minimum of equipment and in minimal time (Chahal et al., 1992). This effort has been further intensified as a result of the abolition, in 1992, of body fat standards for Canadian Forces on the grounds that an insufficient relationship could be demonstrated between body fat and physical performance (Personal communication, S. W. Lee, Ottawa, Canada, 1997). A Battle Efficiency Test, now in use for testing of Canadian Army infantry personnel, has been criticized for its failure to measure all necessary components of fitness and for its time-consuming nature (Lee et al., 1995). An indoor standardized obstacle course has been developed but awaits validation (Jette et al., 1990a). In addition, a physical fitness standards study has identified a series of tasks as being representative of the physical requirements of the average Canadian Forces soldier. These tasks include trench-digging, marching, casualty evacuation, and manual material handling (Lee et al., 1995). Additional job-specific fitness maintenance and/or testing programs have been developed for Canadian Forces firefighters and pilots.
The primary objections that have been raised to MOS-specific performance tests are: the large number of tests the military would be required to devise and administer, the frequency with which people are assigned to new MOSs and/or promoted, and the lack of task specificity for any one MOS. Although the Canadian studies sought to develop one test of strength, endurance, and aerobic fitness that would be generalizable to all job requirements, no data were available on the implementation of this test.
Summary
The DoD mandates that all services evaluate the basic physical fitness of their personnel at least yearly. Each service administers its own test; while the Air Force test measures only cardiorespiratory endurance, the others attempt to measure strength and flexibility as well. Studies show that a high percentage of female personnel, particularly those in the youngest age groups, fail the Army physical fitness test. Comparable data were not available for the other services. Although the DoD authorizes provision of duty time for physical activity, only the Army and Marine Corps explicitly provide this time. However, anecdotal evidence suggests that compliance is dependent on the individual command. Few data are available on the fitness habits of active-duty personnel; self-report data show that approximately 60 percent of active-duty women exercise regularly.
The 277 MOSs are classified into five categories based on requirements for lifting strength. At the present time, a test of physical performance ability/strength is conducted on a regular basis only by the Air Force, which uses the incremental dynamic lift test. In response to concerns that a significant percentage of personnel (and a disproportionate number of women) were unable to accomplish their assigned tasks, the GAO performed an analysis and issued a report in 1996 recommending the institution of task-specific performance tests throughout the military as well as reconsideration of the validity and reliability of the incremental dynamic lift test. Also recommended were job redesign and additional strength training. The primary objection to task-specific physical performance tests has been the potentially large number of tests that would be required and the frequency with which personnel change MOSs.
Civilian Performance Testing
Evaluation of prospective or current employees for jobs that require high levels of fitness (endurance, strength, and aerobic capacity) is more completely developed in the civilian sector. In the United States, task analysis and classification of civilian jobs by physical ability dates back to efforts by the Army Air Corps during World War II (Hogan, 1991) to place qualified soldiers into military specialties. Recent increases in the use of physical abilities' testing is believed to result from the influx of women into the workplace, from passage of the Americans with Disabilities Act, and from evidence that lack of physical fitness for a physically demanding job is associated with increased rates of on-the-job injuries (Jackson, 1994).
Theoretical Issues
The development of fitness/performance standards and tests is a two-step process. The first step requires analysis of the tasks of a particular job and the physical requirements required to perform those tasks, with subsequent formulation of a set of performance test items that mimic the individual tasks. The second step requires validating the test by multiple criteria (Hogan, 1991). The legitimacy of pre-employment hiring tests for physically demanding jobs has been upheld in the court system. Validating such tests is imperative, however, because of the potential
impact of physical performance testing on women in the workforce and the possibility that a test will be challenged for failure to comply with the Uniform Guidelines on Employee Selection Procedures of the Equal Employment Opportunity Commission. Appropriate validation methodology has been the subject of ongoing debate (Jackson, 1994).
Civilian performance testing is classified into two types by the nature of the abilities measured. Physical fitness tests seek to measure performance on one or a series of tasks that have shown some ability to predict general aerobic fitness or strength. Physical abilities tests (also known as job sample tests or task performance tests) seek to measure performance on tasks that simulate actual job-related activities. Performance tests may be administered as a part of a recruitment qualification test only, or they may be administered regularly to current employees. For such tests to be valid, the abilities measured must be demonstrated to be necessary to (and predictive of) the performance of the actual job (Arvey et al., 1992; Hogan, 1991). An additional concern is that when physical abilities tests are administered as qualification (entrance) exams, performance may be more reflective of prior learning than of aptitude. Thus, the population of subjects used to establish cut-off scores must be identified.
Although most performance test validation studies are not published, those that are have been primarily in the areas of firefighting, police work, chemical and steel plant work, coal mining, utility line work, and military jobs (Jackson, 1994). This discussion will focus only on the civilian uniformed services, that is, government law enforcement and firefighting.
Police Force Physical Tests
A preemployment test for police officers (Wilmore and Davis, 1979) measured both fitness and physical abilities, but test performance proved unrelated to actual supervisor-rated job performance (criterion validity). The Metropolitan Ontario Police Department developed a jobspecific Police Officers' Physical Abilities Test (POPAT) to screen new recruits (Rhodes and Farenholtz, 1992). Although task performance correlated poorly with fitness test performance, established officers who scored poorly on the Police Officers' Physical Abilities Test also scored poorly on routine tests of fitness, and the test has been demonstrated to have content validity and accepted for screening of new recruits.
A group of municipal, state, and federal law enforcement agencies (compiled from a list of forces represented at a December 1996 symposium on Women in Uniform, forces listed on the Internet, and those in the Washington, D.C. area) were contacted and questioned regarding their body composition, fitness, and performance testing practices (see Appendix E for inquiry letter and response tables). The results (Table E-1) demonstrate that approximately half of these agencies regularly assess body composition, while the majority assess fitness on a regular basis.
Firefighting Services
According to a report cited by Jackson (1994), most major fire departments administer physical ability tests for recruitment (a large percentage of fire departments are small, comprise volunteers, and may not conduct such testing). Several physical abilities test batteries for firefighters
have been constructed from task analyses and have been validated and published. Considine and coworkers (1976) published a test panel consisting of fitness and body composition assessments as well as a series of four work-sample tests. The test panel was found to measure the ability to handle body weight, muscle power, and body structure.
A second test, also consisting of fitness and body composition measures as well as work-sample tests, was validated by Davis and coworkers (1982) who found that two independent factors, physical work capacity and a combination of speed and resistance to fatigue, defined the relationship between performance on the fitness tests and performance on the work-sample tests.
More recently, physiological response to firefighting tasks has been measured and used to validate fitness and performance screening protocols against actual firefighting operations. One example is a fitness test and seven-item task performance battery developed by Gledhill and Jamnik (1992) that assesses air utilization during performance of some tasks.
In 1995, the National Fire Protection Association issued a draft entitled ''Recommended Practice for Physical Performance and Conditioning Programs" for the comment and approval of its members and other fire service representatives. This set of guidelines for fitness and performance testing and maintenance recommends both physical fitness assessment and performance assessment. According to the document, physical fitness assessment should test aerobic capacity, flexibility, body composition, muscular strength, muscular endurance, and anaerobic power, and results should be used to assign personnel to health-risk intervention programs. Physical performance assessment tasks, according to the document, should be objective, reliable, and valid, and the recommended tasks are defined with extreme specificity. This specificity has been criticized on the grounds that all test tasks are not valid measures of the job of a given firefighter or service (Personal communication, D. Smith, Pike Township, Indiana, 1997). Finally, the document recommends annual testing of candidates as well as current firefighters and recommends at least 3 d/wk of physical conditioning.
As with the police services, municipal and county firefighting services were polled regarding their body composition, fitness, and performance testing policies. Female firefighters comprised 5 to 11 percent of total personnel among the services surveyed (an estimated 4,500–5,000 women are nonvolunteer firefighters nationwide). Results of the survey of fitness assessment policies are shown in Table E-1.
In contrast to the law enforcement groups polled, all firefighting services regularly assessed fitness and body composition. A variety of approaches were used to assess overall fitness and specific task performance. One approach repeatedly described was the inclusion of body composition assessment as one component (criterion) of a composite fitness score.
Summary
The majority of firefighting services and some police forces place major emphasis on fitness and performance testing for recruitment and retention of fit, qualified employees. When body composition was measured, it was most often regarded as one component of fitness or as secondary to fitness and performance in the evaluation of an incumbent employee. The use of performance or physical abilities tests by firefighting services appears to be increasing in prevalence;
physiologists who develop such tests place strong emphasis on the proper validation of the tests.
Body Composition, Fitness, And Task Performance
Body Composition and Fitness
Body Fat and Performance
In a 1992 review in Armed Forces and Society, Vogel described how the Army's initial (1982) male body fat standards of 20 percent were formulated, based on a subjective estimate of the level of body fat commensurate with a desirable level of aerobic fitness. Preliminary data (Vogel and Friedl, 1992) showed a negative association between body fat (as determined by the Army equation) and 2-mi run time for the youngest age group of men. Another study of Army personnel found virtually no relationship between body fat and run time of men or women (Harman and Frykman, 1992). Cureton (1992) employed an "added weight" model to attempt to determine whether women's additional body fat was responsible for their lower aerobic fitness. In this model, weight was added to the trunkal area of male subjects, but no differences in performance were seen, possibly because no added weight was distributed to the extremities, as would be the case in women.
In a study of women during basic combat training, Westphal and coworkers (1995) examined the relationship among weight-for-height; BMI; total body fat as predicted by all services' circumference equations and dual-energy x-ray absorptiometry; body fat distribution as predicted by waist-hip ratio; performance on the Army PFT; and measures of strength and task performance (torque task performance, machine lift, bench press, military press, and vertical jump). Increasing BMI was associated with increasing performance on strength tasks, decreasing sit-up and running performance on the Army PFT, and no association with performance of push-ups (also part of the Army PFT). Waist-hip ratio greater than 0.81 (which is associated with higher FFM and greater health risks [see Chapter 2 in this report]) was associated with a significantly increased performance on a torque task, a small but not significant increase in performance on other tests of strength, poorer performance of sit-ups and push-ups, but no effect on run time. Women who exceeded their Army weight-for-height limit during BCT demonstrated greater performance on strength tasks than those who were within standard. When these same women were divided into two groups based on whether or not they exceeded their body fat limit (as assessed by the Army circumference equation for women), those who exceeded the body fat limit were stronger than those who did not, but the disparity in performance was not as great as when the division was according to weight-for-height (thus the weight-for-height screen tends to eliminate more strong women than the body fat screen). Use of the Navy and Marine Corps equations produced similar results. Performance on the Army PFT was not compared between those who exceeded their body fat limit and those who did not in this study. Nevertheless, it appears that increased BMI was associated with poorer performance on the Army PFT but greater strength, and that increased body fat was associated with greater strength.
A study by Jette and coworkers (1990b) examined the relationship between BMI and measures of fitness and strength among Canadian Forces personnel (17,098 men and 2,087 women) stratified into five BMI zones (<20, 20–25, 25–27, 27–30, and > 30). In this population, 50 percent of the men and 25 percent of the women had BMI greater than 25, while 26 percent of the men and 12 percent of the women had BMI greater than 27. The study showed that over the entire range of BMI, predicted VO2max decreased as BMI increased for both men and women. Scores on the push-up test were lower for the two highest women's BMI groups (> 27) than for the lower BMI groups, and for the sit-up test, the scores were lower for the three highest BMI groups of women (> 25). In contrast, grip strength tended to increase with BMI. Thus, except for grip strength, fitness test performance decreased with increasing BMI. In this study, BMI was significantly associated with weight-height ratio and waist-hip ratio, all predictors of fatness. Thus, according to this study, increased fatness appears to be associated with poorer performance on fitness tests.
Fat-Free Mass and Performance
The use of current military PFTs as indicators of ability to perform a job, as acknowledged by Vogel and Friedl (1992), Hodgdon (1992), Robertson and Trent (1985) and others presents a problem; it is that the majority of the military's physically demanding MOSs involve occasional to frequent lifting and carrying, also known as manual material handling. Thus the capacity to lift and carry is a significant aspect of military task performance. Although little association has been found between body fat and lifting capacity, numerous military studies have demonstrated a strong association between FFM and lifting capacity (strength) (Beckett and Hodgdon, 1987; Harman and Frykman, 1992; Vogel and Friedl, 1992). A study of recruits in BCT found that women who failed the body fat standard performed better on measures of strength than those who passed. When these same women were stratified into those who exceeded and those who passed the weight-for-height standard (Sharp et al., 1994), the difference was even more pronounced; women who failed the weight-for-height standard performed significantly better on several measures of lifting and carrying than did those who were within the standard. In the study by Westphal and coworkers (1995), increased waist-hip ratio also was found to predict significantly increased strength in a torque performance test but was not a significant factor in other strength measures. The implication of these studies is that, clearly for women, increased weight for height and waist-hip ratio are associated with higher FFM, which is associated with greater strength.
Although strength is recognized as a vital component of military performance and fitness, controversy still exists regarding how to measure this aspect of fitness in a valid way, particularly in a field situation (Vogel and Friedl, 1992). This controversy also exists for civilian tests of task performance. Sit-ups and push-ups are used to measure strength on the Army PFT. Although Army PFT scores for push-ups and sit-ups correlated well with strength and load carriage performance in the study of Westphal et al. (1995), none of the Army PFT tasks correlated well with the power or muscle strength tasks. Westphal and coworkers (1995) and other military researchers (for example, Harman and Frykman, 1992; Sharp et al., 1994) have recommended the use of
job-specific task performance tests for occupational assignment. Vogel and Friedl (1992) have suggested the use of a minimum acceptable FFM standard that would be compatible with the ability to perform the tasks required for many MOSs, in lieu of other standards of body composition.
Musculoskeletal Injury and Fitness
Studies of the role of fitness in job performance cite the contribution of poor physical fitness to an increased incidence of job-related injury and disability. Numerous reports have found that women in Army BCT appear to sustain more musculoskeletal injuries of the lower extremities than do men (Canham et al., 1996; Jones, 1996; Jones et al., 1992, 1993, 1994). Similar observations have been made regarding injuries of the lower extremities and pelvis in Marine Corps personnel (Moore, 1996). Jones and coworkers (Canham et al., 1996; Jones, 1996; Jones et al., 1992, 1993, 1994) have studied men and women in Army BCT for approximately 10 years to assess the factors contributing to injury risk. They found that women tend to have a higher risk of all types of lower-extremity, musculoskeletal injury than do men, including stress fracture of the tibia. Both higher- and lower-than-average BMIs are associated with increased risk for injury, which suggests that the heaviest as well as the lightest soldiers are at greater risk. When men and women of equal fitness level (as measured by run time) are compared, however, the gender differences in injury rate disappear, which suggests that aerobic fitness could be an important factor. Fitness prior to entering BCT is also a factor in injury incidence. Although more studies are needed, particularly those including soldiers after initial training and examining other lifestyle issues (such as diet and smoking), the evidence suggests that fitness plays a role in preventing musculoskeletal injuries in military personnel and that there may be some justification for a minimum FFM standard.
Strategies to Improve Performance on Physically Demanding Military Tasks
The establishment of MOS-specific fitness standards and corresponding physical abilities tests is only one means of ensuring that military personnel are qualified to perform their jobs. Two additional strategies that are under investigation are the optimization of strength training to allow women to reach their full potential and the ergonomic redesign of tasks and equipment to decrease the need for physical exertion.
Strength Training
According to a review of strength training efforts by the Army (Sharp, 1993), the average woman soldier weights 20 percent less and has 10 percent more body fat and 30 percent less muscle than the average male soldier. As mentioned earlier, lifting and carrying are strongly associated with FFM. Muscle strength can be classified in two ways: isometric strength (no movement) and dynamic strength (isotonic and isokinetic strength). Women soldiers demonstrate 60 to 70 percent of the isometric strength of men. Women's relative lower body strength is
greater than their upper body strength, similar to the female-to-male ratios of upper- and lower-extremity muscle mass. In addition, correction of strength for muscle mass causes most of the gender differences to disappear, suggesting that male and female muscle does not differ that much in its ability to exert force, per se.
When dynamic strength is compared between men and women, women soldiers exhibit 50 percent of men's ability on the incremental dynamic lift but 60 percent of men's ability on a box lift task, which suggests that training plays a role and when the task is familiar, women may be better able to adapt and vary their technique.
Comparison of muscular endurance between women and men reveals that women's endurance is less. They use a greater percentage of their maximum lifting strength for a given task. When expressed relative to body weight and FFM, however, women are more similar to men. Thus, the conclusion is that muscular strength and endurance in women can be increased if FFM is increased.
Strength training can result in increased FFM due to its ability to increase cross-sectional area of muscle fibers. Men and women increase their percentage of muscle mass equally with equivalent training, but the actual absolute increase is greater in men. While BCT increases FFM in men and women, it does not change the female-to-male strength ratio. Increases in isometric strength of 40 to 60 percent would be necessary to achieve parity between women and men. Such an increase would be highly unlikely (increases of 4–16% are reported). In addition, several studies have found that women who possessed higher upper body strength at the beginning of BCT improved far less during the 8-wk period than those with less upper body strength, which suggests that the training might have been less than adequate for these stronger women (Nindl et al., 1995). With endurance training also, the greatest improvement occurs in those whose fitness was poor to begin with. Contradictory findings have been obtained regarding whether military training significantly increases the female:male ratio of VO2max.
According to Sharp (1993), occupational training can eliminate many performance differences between men and women, or among personnel of different abilities. Research on task performance by women has shown that several mechanisms can reduce the physical demand of tasks. These include self-pacing, task redesign (for example, the use of teams to perform heavy lifting tasks), equipment redesign or development, and physical screening and recruitment of women who can physically perform the tasks.
Over the past 5 years, several groups of Army researchers, notably the group at the U.S. Army Research Institute of Environmental Medicine and the U.S. Army Research Laboratory (ARL), Aberdeen, Maryland, have experimented extensively with intensive strength training for women soldiers as a means of increasing their availability to the heavy and very heavy MOSs. In a study conducted by Harman et al. (1996) involving a 28-wk (5 d/wk, 1–1.5 h/d) program that combined strength, endurance, and aerobic training, all women were able to fulfill the lifting requirements of the very heavy MOS by 14 weeks (lifting 100 lb [45 kg] to table height). From pretesting to the end of the program, there was a greater than threefold increase in the percentage of women who could lift this weight to the height of a truckbed (24% to 78%). Army PFT scores improved, body fat decreased, and FFM increased in these women. Knapik and Gerber (1996) at the U.S. Army Research Laboratory reported similar but less dramatic results after a 14-wk training program.
In a 1996 symposium at the annual meeting of the Human Factors and Ergonomics Society, Knapik presented a paper on the use of task-specific versus general training methods to improve manual material handling capability by military and civilian personnel. Task specific training uses the same tasks for training and testing, while general training uses a variety of tasks for training but a completely different set of tasks for testing. Performance improvement is significantly greater following task-specific training, partly due, apparently, to psychomotor learning.2 Although gains in strength performance are smaller following general training, the advantage of the latter type of training is that it can be applied to a wide variety of tasks, similar to those faced in a number of MOSs (Knapik, 1996).
Job Redesign
In addition to their efforts in the area of strength training for women, the groups at the U.S. Army Research Institute of Environmental Medicine and U.S. Army Research Laboratory have also been involved in the redesign of five sample Army tasks (dePontbriand and Knapik, 1996). The rationale behind task redesign includes two considerations: (1) increasing numbers of military personnel, including women and some of the North Atlantic Treaty Organization (NATO) troops with whom U.S. forces have joined, are too small to handle much of the equipment and perform many military tasks that were designed to be commandeered by larger U.S. men; and (2) lowering physical demands should decrease job-related injuries, prolong ability to exert strength and increase endurance (increasing performance sustainment and maintenance), and permit more flexible personnel utilization. For example, of the 277 current MOSs, 175 require occasional lifting of 100 lb [45 kg] or more and frequent lifting of 50 lb [23 kg] or more. Approximately 20 percent of military-age males and 80 percent of military-age females are reported to be incapable of performing at this level (Headley and Rice, 1996). If such jobs could be redesigned to decrease the load-bearing requirement, more personnel would be strength-qualified to perform them.
Task redesign involves, first, the collection of all data pertaining to the nature of the tasks, training to perform the tasks, and accident reports associated with the tasks. Then, the tasks requiring the most strength are identified, and films of personnel performing each task according to prescribed methods are analyzed. Redesign options include engineering aids, alterations in packaging, and changes in the operator's physical movements (and possibly the number of personnel) used to execute the task. Observational evidence suggests that when faced with physically challenging tasks, military personnel may redesign the task on their own, using alternative strategies. Stevenson and coworkers (1996) have shown that women's box lift performance was closer to that of men's than scores on the incremental dynamic lift would predict, because women were able to shift the weight of the load when performing the box lift task.
Summary
Performance on military fitness tests does not correlate well with performance on task-specific performance tests or strength tests required for MOSs that demand heavy and moderately heavy lifting and carrying capacities. Performance on strength tests is correlated with higher FFM. Among women in basic combat training, higher body fat has been associated with greater strength, most likely due to the increased FFM of the women. Some studies have found poorer basic fitness test performance among personnel of high body fat and BMI, however.
In addition to performance testing, two strategies have been recommended by military researchers to improve the physical task performance of personnel: occupational strength and endurance training and task redesign. The average military woman has 30 percent lower muscle mass than the average military man. Strength and endurance training can increase muscle mass significantly but not enough to close this gap. Occupational training can be task-specific or general; task-specific training results in greater gains in strength, but the results of general training are applicable to a wider variety of tasks. Job redesign seeks to alter the steps performed or the equipment used to perform a task, maximize safety, minimize energy and manpower utilization, and increase endurance.
Conclusion
As outlined, the U.S. military must contend with a dilemma. Optimum physical fitness for readiness and for performance of the more strenuous MOSs requires muscle mass; optimum appearance (defined as looking good in uniform) may require a low body weight, with an accompanying low FFM. The two, however, may not be compatible.
In men, aerobic fitness is related to body fatness and FFM. Clearly, if a mass to be moved increases, the muscular power required to accomplish the move increases. In fact, several studies have shown that in women, VO2max correlates most directly with FFM, not body fat (Cureton, 1992; Harman and Frykman, 1992), and that strength performance is directly related to FFM (Beckett and Hodgdon, 1987; Knapik et al., 1996; Sharp et al., 1994). Thus, the relationship between body composition and fitness in women is clearly one of functional tissue. However, it is body fat that is currently assessed and used as the primary criterion for accession and retention. Thus, in some regard, the body composition standards currently employed by the military may discriminate against the women who would be most capable of performing the jobs requiring strength, those perhaps most critical for survival in a combat situation. Military researchers have recommended the establishment of both a minimum level of FFM commensurate with a minimum level of muscular strength at accession, and task- or strength requirement-specific training and performance testing. Current efforts also include intensive fitness and strength training and task redesign.
References
ACSM (American College of Sports Medicine). 1990. ACSM position stand. The recommended quantity and quality of exercise for developing and maintaining cardiorespiratory and muscular fitness in healthy adults. Med. Sci. Sports Exerc. 22:265–274.
AFI (Air Force Instruction) 40-501. 1996. See U.S. Department of the Air Force, 1996.
Air Force Manual 36-2108. 1994. See U.S. Department of the Air Forces, 1994.
AR (Army Regulation) 350-41. 1993. See U.S. Department of the Army, 1993.
Arvey, R.D., T.E. Landon, S.M. Nutting, and S.E. Maxwell. 1992. Development of physical ability tests for police officers: A construct validation approach. J. Appl. Psychol. 77:996–1009.
Baldi, K.A. 1991. An overview of physical fitness of female cadets at the military academies. Mil. Med. 156:537–539.
Beckett, M.B., and J.A. Hodgdon. 1987. Lifting and carrying capacities relative to physical fitness measures. Report No. 87-26. San Diego, Calif.: Naval Health Research Center.
Bourne, M.J., T.L. Conway, and P.A. Coben. 1994. Navy Physical Readiness Test: Evaluation of the command summary report. Report No. 93-29. San Diego, Calif.: Naval Health Research Center.
Bouchard, C., and R.J. Shepard. 1994. Physical activity, fitness, and health: The model and key concepts. Pp. 77–89 in Physical Activity, Fitness, and Health. International Proceedings and Consensus Statement. C. Bouchard, R. Shepard, and T. Stephens, eds. Champaign, Ill.: Human Kinetics Publishers.
Bray, R.M., L.A. Kroutil, S.C. Wheeless, M.E. Marsden, S.L. Bailey, J.A. Fairbank, and T.C. Harford. 1995. Health behavior and health promotion. Department of Defense Survey of Health Related Behaviors Among Military Personnel. Report No. RTI/6019/06-FR. Research Triangle Park, N.C.: Research Triangle Institute.
Brooks, G.A., T. Fahey, and T. White. 1996. Exercise Physiology: Human Energetics and Its Application, 2nd ed. Mountain View, Calif.: Mayfield Publishing Co.
Canham, M.L., M.A. McFerren, and B.H. Jones. 1996. The association of injury with physical fitness among men and women in gender integrated basic combat training units. Med. Surveill. Mon. Rep. 2(4):8–9.
Chahal, P., S.W. Lee, M. Oseen, M. Singh, and G. Wheeler. 1992. Physical fitness and work performance standards: A proposed approach. Int. J. Industrial Ergonomics 9:127–135.
Considine, W., J.E. Misner, R.A. Boileau, C. Pounian, J. Cole, and A. Abbatieilo. 1976. Developing a physical performance test battery for screening Chicago firefighting applicants. Pub. Pers. Mgt. 5:7–14.
Coyle, E.F., W.H. Martin, D.R. Sinacore, M.J. Joyner, J.M. Hagberg, and J.O. Hollosy. 1984. Time course of loss of adaptations after stopping prolonged intense endurance training. J. Appl. Physiol. 54:1857–1864.
Cureton, K.J. 1992. Effects of experimental alternations in excess weight on physiological responses to exercise and physical performance. Pp. 71–88 in Body Composition and Physical Performance, Applications for the Military Services, B.M. Marriott and J. Grumstrup-Scott, eds. Committee on Military Nutrition Research, Food and Nutrition Board, Institute of Medicine. Washington, D.C.: National Academy Press.
Davis, P.O, C.O. Dotson, and D.L. SantaMaria. 1982. Relationship between simulated firefighting and physical performance measures. Med. Sci. Sports. Exerc. 14:65–71.
dePontbriand, R.J., and J.J. Knapik. 1996. Feasibility of MOS job analysis and redesign to reduce physical demands in the U.S. Army. In Proceedings of the Human Factors and Ergonomics Society 40th Annual Meeting, 678–682. Santa Monica, Calif.: Human Factors and Ergonomics Society.
Destadio, F.J. 1991. Peacetime physical fitness and its effect on combat readiness: An Air Force perspective. Individual study project. Carlisle Barracks, Pa.: U.S. Army War College.
DHHS (U.S. Department of Health and Human Services). 1991. Healthy People 2000: National Health Promotion and Disease Prevention Objectives. DHHS (PHS) Publ. No. 91-50212. Public Health Service, U.S. Department of Health and Human Services. Washington, D.C.: U.S. Government Printing Office.
DHHS (U.S. Department of Health and Human Services). 1996. Physical Activity and Health: A Report of the Surgeon General. Atlanta, Ga.: DHHS, CDC, National Center for Chronic Disease Prevention and Health Promotion.
DoD (Department of Defense). 1981. See U.S. Department of Defense, Office of the Assistant Secretary of Defense for Manpower, Reserve Affairs, and Logistics, 1981.
DoD (Department of Defense) 132.1-1. 1995. See U.S. Department of Defense, 1995.
DoDD (Department of Defense Directive) 1308.1. 1981. See U.S. Department of Defense, 1981.
DoDI (Department of Defense Instruction) 1308.3. 1995. See U.S. Department of Defense, 1995.
Ellam, L.D., G.B. Fieldman, J. Garlick, R. Goldsmith, and C. Pateman. 1994. Initial training as a stimulus for optimal physical fitness in firemen. Ergonomics 37(5):933–941.
Friedman, S. 1996. Assessment of fitness in the Air Force: Evaluation of the cycle ergometry program. Presentation at the workshop on Assessing Readiness in Military Women: The Relationship to Nutrition. September 9–10, Irvine, Calif.
GAO (Government Accounting Office). 1996. Physically demanding jobs: Services have little data on ability of personnel to perform. NSIAD-96-169. July 9. Washington, D.C.
Gledhill, N., and V.K. Jamnik. 1992. Development and validation of a fitness screening protocol for firefighter applicants. Can. J. Sport Sci. 17:199–206.
Harman, E.A., and P.N. Frykman. 1992. The relationship of body size and composition to the performance of physically demanding military tasks . Pp. 105–118 in Body Composition and Physical Performance, Applications for the Military Services, B.M. Marriott and J. Grumstrup-Scott, eds. Committee on Military Nutrition Research, Food and Nutrition Board, Institute of Medicine. Washington, D.C.: National Academy Press.
Harman, E.A., P. Frykman, E. Lammi, and C. Palmer. 1996. Effects of a specifically designed physical conditioning program on the load carriage and lifting performance of female soldiers. Preliminary report. Natick, Mass.: U.S. Army Research Institute of Environmental Medicine.
Headley, D.B., and V.J. Rice. 1996. Perspectives on U.S. Army physical requirements: Problems and current approaches to solutions [abstract]. In Proceedings of the Human Factors and Ergonomics Society 40th Annual Meeting, 666–667. Santa Monica, Calif.: Human Factors and Ergonomics Society.
Hernandez, R. 1996. Physical readiness program: U.S. Navy. Presentation at the workshop on Assessing Readiness in Military Women: The Relationship to Nutrition. September 9–10, Irvine, Calif.
Hickson, R.C., C. Foster, M.L. Pollock, T.M. Galassi, and S. Rich. 1985. Reduced training intensities and loss of aerobic power, endurance and cardiac growth. J. Appl. Physiol. 58:492–499.
Hodgdon, J.A. 1992. Body composition in the military services: Standards and methods. Pp. 57–70 in Body Composition and Physical Performance, Applications for the Military Services, B.M. Marriott and J. Grumstrup-Scott, eds. Committee on Military Nutrition Research, Food and Nutrition Board, Institute of Medicine. Washington, D.C.: National Academy Press.
Hogan, J. 1991. Structure of physical performance in occupational tasks. J. Appl. Psychol. 76:495–507.
Hourani, L.L. 1996. Health and nutrition profile of women in the Navy. Presentation at the workshop on Assessing Readiness in Military Women: The Relationship to Nutrition. September 9–10, Irvine, Calif.
International Proceedings and Consensus Statement. 1994. Physical Activity, Fitness, and Health, C. Bouchard, R. Shepard, and T. Stephens, eds. Champaign, Ill.: Human Kinetics Publishers.
Jackson, A.S. 1994. Preemployment physical evaluation. Exerc. Sport Sci. Rev. 22:53–90.
Jette, M., A. Kimick, and K. Sidney. 1990a. Evaluation of an indoor standardized obstacle course for Canadian infantry personnel. Can. J. Sports Sci. 15(1):59–64.
Jette, M., K. Sidney, and W. Lewis. 1990b. Fitness performance, and anthropometric characteristics of 19,185 Canadian Forces personnel classified according to body mass index. Mil. Med. 155:120–126.
Jones, B.H. 1996. Injuries among women and men in gender integrated BCT units Fort Leonard Wood 1995. Med. Surveill. Mon. Rep. 2(2):2–3, 7–8.
Jones, B.H., M.W. Bovee, and J.J. Knapik. 1992. Associations among body composition, physical fitness, and injury in men and women Army trainees. Pp. 141–172 in Body Composition and Physical Performance, Applications for the Military Services, B.M. Marriott and J. Grumstrup-Scott, eds. Committee on Military Nutrition Research, Food and Nutrition Board, Institute of Medicine. Washington, D.C.: National Academy Press.
Jones, B.H., M.W. Bovee, J. M. Harris III, and D.N. Cowan. 1993. Intrinsic risk factors for exercise-related injuries among male and female Army trainees. Am. J. Sports Med. 21:705–710.
Jones, B.H., D.N. Cowan, and J.J. Knapik. 1994. Exercise, training, and injuries. Sports Med. 18(3):202–214.
King, N. 1996. Perspectives on nutritional issues of Army women. Presentation at the workshop on Assessing Readiness in Military Women: The Relationship to Nutrition. September 9–10, Irvine, Calif.
Knapik, J.J. 1996. Physical training and manual-material handling: Literature and military applications. In Proceedings of the Human Factors and Ergonomics Society 40th Annual Meeting, 668–672. Santa Monica, Calif.: Human Factors and Ergonomics Society.
Knapik, J.J., and J. Gerber. 1996. The influence of physical fitness training on the manual material-handling capability and road-marching performance of female soldiers. Report No. TR-1064. Aberdeen Proving Ground, Md.: Army Research Laboratory.
Knapik, J.J., L.E. Banderet, J.A. Vogel, M.S. Bahrke, and J.S. O'Connor. 1996. Influence of age and physical training on measures of cardiorespiratory and muscle endurance. Eur. J. Appl. Physiol. 72:490–495.
Lee, S.W., P. Chahal, M. Singh, and G. Wheeler. 1990. Physical fitness and performance standards for the Canadian Army. Can. Defence Q. 19(5):31–37.
Lee, S.W., P. Chahal, G. Wheeler, and M. Singh. 1995. Task related physical fitness and performance standards—a Canadian Forces approach. In NATO DRG Panel 8. Optimizing the Performance of Women in the Armed Forces of NATO. (reprint paginated 1-17) .
Marcus, R., C. Cann, P. Madvig, J. Minkoff, M. Goddard, M. Bayer, M. Martin, L. Guadiani, W. Haskell, and H. Genant. 1985. Menstrual function and bone mass in elite women distance runners. Ann. Intern. Med. 102:158–163.
McArdle, W.D., F.I. Katch, and V.L. Katch. 1996. Exercise Physiology: Energy, Nutrition, and Human Performance, 4th ed. Philadelphia: Lea and Fibiger.
Moore, J. 1996. Exercise, conditioning, and fitness as it relates to injury in active-duty women. Women's Health Issues 6(6):374–380.
Myers, D.C., D.L. Gebhardt, C.E. Crump, and E.A. Fleishman. 1984. Validation of the military entrance physical strength capacity test. Technical Report No. 610. Alexandria, Va.: U.S. Army Research Institute of Behavioral and Social Sciences.
NAVOP (Naval Operational Message) 064/90. 1990. See U.S. Department of the Navy, 1990.
NIH (National Institutes of Health). 1995. Physical Activity and Cardiovascular Health. NIH Consensus Statement. 13(3):1–33.
Nindl, B.C., M.A. Sharp, K.A. Westphal, K.E. Friedl, K.L. Reynolds, and J.F. Patton. 1995. Differential effects of U.S. Army basic training on upper body strength among untrained women [abstract]. J. Strength Conditioning Res. 9:284.
O'Connor, J.S., M.S. Bahrke, and R.G. Tetu. 1990. 1988 Active Army Physical Fitness Survey. Mil. Med. 155:579–585.
OPNAVINST (Naval Operations Instruction) 6110.1D. 1990. See U.S. Department of the Navy, Office of the Chief of Naval Operations, 1990.
Pollock, M.L., L. Garzarella, D. Dehoyos, W. Brechue, and M. Beekley. 1994. The cross-validation of the United States Air Force submaximal cycle ergometer test to estimate aerobic capacity. Report No. AL/CF-TR-1994-0046. Brooks AFB, Tx.: Armstrong Laboratory.
Rhodes, E.C., and D.W. Farenholtz. 1992. Police Officer's Physical Abilities Test compared to measures of physical fitness. Can. J. Sport Sci. 17:228–233.
Robertson, D.W., and T.T. Trent. 1985. Documentation of muscularly demanding job tasks and validation of an occupational strength test battery (STB) . Report No. 86-1. San Diego, Calif.: Naval Personnel Research and Development Center.
Sharp, D.S., J.E. Wright, J.A. Vogel, J.F. Patton, W.L. Daniels, J. Knapik, and D.M. Koval. 1980. Screening for physical capacity in the U.S. Army: An analysis of measures predictive of strength and stamina. Technical Report No. T8/80. Natick, Mass.: U.S. Army Research Institute of Environmental Medicine.
Sharp, M.A. 1993. Physical fitness, physical training, and occupational performance of men and women in the U.S. Army—A review of the literature. Report No. TN93-7. Natick, Mass.: U.S. Army Research Institute of Environmental Medicine.
Sharp, M.A., B.C. Nindl, K.A. Westphal, and K.E. Friedl. 1994. The physical performance of female Army basic trainees who pass and fail the Army body weight and percent body fat standards. Pp. 743–750 in Advance in Industrial Ergonomics and Safety VI, F. Aghazadeh, ed. London: Taylor and Francis.
Stevenson, J.M., J.T. Bryant, G.M. Andrew, J.T. Smith, S.L. French, J.M. Thomson, and J.M. Deakin. 1992. Development of physical fitness standards for Canadian Armed Forces Younger Personnel. Can. J. Sport Sci. 17:214–221.
Stevenson, J.M., J.M. Deakin, G.M. Andrew, J.T. Bryant, J.T. Smith, and J.M. Thomson. 1994. Development of physical fitness standards for Canadian Armed Forces older personnel. Can. J. Appl. Physiol. 19:75–90.
Stevenson, J.M., D.R. Greenhorn, J.T. Bryant, J.M. Deakin, and J.T. Smith. 1996. Gender differences in performance of a selection test using the incremental lifting machine. Applied Ergonomics 27:45–52.
Teves, M.A., J.E. Wright, and J.A. Vogel. 1985. Performance on selected candidate screening test procedures before and after Army basic and advanced individual training. Report No. T13/85. Natick, Mass.: U.S. Army Research Institute of Environmental Medicine.
Tomasi, L.F., P.R. Regualos, G. Fober, and M. Christenson. 1995. Army Physical Fitness Test Update Survey. Technical Report. Fort Benning, Ga.: U.S. Army Physical Fitness School.
U.S. Department of Defense, Office of the Assistant Secretary of Defense for Manpower, Reserve Affairs, and Logistics. 1981. Reserve affairs and logistics: Study of the military services physical fitness. Unpublished report. Washington, D.C.
U.S. Department of Defense. 1981. Department of Defense Directive 1308.1 ''Physical Fitness and Weight Control Programs." June 29. Washington, D.C.
U.S. Department of Defense. 1995. Department of Defense Instruction 1308.3. "Physical Fitness and Body Fat Programs." August 30. Washington, D.C.
U.S. Department of Defense. 1995. 132.1-1. "Occupational Conversion Index." September 9. Washington, D.C.
U.S. Department of the Air Forces. 1994. Air Force Manual 36-2108. "Airman Classification." October 31. Washington, D.C.
U.S. Department of the Air Force. 1996. Air Force Instruction 40-501. "The Air Force Fitness Program." February 1. Washington, D.C.
U.S. Department of the Army. 1993. Army Regulation 350-41. "Training in Units." March 19. Washington, D.C.
U.S. Department of the Navy. 1990. Naval Operational Message 064/90. "Physical Readiness Program." June 22. Washington, D.C.
U.S. Department of the Navy, Office of the Chief of Naval Operations. 1990. Naval Operations Instruction 6110.1D. "Physical Readiness Program." January 18. Washington, D.C.
Vogel, J.A. 1992. Obesity and its relation to physical fitness in the U.S. military. Armed Forces and Society 18:497–513.
Vogel, J.A., and K.E. Friedl. 1992. Army data: Body composition and physical capacity. Pp. 89–103 in Body Composition and Physical Performance, Applications for the Military Services, B.M. Marriott and J. Grumstrup-Scott, eds. Committee on Military Nutrition Research, Food and Nutrition Board, Institute of Medicine. Washington, D.C.: National Academy Press.
Westphal, K.A., K.E. Friedl, M.A. Sharp, N. King, T.R. Kramer, K.L. Reynolds, and L.J. Marchitelli. 1995. Health, performance, and nutritional status of U.S. Army women during basic combat training. Technical Report No. T96-2. Natick, Mass.: U.S. Army Research Institute of Environmental Medicine.
Williford, H.N., K. Sport, N. Wang, M.S. Olson, and D. Blessing. 1994. The prediction of fitness levels of United States Air Force officers: Validation of cycle ergometry. Mil. Med. 159:175–178.
Wilmore, J.H., and J.A. Davis. 1979. Validation of a physical abilities field test for the selection of state traffic officers. J. Occup. Med. 21:33–40.
| This page in the original is blank. |


