
APPENDIX B Overall Framework of Probabilistic Risk Analysis
No general model is described in the Prince William Sound, Alaska, Risk Assessment Study (PWS Study), but consistency and systematic logic in the analyses depend on an overarching framerwork. Several models are available for risk analyses depending on the system and the type of information available. One option is the assembly model proposed by Garrick for the risk analysis of nuclear power plants (1984). The general model presented below, assumes that risk must be computed as a probability of failure or as a full probability distribution of the outcomes.
CLASSICAL RISK ANALYSIS FRAMEWORK
An overarching model that could be used for marine systems should involve the following steps:
-
Identify the accident types (including the consequences) of interest in the study. Accident types can be structured as a mutually exclusive, collectively exhaustive set of events, if appropriate. Otherwise, dependencies must be accounted for. For example, if an event significantly affects more than one accident type, the analyses cannot be separated, and the probabilities have to be computed given that event.
-
Identify the possible initiating events for each accident type, for example and if appropriate, as a mutually exclusive and collectively exhaustive set, and assess their marginal probabilities.
-
For each initiating event, identify the possible sequences of events (including accident sequences) that can be triggered, including subsequent events, final states, and resulting source terms (in this case, the amount of oil released).
-
Assess the conditional probabilities of subsequent events, given the values of the variables that condition them. This assessment is generally based on a combination
-
of analytical techniques, including statistical analysis, fault trees, event trees, dynamic models, simulation, or careful encoding of expert opinions. The probabilistic assessment phase involves treatment of external events (e.g., the weather) and common causes of failures that can affect several components at the same time, including human and organizational errors.
This overall model is then used to compute the probabilities and consequences of different accident sequences and accident types, accounting for dependencies when they exist. The final result is a probability distribution of the consequences of interest. For the PWS Study, the consequences were primarily the amount of oil in the sea per time unit (e.g., one year) and/or the size of the maximum spill in one year. In risk analyses for other marine systems, the consequences should also include human casualities. The results can be represented by a risk curve, which is the complementary cumulative distribution of the outcome. The curve represents the annual probability that the amount of damage would exceed various specified levels.
When the input data (e.g., the probabilities of the basic events) are uncertain, the uncertainties should be represented by probability distributions (e.g., about the future frequencies of events). The uncertainties are then propagated through the analysis to ensure that uncertainties are represented in the model outputs. The risk results can then be displayed as a family of risk curves of the probabilities of exceeding each year different volumes of oil spilled, each curve corresponding to a fractile, (e.g., 10 percent, 50 percent, 95 percent). The fractile represents the confidence in the result, i.e., the probability that the corresponding frequency will be lower than the number shown by that curve.
PROBABILISTIC MODEL THAT TREATS HUMAN ERRORS AND OTHER HUMAN FACTORS
Human errors have been recognized as major contributors to the risk of failure in complex systems, and in particular, as a critical issue in maritime safety (NRC, 1976, 1981). It has also been shown that most human errors are caused by management factors (e.g., Perrow, 1984; Weick, 1987; Reason, 1990a, b; Clark and Short, 1993; Maurino et al., 1995). They are routinely included in probabilistic risk analyses when the error is part of a failure mode, i.e., when it is a necessary component of a failure scenario.
Initially, human errors were seldom included in probabilistic risk analyses unless they were directly part of failure modes. Recently, methods have been developed to account for the role of human errors as promoters of component failure (e.g., Wu et al., 1991; Paté-Cornell and Murphy, 1996; Rasmussen, 1987, 1990). With these methods, the contribution of human errors to the failure risks of specific systems (given their physical and operational characteristics) can be assessed.
The analysis in the PWS Study is based on an a priori judgment that human errors cause 80 percent of the risk and that technical failures cause 20 percent. This often-repeated assumption (the so called “80–20 rule”) is not a sound basis for a risk analysis for several reasons. First, depending on the depth at which one analyzes and traces failures back to human decisions, virtually all failures can be linked to human errors, which is of
no help in identifying and evaluating a full spectrum of safety measures. Second, this proportion varies widely from system to system and across accident types. Finally, the “80–20 rule” may lead to double counting of the effects of some errors that may appear once in the human-related part of the risk analysis and again as part of the technical failures that they induce. The following discussion (based on a paper by Paté-Cornell, [1997]) shows how a probabilistic risk assessment (PRA) can compute the contributions of different types of human and organizational errors in the probability of failure of specific systems.
Some human errors (e.g., errors in steering) are direct causes of accidents. Others (e.g., faulty maintenance) increase the probabilities of technical failures. Pushing this reasoning to its limit, one could decide that the only events that should be excluded from the class of error-based accidents are accidents caused by extreme events outside the range of rationally-chosen design parameters. For example, one might decide to design a platform to withstand the 500-year wave; but during its 50-year lifetime, the platform is toppled by a 1,000-year wave. This category of accidents could be labeled “bad luck”; but even then, one could say that the 500-year wave did not provide enough of a safety margin. In fact, whereas some decisions are clearly mistakes, some decisions are borderline, (i.e., they could be called questionable judgments, after the fact). This makes the definition of human errors, as well as the computation of their effects on the overall probability of the failure of a system, somehow arbitrary and, therefore, useless, except to support the general statement that it is worth considering mitigation measures to reduce the probability of human errors. The SAM (system, actions, management) model was designed to account systematically for the contribution of human errors to specified types of accidents in a PRA (Murphy and Paté-Cornell, 1996). These errors can be treated either as part of failure modes (basic events) or as external events that can be common causes of failure.
The approach of the SAM model can be described as follows. Human errors can be divided into two categories. At the first level, the PRA includes human errors that are directly part of accident sequences. At the second level, the analysis is extended to include human errors that influence the probabilities of the technical failures that constitute the min-cut sets without being part of them (e.g., most maintenance errors). Finally, at the third level, the analysis involves management errors that influence the decisions and actions of the people involved and, through them, influence the probability of accidents.
A convenient representation of this generalized risk analysis model is an influence diagram (ID), a powerful analytical tool associated with softwares that can involve both logical and probabilistic dependencies (Schachter, 1986). An ID is a directed graph with nodes that represent events or random variables and arrows that represent probabilistic dependencies (or inputs into functions). In addition, an ID is characterized by all distributions (marginal and conditional) and all functions (algebraic and/or Boolean) necessary to describe links between the nodes. In effect, IDs are homomorphic to event trees and fault trees. The direction of the arrows represents the structure of the available information (i.e., the chosen direction of the probabilistic conditioning) and not causality. Therefore, probabilistic inference can be used to reverse the arrows of the graph and to compute the probability distribution of the end variable (generally, the outcome distribution).
Probabilistic Risk Assessment
Consider, for example, the accident sequence “Grounding due to Loss of Propulsion.” The following ID (Figure B-l), which is homomorphic to an event tree but easier to read, represents the structure of a simplified PRA, extended to include human and organizational factors. The basic events are in boxes, and the external events are in ovals.
At the first level (the lowest level), it is assumed that human error was not an immediate cause of the loss of power. The first step of the PRA model for this particular failure mode is to compute the probability of release levels per time unit as a function of the conditional probabilities of control, grounding, breach size, and oil flow, given the events that precede them in the ID. The next step is conditioning the relevant variables on the external events (speed, wave height, and location of the loss of power).
Role of Human Errors
One can then condition the PRA model on the human errors (decisions and actions) that influenced the basic events. For example, the loss of propulsion may have been caused, in part, by a defect in the maintenance procedure, and the control of the drift and the grounding may have been influenced by the skill levels of the captain and crew. The original ID can be modified to show these effects, and the basic PRA model can be completed to show these probabilistic dependencies. This requires measuring skill levels on a specified scale and evaluating the probabilities of the skill levels on the basis of the population of ships that visit the area. The conditional probabilities of the main events (basic events of the failure modes, i.e., drift control and grounding) then have to be assessed conditional on the skill levels of the captain and crew, as shown in the second tier of the ID of Figure B-l. The probabilities of the different quantities of oil released can then be recomputed by conditioning the elements of the PRA model equations on the two new variables representing the maintenance quality and skill level of the crew.
Effect of Management
Management can be brought into the picture to show the effect of the organization on the maintenance quality and skill levels of the captain and crew and, therefore, on the risks as previously computed. These dependencies are shown in the third (highest) level of Figure B-l.
The maintenance quality can be determined in large part by the resource constraints (time and budget). The skill level of the crew can be determined by the personnel management The proportion of the total probability of the chosen failure mode (i.e., grounding due to loss of power) attributable to human decisions and actions thus depends on the effect of these decisions and actions on the overall probability of grounding as computed through (1) the contribution of maintenance errors to the probability of failure of the power system, (2) the contribution of the skill level of the captain and crew to the probability of controlling the drifting of the ship once the loss of power has occurred, and (3) the ability of the crew to avoid grounding, given the level of drift control, the location of the incident,
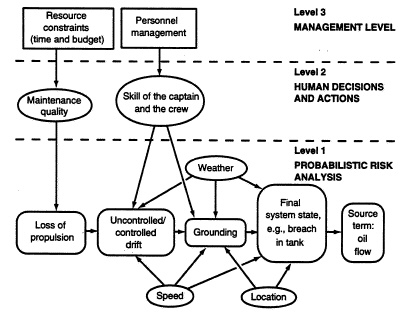
FIGURE B-l Three levels of conditionality in the introduction of human decisions and actions into a PRA for a particular failure mode.
and the speed of the ship at the time the loss of propulsion. (This analysis does not attempt to be exhaustive, which would require going back to the level of the choice of design and the quality of construction).
CONCLUSION
This sample analysis shows that the contribution of human actions to the probability of an accident is not uniform across accident sequences for a particular system, let alone across different marine systems. For instance, in the example presented above, some ships may have a greater tendency to lose power than others. Also, the contribution of human errors to the risk may depend on external factors. In areas where the weather can be severe, storms may be a large contributor to the risk even in the absence of human error. By contrast, in areas where the weather is seldom a problem, a larger part of the risk may be attributable to human inability to steer the ship away from obstacles. In both cases, however, crew training may be beneficial. This example also shows that the evaluation of the role of human errors depends on the depth of the analysis. If one stops at the classical PRA (lower level of Figure B-l), technical failures leading to loss of propulsion are the fundamental causes of groundings. If one includes maintenance in the analysis, maintenance errors may appear as major contributors to the probability of failures.
A probabilistic analysis of this type has to be performed for every case (systems and
accident sequences) in order to estimate the role of specific human factors in the overall risk. Their contributions cannot be assumed to follow the 80–20 rule and then be allocated to the accident scenarios.
REFERENCES
Clark, L., and J.F.Short. 1993. Social organization and risk: some current controversies. Annual Review of Sociology 6:375–399.
Garrick, B.J. 1984. Recent Case Studies and Advancements in Probabilistic Risk Assessment. Risk Analysis 4(4):267– 279.
Maurino, D., J.Reason, N.Johnston, and R.Lee. 1995. Beyond Aviation Human Factors. Aldershot, Hants, England: Ashgate Publishing Limited.
Murphy, D.M., and M.E.Paté-Cornell. 1996. The SAM framework: a systems analysis approach to modeling the effects of management on human behavior in risk analysis. Risk Analysis 16(4):501–515.
NRC (National Research Council). 1976. Human Error in Merchant Marine Safety. Marine Board. Washington, D.C.: National Academy Press.
NRC. 1981. Research Needs to Reduce Maritime Collisions, Rammings, and Groundings. Marine Board. Washington, D.C.: National Academy Press.
Paté-Cornell, M.E. 1997. Ranking and priorities in risk management: human and organizational factors in system failure risk analysis and a maritime illustration. Pp. 68–76 in Proceedings of the MIT workshop on Organizational Processes in High-Hazard Industries. Cambridge, Mass.: MIT
Paté-Cornell, M.E., and D.Murphy. 1996. Human and management factors in probabilistic risk analysis: the SAM approach and observations from recent applications. Reliability Engineering and System Safety 53:115–126.
Perrow, C. 1984. Normal Accidents: Living with High Risk Technologies. New York: Basic Books.
Rasmussen, J. 1987. Approaches to the control of the effects of human error on chemical plant safety. Pp. 36–251 in Proceedings of the International Symposium on Preventing Major Chemical Plant Accidents. Washington, D.C.: American Institute of Chemical Engineers.
Rasmussen, J. 1990. Human error and the problem of causality in analysis of accidents. Pp. 1–12 in Human Factors in Hazardous Situations, D.E.Broadbent, J.Reason, and A.Baddeley, eds. London: Royal Society.
Reason, J. 1990a. The age of the organizational accident. Nuclear Engineering International July 1990, pp. 18–19.
Reason.J. 1990b. Human Error. Cambridge, U.K.: Cambridge University Press.
Shachter R.D. 1986. Evaluating influence diagrams. Operations Research 34:871–882.
Weick, K. 1987. Organizational culture as a source of high reliability. California Management Review Winter 1987 pp. 43–52.
Wu, J., G.Apostolakis, and D.Okrent. 1991. On the inclusion of organizational and managerial influences in probabilistic safety assessments of nuclear power plants. Pp. 123–146 in Analysis, Communication and Perception of Risk, B.Garrick and W.Gekler, eds. New York: Plenum Press.


