
TABLE 1-2 Race/Ethnicity of Female Engineering Faculty at U.S. Institutions, by Field of Highest Degree
|
|
Race/Ethnicity |
||||||||
|
Asian/Pacific Underrepresented |
|||||||||
|
|
Total |
White |
Islander |
Minorities * |
No Report |
||||
|
Field of Highest Degree |
No. |
No. |
% |
No. |
% |
No. |
% |
No. |
% |
|
Total |
775 |
625 |
81 |
74 |
10 |
61 |
8 |
15 |
2 |
|
Aerospace/Industrial Engineering |
52 |
41 |
79 |
4 |
8 |
7 |
13 |
0 |
0 |
|
Chemical/Mineral Engineering |
84 |
71 |
85 |
6 |
7 |
6 |
7 |
1 |
1 |
|
Civil Engineering |
81 |
67 |
83 |
8 |
10 |
6 |
7 |
0 |
0 |
|
Electrical/Computer Engineering |
124 |
87 |
70 |
24 |
19 |
12 |
10 |
1 |
1 |
|
Materials Sci/Plastics/Ceramics Engineering |
42 |
34 |
81 |
4 |
10 |
4 |
10 |
0 |
0 |
|
Mechanical/General Engineering |
99 |
89 |
90 |
6 |
6 |
4 |
4 |
0 |
0 |
|
Other Engineering |
67 |
56 |
84 |
2 |
3 |
8 |
12 |
1 |
1 |
|
Computer Sciences |
64 |
51 |
80 |
8 |
13 |
2 |
3 |
3 |
5 |
|
Mathematical Sciences/Operations Research |
40 |
35 |
88 |
2 |
5 |
3 |
8 |
0 |
0 |
|
Physical Sciences |
50 |
39 |
78 |
6 |
12 |
3 |
6 |
2 |
4 |
|
Other Fields |
43 |
35 |
81 |
2 |
5 |
4 |
9 |
2 |
5 |
|
No Report |
29 |
20 |
69 |
2 |
7 |
2 |
7 |
5 |
17 |
|
* Underrepresented minorities include African American, Native American, Hispanic, and “other.” |
|||||||||
TABLE 1-3 Citizenship of Female Engineering Faculty at U.S. Institutions, by Field of Highest Degree
|
|
Citizenship |
||||||
|
|
Total |
U.S. |
Non-U.S. |
No Report |
|||
|
Field of Highest Degree |
No. |
No. |
% |
No. |
% |
No. |
% |
|
Total |
775 |
673 |
87 |
93 |
12 |
9 |
1 |
|
Aerospace/Industrial Engineering |
52 |
46 |
88 |
6 |
12 |
0 |
0 |
|
Chemical/Mineral Engineering |
84 |
76 |
90 |
7 |
8 |
1 |
1 |
|
Civil Engineering |
81 |
64 |
79 |
17 |
21 |
0 |
0 |
|
Electrical/Computer Engineering |
124 |
101 |
81 |
22 |
18 |
1 |
1 |
|
Materials Sci/Plastics/Ceramics Engineering |
42 |
37 |
88 |
4 |
10 |
1 |
2 |
|
Mechanical/General Engineering |
99 |
95 |
96 |
4 |
4 |
0 |
0 |
|
Other Engineering |
67 |
60 |
90 |
7 |
10 |
0 |
0 |
|
Computer Sciences |
64 |
59 |
92 |
5 |
8 |
0 |
0 |
|
Mathematical Sciences/Operations Research |
40 |
37 |
93 |
3 |
8 |
0 |
0 |
|
Physical Sciences |
50 |
38 |
76 |
10 |
20 |
2 |
4 |
|
Other Fields |
43 |
40 |
93 |
3 |
7 |
0 |
0 |
|
No Field Specified |
29 |
20 |
69 |
5 |
17 |
4 |
14 |
TABLE 1-4 Marital Status and Number of Dependents of Female Faculty at U.S. Institutions
|
|
Number |
Percent |
|
Marital Status |
||
|
Total |
775 |
100 |
|
Married |
563 |
73 |
|
Not Married |
199 |
26 |
|
No Report |
13 |
2 |
|
Dependents |
||
|
Total |
775 |
100 |
|
None |
319 |
41 |
|
One |
170 |
22 |
|
Two |
188 |
24 |
|
Three or More |
82 |
11 |
|
No Report |
16 |
2 |
FIGURE 1-2 Employment of spouse of female engineering faculty at U.S. institutions.
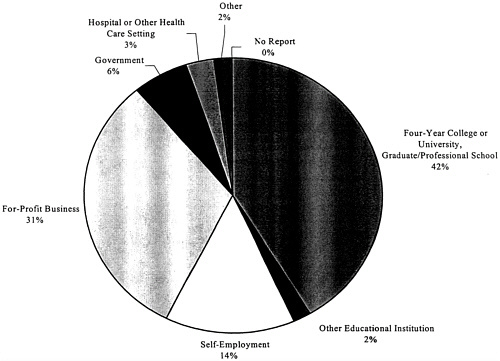
TABLE 1-5 Highest Levels of Education of Parents of Female Engineering Faculty at U.S. Institutions
|
|
Of Mother |
Of Father |
||
|
Highest Level of Education |
Number |
Percent |
Number |
Percent |
|
Total |
775 |
100 |
775 |
100 |
|
Less Than High School Diploma |
76 |
10 |
65 |
8 |
|
High School Diploma |
180 |
23 |
115 |
15 |
|
Some Postsecondary Education |
108 |
14 |
67 |
9 |
|
Associate’s Degree |
40 |
5 |
22 |
3 |
|
Bachelor’s Degree |
137 |
18 |
161 |
21 |
|
Some Graduate Education |
51 |
7 |
48 |
6 |
|
Master’s Degree |
93 |
12 |
122 |
16 |
|
Doctorate or Professional Degree |
82 |
11 |
166 |
21 |
|
No Report |
8 |
1 |
9 |
1 |
FIGURE 1-3 Highest education level of parents of female engineering faculty.
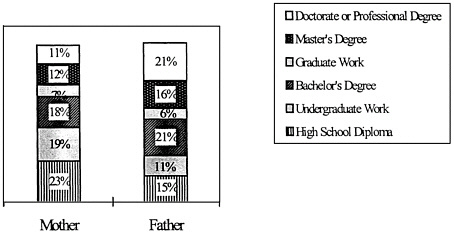
TABLE 1-6 Employment Sector of Parents of Female Engineering Faculty at U.S. Institutions
|
|
Of Mother |
Of Father |
||
|
Employment Sector |
Number |
Percent |
Number |
Percent |
|
Total |
775 |
100 |
775 |
100 |
|
4-Year College or University, Graduate/Professional School |
33 |
4 |
78 |
10 |
|
2-Year or Other Postsecondary Institution |
14 |
2 |
4 |
1 |
|
Elementary or Secondary School |
137 |
18 |
37 |
5 |
|
Self-Employment |
41 |
5 |
137 |
18 |
|
Hospital or Other Health-Care or Clinical Setting |
83 |
11 |
23 |
3 |
|
For-Profit Business or Industry in Private Sector |
114 |
15 |
301 |
39 |
|
Foundation or Other Nonprofit Organization |
15 |
2 |
10 |
1 |
|
Federal, State, Local Government |
45 |
6 |
121 |
16 |
|
Other |
67 |
9 |
39 |
5 |
|
Not Applicable |
188 |
24 |
9 |
1 |
|
No Report |
38 |
5 |
16 |
2 |
TABLE 2-1 Level of Highest Degree for Female Engineering Faculty at U.S. Institutions, by Field of Highest Degree
|
|
Level of Highest Degree |
|||||||||||
|
|
Total |
Ph.D. |
Master’s |
Bachelor’s |
Other |
No Report |
||||||
|
Field of Highest Degree |
No. |
% |
No. |
% |
No. |
% |
No. |
% |
No. |
% |
No. |
% |
|
Total |
775 |
100 |
676 |
87 |
70 |
9 |
9 |
1 |
3 |
0 |
17 |
2 |
|
Aerospace/Industrial Engineering |
52 |
7 |
46 |
88 |
6 |
12 |
0 |
0 |
0 |
0 |
0 |
0 |
|
Chemical/Mineral Engineering |
84 |
11 |
80 |
95 |
4 |
5 |
0 |
0 |
0 |
0 |
0 |
0 |
|
Civil Engineering |
81 |
10 |
77 |
95 |
4 |
5 |
0 |
0 |
0 |
0 |
0 |
0 |
|
Electrical/Computer Engineering |
124 |
16 |
114 |
92 |
8 |
6 |
1 |
1 |
1 |
1 |
0 |
0 |
|
Materials Sci/Plastics/Ceramics Engineering |
42 |
5 |
41 |
98 |
1 |
2 |
0 |
0 |
0 |
0 |
0 |
0 |
|
Mechanical/General Engineering |
99 |
13 |
83 |
84 |
13 |
13 |
2 |
2 |
1 |
1 |
0 |
0 |
|
Other Engineering |
67 |
9 |
63 |
94 |
4 |
6 |
0 |
0 |
0 |
0 |
0 |
0 |
|
Computer Sciences |
64 |
8 |
59 |
92 |
5 |
8 |
0 |
0 |
0 |
0 |
0 |
0 |
|
Mathematical Sci/Operations Research |
40 |
5 |
37 |
93 |
2 |
5 |
1 |
3 |
0 |
0 |
0 |
0 |
|
Physical Sciences |
50 |
6 |
42 |
84 |
7 |
14 |
1 |
2 |
0 |
0 |
0 |
0 |
|
Other Fields |
43 |
6 |
23 |
53 |
15 |
35 |
4 |
9 |
1 |
2 |
0 |
0 |
|
No Field Specified |
29 |
4 |
11 |
38 |
1 |
3 |
0 |
0 |
0 |
0 |
17 |
59 |
FIGURE 2-1 Highest degree of female engineering faculty at U.S. institutions.
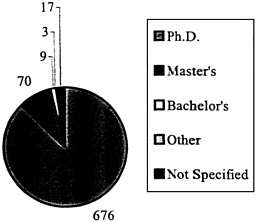
TABLE 2-2 Field of Highest Degree of Female Engineering Faculty at U.S. Institutions
|
Field |
Number |
|
Total |
775 |
|
Aerospace/Industrial Engineering |
52 |
|
Aerospace/Aeronautical/Astronautical |
16 |
|
Industrial/Manufacturing |
36 |
|
Chemical/Mineral Engineering |
84 |
|
Chemical |
70 |
|
Petroleum |
1 |
|
Mineral |
5 |
|
Metallurgical |
8 |
|
Civil Engineering |
81 |
|
Electrical/Computer Engineering |
124 |
|
Computer |
15 |
|
Electrical/Electronics |
104 |
|
Systems |
5 |
|
Materials Sci/Plastics/Ceramics Engineering |
42 |
|
Materials Science |
35 |
|
Plastics/Polymer |
3 |
|
Ceramics |
4 |
|
Mechanical/General Engineering |
99 |
|
Engineering Mechanics |
13 |
|
Mechanical Engineering |
79 |
|
Engineering Science |
2 |
|
Engineering, General |
5 |
|
Other Engineering |
67 |
|
Agricultural |
4 |
|
Bioengineering/Biomedical |
14 |
|
Environmental |
29 |
|
Food |
1 |
|
Nuclear |
5 |
|
Engineering, Other |
14 |
|
Computer Sciences |
64 |
|
Computer Sciences |
63 |
|
Information Science and Systems |
1 |
|
Mathematical Sciences/Operations Research |
40 |
|
Applied Mathematics |
6 |
|
Mathematical Statistics |
3 |
|
Operations Research |
18 |
|
Mathematics, General |
13 |
|
Physical Sciences |
50 |
|
Astronomy |
1 |
|
Atmospheric Science/Meteorology |
1 |
|
Organic Chemistry |
1 |
|
Physical Chemistry |
1 |
|
Chemistry, General |
4 |
|
Chemistry, Other |
1 |
|
Geology |
1 |
|
Geochemistry |
1 |
|
Chemical/Atomic/Molecular Physics |
1 |
|
Nuclear Physics |
1 |
|
Solid State/Low Temperature Physics |
2 |
|
Physics, General |
25 |
|
Physics, Other |
4 |
|
Environmental Science |
2 |
|
Oceanography |
1 |
|
Physical Sciences, Other |
3 |
|
Other Fields |
43 |
|
Other Soil Sciences |
1 |
|
Other Agricultural Sciences |
1 |
|
Biochemistry |
1 |
|
Bacteriology |
1 |
|
Anatomy |
1 |
|
Biometrics/Biostatistics |
1 |
|
Cell Biology |
1 |
|
Microbiology |
1 |
|
Human/Animal Genetics |
1 |
|
Human/Animal Physiology |
1 |
|
Counseling Psychology |
1 |
|
Comparative Literature |
1 |
|
English Literature |
1 |
|
Archeology |
1 |
|
Philosophy |
1 |
|
Education |
12 |
|
Business/Management |
8 |
|
Communications |
1 |
|
Architecture |
2 |
|
Law |
1 |
|
Other Professional Fields |
1 |
|
Other Fields |
3 |
|
No Report |
29 |
FIGURE 2-2 Broad field of highest degree by degree level for female engineering faculty at U.S. institutions.
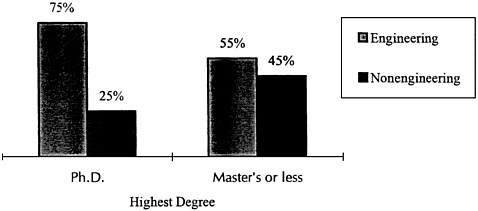
TABLE 2-3 Year of Highest Degree of Female Engineering Faculty at U.S. Institutions, by Field of Highest Degree
|
|
Year of Highest Degree |
||||||||||
|
|
Total |
1951-1969 |
1970-1979 |
1980-1989 |
1990-1996 |
No Report |
|||||
|
Field of Highest Degree |
No. |
No. |
% |
No. |
% |
No. |
% |
No. |
% |
No. |
% |
|
Total |
775 |
23 |
3 |
101 |
13 |
336 |
43 |
283 |
37 |
32 |
4 |
|
Aerospace/Industrial Engineering |
52 |
0 |
0 |
4 |
8 |
20 |
38 |
26 |
50 |
2 |
4 |
|
Chemical/Mineral Engineering |
84 |
3 |
4 |
8 |
10 |
47 |
56 |
24 |
29 |
2 |
2 |
|
Civil Engineering |
81 |
0 |
0 |
3 |
4 |
44 |
54 |
34 |
42 |
0 |
0 |
|
Electrical/Computer Engineering |
124 |
3 |
2 |
16 |
13 |
44 |
35 |
58 |
47 |
3 |
2 |
|
Materials Sci/Plastics/Ceramics Engineering |
42 |
0 |
0 |
4 |
10 |
21 |
50 |
17 |
40 |
0 |
0 |
|
Mechanical/General Engineering |
99 |
0 |
0 |
12 |
12 |
45 |
45 |
40 |
40 |
2 |
2 |
|
Other Engineering |
67 |
1 |
1 |
3 |
4 |
33 |
49 |
29 |
43 |
1 |
1 |
|
Computer Sciences |
64 |
1 |
2 |
9 |
14 |
25 |
39 |
27 |
42 |
2 |
3 |
|
Mathematical Sciences/Operations Research |
40 |
2 |
5 |
15 |
38 |
14 |
35 |
9 |
23 |
0 |
0 |
|
Physical Sciences |
50 |
8 |
16 |
16 |
32 |
21 |
42 |
4 |
8 |
1 |
2 |
|
Other Fields |
43 |
5 |
12 |
10 |
23 |
14 |
33 |
13 |
30 |
1 |
2 |
|
No Report |
29 |
0 |
0 |
1 |
3 |
8 |
28 |
2 |
7 |
18 |
62 |
TABLE 2-4 Race/Ethnicity of Female Engineering Faculty at U.S. Institutions, by Year of Highest Degree
|
|
Race/Ethnicity |
|||||||||
|
|
Asian/Pacific |
Underrepresented |
||||||||
|
|
Total |
White |
Islander |
Minorities * |
No Report |
|||||
|
Year of Highest Degree |
No. |
% |
No. |
% |
No. |
% |
No. |
% |
No. |
% |
|
Total |
775 |
100 |
625 |
81 |
74 |
10 |
61 |
8 |
15 |
2 |
|
Before 1970 |
23 |
3 |
18 |
78 |
5 |
22 |
0 |
0 |
0 |
0 |
|
1970-1979 |
101 |
13 |
86 |
85 |
6 |
6 |
7 |
7 |
2 |
2 |
|
1980-1989 |
336 |
43 |
280 |
83 |
27 |
8 |
22 |
7 |
7 |
2 |
|
1990-1996 |
283 |
37 |
217 |
77 |
35 |
12 |
30 |
11 |
1 |
0 |
|
Not Specified |
32 |
4 |
24 |
75 |
1 |
3 |
2 |
6 |
5 |
16 |
|
* Underrepresented minorities include black, Native American, Hispanic, and “other.” |
||||||||||
FIGURE 2-3 Year of highest degree by race/ethnicity of female engineering faculty at U.S. institutions.
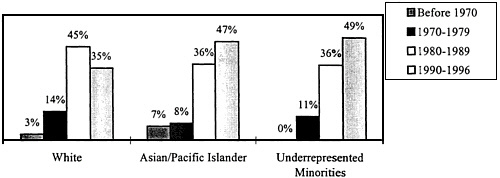
TABLE 2-5 U.S. Top-Producing Baccalaureate Institutions of Female Engineering Faculty
|
Institution |
Number of Degrees |
|
Massachusetts Institute of Technology |
25 |
|
University of Michigan-Ann Arbor |
17 |
|
Cornell University/NY |
14 |
|
University of Illinois-Urbana-Champaign |
14 |
|
Stanford University/CA |
13 |
|
Carnegie Mellon University/PA |
12 |
|
Iowa State University |
12 |
|
Michigan State University |
11 |
|
The Pennsylvania State University |
10 |
|
University of Minnesota-Twin Cities |
10 |
|
Princeton University/NJ |
9 |
|
Georgia Institute of Technology |
8 |
|
Rensselaer Polytechnic Institute/NY |
8 |
|
Texas A&M University |
8 |
|
Harvard University/MA |
8 |
|
Columbia University/NY |
7 |
|
University of California-Berkeley |
7 |
|
Virginia Polytechnic Institute & State University |
7 |
|
University of Wisconsin-Madison |
7 |
|
University of Pittsburgh/PA |
7 |
|
North Carolina State University-Raleigh |
6 |
|
Swarthmore College/PA |
6 |
|
Purdue University/IN |
6 |
|
Alfred University/NY |
5 |
|
University of Washington |
5 |
|
University of Rochester/NY |
5 |
|
University of Pennsylvania |
5 |
|
University of California-San Diego |
5 |
|
Northwestern University/IL |
5 |
|
Clemson University/SC |
5 |
|
Brooklyn College, CUNY |
5 |
TABLE 2-6 Carnegie Classification of Baccalaureate Institutions of Female Engineering Faculty at U.S. Institutions
|
Carnegie Classification |
Number of Degrees |
Percent |
|
Total Bachelor’s Degrees |
771 |
100 |
|
Research University I |
341 |
44 |
|
Research University II |
64 |
8 |
|
Doctorate Granting I |
27 |
4 |
|
Doctorate Granting II |
33 |
4 |
|
Comprehensive I |
72 |
9 |
|
Comprehensive II |
6 |
1 |
|
Liberal Arts I |
44 |
6 |
|
Liberal Arts II |
15 |
2 |
|
Other Classifications |
13 |
2 |
|
Foreign Institutions |
146 |
19 |
|
Unknown Institutions |
10 |
1 |
TABLE 2-7 Top-Producing Doctoral Institutions of Female Engineering Faculty U.S. Institutions
|
Institution |
Number of Degrees |
|
Massachusetts Institute of Technology |
48 |
|
Stanford University/CA |
38 |
|
University of California-Berkeley |
37 |
|
University of Illinois-Urbana-Champaign |
24 |
|
Carnegie Mellon University/PA |
21 |
|
Northwestern University/IL |
16 |
|
University of Michigan-Ann Arbor |
15 |
|
Cornell University/NY |
12 |
|
Georgia Institute of Technology |
12 |
|
Princeton University/NJ |
11 |
|
Purdue University/IN |
11 |
|
University of Minnesota-Twin Cities |
11 |
|
Ohio State University |
9 |
|
University of Colorado |
9 |
|
University of Wisconsin-Madison |
9 |
|
University of Pennsylvania |
9 |
|
University of Maryland |
9 |
|
Texas A&M University |
9 |
|
California Institute of Technology |
8 |
|
Iowa State University |
8 |
|
Michigan State University |
8 |
|
North Carolina State University-Raleigh |
8 |
|
Columbia University/NY |
7 |
|
University of California-Davis |
7 |
|
Virginia Polytechnic Institute & State University |
7 |
|
University of Southern California |
7 |
|
Johns Hopkins University/MD |
7 |
TABLE 3-1 Academic Rank of Female Engineering Faculty at U.S. Institutions, by Field of Highest Degree
|
|
Academic Rank |
||||||||||||||
|
|
Total |
Professor |
Associate |
Assistant Professor |
Instructor/Lecturer |
Other |
No Report |
||||||||
|
Field of Highest Degree |
No. |
% |
No. |
% |
No. |
% |
No. |
% |
No. |
% |
No. |
% |
No. |
% |
|
|
Total |
775 |
100 |
139 |
18 |
264 |
34 |
305 |
39 |
28 |
4 |
36 |
5 |
3 |
0 |
|
|
Aerospace/Industrial Engineering |
52 |
7 |
3 |
6 |
22 |
42 |
23 |
44 |
3 |
6 |
1 |
2 |
0 |
0 |
|
|
Chemical/Mineral Engineering |
84 |
11 |
14 |
17 |
37 |
44 |
31 |
37 |
0 |
0 |
2 |
2 |
0 |
0 |
|
|
Civil Engineering |
81 |
10 |
9 |
11 |
28 |
35 |
40 |
49 |
3 |
4 |
1 |
1 |
0 |
0 |
|
|
Electrical/Computer Engineering |
124 |
16 |
23 |
19 |
39 |
31 |
55 |
44 |
2 |
2 |
4 |
3 |
1 |
1 |
|
|
Materials Sci/Plastics/Ceramics Engineering |
42 |
5 |
6 |
14 |
7 |
17 |
27 |
64 |
0 |
0 |
2 |
5 |
0 |
0 |
|
|
Mechanical/General Engineering |
99 |
13 |
16 |
16 |
31 |
31 |
41 |
41 |
4 |
4 |
7 |
7 |
0 |
0 |
|
|
Other Engineering |
67 |
9 |
7 |
10 |
21 |
31 |
35 |
52 |
2 |
3 |
2 |
3 |
0 |
0 |
|
|
Computer Sciences |
64 |
8 |
12 |
19 |
25 |
39 |
22 |
34 |
4 |
6 |
1 |
2 |
0 |
0 |
|
|
Mathematical Sciences/Operations Research |
40 |
5 |
11 |
28 |
17 |
43 |
10 |
25 |
1 |
3 |
1 |
3 |
0 |
0 |
|
|
Physical Sciences |
50 |
6 |
20 |
40 |
17 |
34 |
9 |
18 |
1 |
2 |
3 |
6 |
0 |
0 |
|
|
Other Fields |
43 |
6 |
9 |
21 |
8 |
19 |
7 |
16 |
7 |
16 |
11 |
26 |
1 |
2 |
|
|
No Field Specified |
29 |
4 |
9 |
31 |
12 |
41 |
5 |
17 |
1 |
3 |
1 |
3 |
1 |
3 |
|
TABLE 3-2 Tenure Status of Female Engineering Faculty at U.S. Institutions, by Field of Highest Degree
|
|
Tenure Status |
|||||||||||
|
|
Total |
Tenured |
On Tenure Track |
Not on Tenure Track |
Tenure Not Applicable |
No Report |
||||||
|
Field of Highest Degree |
No. |
% |
No. |
% |
No. |
% |
No. |
% |
No. |
% |
No. |
% |
|
Total |
775 |
100 |
376 |
49 |
300 |
39 |
53 |
7 |
38 |
5 |
8 |
1 |
|
Aerospace/Industrial Engineering |
52 |
7 |
22 |
42 |
23 |
44 |
5 |
10 |
2 |
4 |
0 |
0 |
|
Chemical/Mineral Engineering |
84 |
11 |
50 |
60 |
31 |
37 |
3 |
4 |
0 |
0 |
0 |
0 |
|
Civil Engineering |
81 |
10 |
34 |
42 |
42 |
52 |
2 |
2 |
2 |
2 |
1 |
1 |
|
Electrical/Computer Engineering |
124 |
16 |
60 |
48 |
50 |
40 |
5 |
4 |
6 |
5 |
3 |
2 |
|
Materials Sci/Plastics/Ceramics Engineering |
42 |
5 |
11 |
26 |
28 |
67 |
2 |
5 |
1 |
2 |
0 |
0 |
|
Mechanical/General Engineering |
99 |
13 |
44 |
44 |
38 |
38 |
11 |
11 |
6 |
6 |
0 |
0 |
|
Other Engineering |
67 |
9 |
24 |
36 |
34 |
51 |
5 |
7 |
4 |
6 |
0 |
0 |
|
Computer Sciences |
64 |
8 |
32 |
50 |
24 |
38 |
3 |
5 |
5 |
8 |
0 |
0 |
|
Mathematical Sciences/Operations Research |
40 |
5 |
28 |
70 |
9 |
23 |
1 |
3 |
2 |
5 |
0 |
0 |
|
Physical Sciences |
50 |
6 |
32 |
64 |
12 |
24 |
3 |
6 |
2 |
4 |
1 |
2 |
|
Other Fields |
43 |
6 |
20 |
47 |
5 |
12 |
12 |
28 |
6 |
14 |
0 |
0 |
|
No Field Specified |
29 |
4 |
19 |
66 |
4 |
14 |
1 |
3 |
2 |
7 |
3 |
10 |
FIGURE 3-1 Tenure status of female engineering faculty at U.S. institutions, by race/ethnicity.
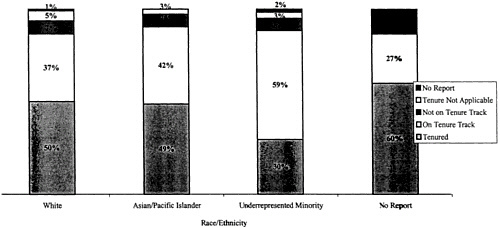
TABLE 3-3 Perceptions About Tenure Criteria and Policies Held by Female Engineering Faculty at U.S. Institutions (for Those Tenured and on Tenure Track)
|
|
Total |
Yes |
No |
No Report |
||||
|
No. |
% |
No. |
% |
No. |
% |
No. |
% |
|
|
Clear, Well-Defined Tenure Criteria |
||||||||
|
Tenured |
376 |
56 |
206 |
55 |
132 |
35 |
38 |
10 |
|
On Tenure Track |
300 |
44 |
134 |
45 |
150 |
50 |
16 |
5 |
|
Tenure Policies Fair to Women |
||||||||
|
Tenured |
376 |
56 |
242 |
64 |
92 |
24 |
42 |
11 |
|
On Tenure Track |
300 |
44 |
180 |
60 |
89 |
30 |
31 |
10 |
TABLE 3-4 Primary Work Activity of Female Engineering Faculty at U.S. Institutions, by Field of Highest Degree
|
|
Primary Work Activity |
|||||||||||||
|
Total |
Teaching |
Research |
Teaching & Research |
Administration |
Other |
No Report |
||||||||
|
Field of Highest Degree |
No. |
% |
No. |
% |
No. |
% |
No. |
% |
No. |
% |
No. |
% |
No. |
% |
|
Total |
775 |
100 |
339 |
44 |
217 |
28 |
114 |
15 |
53 |
7 |
29 |
4 |
23 |
3 |
|
Aerospace/Industrial Engineering |
52 |
7 |
22 |
42 |
18 |
35 |
5 |
10 |
5 |
10 |
1 |
2 |
1 |
2 |
|
Chemical/Mineral Engineering |
84 |
11 |
31 |
37 |
38 |
45 |
10 |
12 |
5 |
6 |
0 |
0 |
0 |
0 |
|
Civil Engineering |
81 |
10 |
33 |
41 |
19 |
23 |
20 |
25 |
5 |
6 |
0 |
0 |
4 |
5 |
|
Electrical/Computer Engineering |
124 |
16 |
59 |
48 |
25 |
20 |
19 |
15 |
13 |
10 |
6 |
5 |
2 |
2 |
|
Materials Sci/Plastics/Ceramics Engineering |
42 |
5 |
19 |
45 |
15 |
36 |
4 |
10 |
3 |
7 |
0 |
0 |
1 |
2 |
|
Mechanical/General Engineering |
99 |
13 |
45 |
45 |
29 |
29 |
11 |
11 |
8 |
8 |
5 |
5 |
1 |
1 |
|
Other Engineering |
67 |
9 |
27 |
40 |
21 |
31 |
11 |
16 |
0 |
0 |
6 |
9 |
2 |
3 |
|
Computer Sciences |
64 |
8 |
28 |
44 |
17 |
27 |
11 |
17 |
2 |
3 |
4 |
6 |
2 |
3 |
|
Mathematical Sciences/Operations Research |
40 |
5 |
19 |
48 |
9 |
23 |
6 |
15 |
3 |
8 |
1 |
3 |
2 |
5 |
|
Physical Sciences |
50 |
6 |
17 |
34 |
17 |
34 |
6 |
12 |
5 |
10 |
2 |
4 |
3 |
6 |
|
Other Fields |
43 |
6 |
27 |
63 |
3 |
7 |
6 |
14 |
4 |
9 |
3 |
7 |
0 |
0 |
|
No Field Specified |
29 |
4 |
12 |
41 |
6 |
21 |
5 |
17 |
0 |
0 |
1 |
3 |
5 |
17 |
TABLE 3-5 Range of Annual Salaries of Female Engineering Faculty at U.S. Institutions, by Field of Highest Degree
|
|
Salary Range |
||||||||||
|
|
Total |
$50,000 or Less |
$50,001-$60,000 |
More Than $60,000 |
No Report |
||||||
|
Field of Highest Degree |
No. |
% |
|
No. |
% |
No. |
% |
No. |
% |
No. |
% |
|
Total |
775 |
100 |
|
164 |
21 |
263 |
34 |
341 |
44 |
7 |
1 |
|
Aerospace/Industrial Engineering |
52 |
6 |
12 |
23 |
18 |
35 |
22 |
42 |
0 |
0 |
|
|
Chemical/Mineral Engineering |
84 |
11 |
13 |
15 |
29 |
35 |
42 |
50 |
0 |
0 |
|
|
Civil Engineering |
81 |
10 |
24 |
30 |
29 |
36 |
27 |
33 |
1 |
1 |
|
|
Electrical/Computer Engineering |
124 |
16 |
29 |
23 |
37 |
30 |
57 |
46 |
1 |
1 |
|
|
Materials Sci/Plastics/Ceramics Engineering |
42 |
5 |
8 |
19 |
14 |
33 |
20 |
48 |
0 |
0 |
|
|
Mechanical/General Engineering |
99 |
13 |
27 |
27 |
35 |
35 |
36 |
36 |
1 |
1 |
|
|
Other Engineering |
67 |
9 |
11 |
16 |
31 |
46 |
25 |
37 |
0 |
0 |
|
|
Computer Sciences |
64 |
8 |
9 |
14 |
25 |
39 |
29 |
45 |
1 |
2 |
|
|
Mathematical Sciences/Operations Research |
40 |
5 |
4 |
10 |
11 |
28 |
25 |
63 |
0 |
0 |
|
|
Physical Sciences |
50 |
6 |
7 |
14 |
13 |
26 |
29 |
58 |
1 |
2 |
|
|
Other Fields |
43 |
6 |
17 |
40 |
13 |
30 |
13 |
30 |
0 |
0 |
|
|
No Field Specified |
29 |
4 |
3 |
10 |
8 |
28 |
16 |
55 |
2 |
7 |
|
TABLE 3-6 Range of Annual Salaries of Female Engineering Faculty at U.S. Institutions, by Race/Ethnicity
|
|
Salary Range |
|||||||||
|
|
Total |
$50,000 or Less |
$50,001-$60,000 |
More Than $60,000 |
No Report |
|||||
|
Race/Ethnicity |
No. |
% |
No. |
% |
No. |
% |
No. |
% |
No. |
% |
|
Total |
775 |
100 |
164 |
21 |
263 |
34 |
341 |
44 |
7 |
1 |
|
White |
625 |
81 |
130 |
21 |
211 |
34 |
280 |
45 |
4 |
1 |
|
Asian |
74 |
10 |
18 |
24 |
29 |
39 |
27 |
36 |
0 |
0 |
|
Underrepresented Minorities * |
61 |
8 |
12 |
20 |
22 |
36 |
27 |
44 |
0 |
0 |
|
No Report |
15 |
2 |
4 |
27 |
1 |
7 |
7 |
47 |
3 |
20 |
|
* Underrepresented minorities include African American, Native American, Hispanic, and “other.” |
||||||||||
FIGURE 3-2 Academic productivity of female engineering faculty at U.S. institutions in 1994 and 1995.
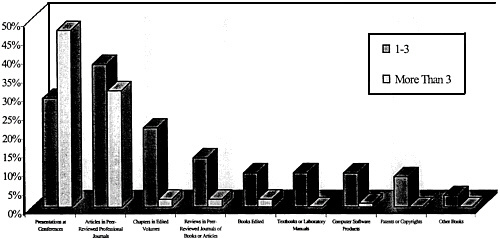
TABLE 3-7 Level of Satisfaction with Current Employment of Female Engineering Faculty by Field of Highest Degree
|
|
Level of Satisfaction |
||||||||||
|
|
Total |
Very Dissatisfied |
Somewhat Dissatisfied |
Somewhat Satisfied |
Very Satisfied |
No Report |
|||||
|
Field of Highest Degree |
No. |
No. |
% |
No. |
% |
No. |
% |
No. |
% |
No. |
% |
|
Total |
775 |
53 |
7 |
133 |
17 |
286 |
37 |
234 |
30 |
69 |
9 |
|
Aerospace/Industrial Engineering |
52 |
2 |
4 |
10 |
19 |
20 |
38 |
16 |
31 |
4 |
8 |
|
Chemical/Mineral Engineering |
84 |
5 |
6 |
18 |
21 |
21 |
25 |
31 |
37 |
9 |
11 |
|
Civil Engineering |
81 |
3 |
4 |
18 |
22 |
32 |
40 |
25 |
31 |
3 |
4 |
|
Electrical/Computer Engineering |
124 |
9 |
7 |
18 |
15 |
50 |
40 |
35 |
28 |
12 |
10 |
|
Materials Sci/Plastics/Ceramics Engineering |
42 |
4 |
10 |
7 |
17 |
18 |
43 |
10 |
24 |
3 |
7 |
|
Mechanical/General Engineering |
99 |
8 |
8 |
29 |
29 |
30 |
30 |
25 |
25 |
7 |
7 |
|
Other Engineering |
67 |
8 |
12 |
7 |
10 |
35 |
52 |
14 |
21 |
3 |
4 |
|
Computer Sciences |
64 |
2 |
3 |
8 |
13 |
27 |
42 |
17 |
27 |
10 |
16 |
|
Mathematical Sciences/Operations Research |
40 |
4 |
10 |
7 |
18 |
13 |
33 |
13 |
33 |
3 |
8 |
|
Physical Sciences |
50 |
4 |
8 |
5 |
10 |
13 |
26 |
25 |
50 |
3 |
6 |
|
Other Fields |
43 |
2 |
5 |
5 |
12 |
13 |
30 |
19 |
44 |
4 |
9 |
|
No Field Specified |
29 |
2 |
7 |
1 |
3 |
14 |
48 |
4 |
14 |
8 |
28 |
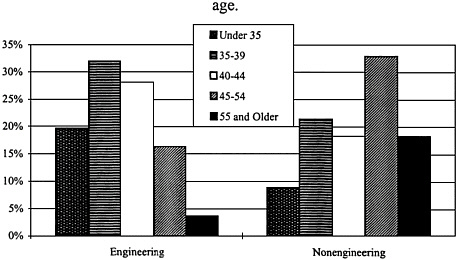
TABLE 3-8 Level of Satisfaction with Current Employment of Female Engineering Faculty at U.S. Institutions, by Age
|
|
Total |
Very Dissatisfied |
Somewhat Dissatisfied |
Somewhat Satisfied |
Very Satisfied |
No Report |
|||||
|
Age |
No. |
No. |
% |
No. |
% |
No. |
% |
No. |
% |
No. |
% |
|
Total |
775 |
53 |
7 |
133 |
17 |
286 |
37 |
234 |
30 |
69 |
9 |
|
Under 35 |
124 |
7 |
6 |
26 |
21 |
47 |
38 |
34 |
27 |
10 |
8 |
|
35-39 |
219 |
16 |
7 |
45 |
21 |
84 |
38 |
61 |
28 |
13 |
6 |
|
40-44 |
194 |
10 |
5 |
28 |
14 |
79 |
41 |
62 |
32 |
15 |
8 |
|
45-54 |
156 |
16 |
10 |
26 |
17 |
51 |
33 |
44 |
28 |
19 |
12 |
|
55 and Older |
58 |
2 |
3 |
6 |
10 |
15 |
26 |
29 |
50 |
6 |
10 |
|
No Report |
24 |
2 |
8 |
2 |
8 |
10 |
42 |
4 |
17 |
6 |
25 |
TABLE 3-9 Previous Employment Sector of Female Engineering Faculty at U.S. Institutions, by Field of Highest Degree
|
|
Sector |
|||||||||
|
|
Total |
Education |
Government |
For-Profit Business/Industry * |
Other |
|||||
|
Field of Highest Degree |
No. |
% |
No. |
% |
No. |
% |
No. |
% |
No. |
% |
|
Total |
492 |
100 |
181 |
37 |
70 |
14 |
216 |
44 |
25 |
5 |
|
Aerospace/Industrial Engineering |
34 |
7 |
10 |
29 |
2 |
6 |
19 |
56 |
3 |
9 |
|
Chemical/Mineral Engineering |
44 |
9 |
13 |
30 |
8 |
18 |
19 |
43 |
4 |
9 |
|
Civil Engineering |
57 |
12 |
17 |
30 |
13 |
23 |
22 |
39 |
5 |
9 |
|
Electrical/Computer Engineering |
69 |
14 |
27 |
39 |
5 |
7 |
36 |
52 |
1 |
1 |
|
Materials Sci/Plastics/Ceramics Engineering |
33 |
7 |
12 |
36 |
6 |
18 |
14 |
42 |
1 |
3 |
|
Mechanical/General Engineering |
64 |
13 |
21 |
33 |
8 |
13 |
32 |
50 |
3 |
5 |
|
Other Engineering |
45 |
9 |
17 |
38 |
4 |
9 |
20 |
44 |
4 |
9 |
|
Computer Sciences |
39 |
8 |
18 |
46 |
5 |
13 |
14 |
36 |
2 |
5 |
|
Mathematical Sciences/Operations Research |
21 |
4 |
12 |
57 |
3 |
14 |
6 |
29 |
0 |
0 |
|
Physical Sciences |
43 |
9 |
21 |
49 |
10 |
23 |
11 |
26 |
1 |
2 |
|
Other Fields |
32 |
7 |
9 |
28 |
4 |
13 |
18 |
56 |
1 |
3 |
|
No Field Specified |
11 |
2 |
4 |
36 |
2 |
18 |
5 |
45 |
0 |
0 |
|
* Includes those self-employed. NOTE: Total includes only those who provided a previous employment sector. |
||||||||||
TABLE 3-10 Reasons Given by Female Engineering Faculty at U.S. Institutions for Leaving Previous Employer
|
Reasons |
Number |
Percent |
|
Total |
492 |
100 |
|
Professional Motivation |
291 |
59 |
|
Opportunities for Advancement |
79 |
16 |
|
More Education * |
68 |
14 |
|
Overall Satisfaction |
53 |
11 |
|
Sector * |
35 |
7 |
|
Job Ended * |
40 |
8 |
|
Better Job * |
12 |
2 |
|
Your Ability to Obtain Research Funding |
4 |
1 |
|
Family/Personal Reasons |
93 |
19 |
|
Job for Spouse/Partner in Another Locale |
33 |
7 |
|
Geographic Location |
23 |
5 |
|
Lack of Job in Area for Spouse/Partner |
19 |
4 |
|
Family * |
17 |
3 |
|
Environment/Schools for My Children |
1 |
0 |
|
Work Environment |
66 |
13 |
|
Opportunity to Do Research |
22 |
4 |
|
Experience with the Tenure Process |
15 |
3 |
|
Salary Level |
9 |
2 |
|
Teaching Responsibilities |
5 |
1 |
|
Level of Communication Among Faculty |
5 |
1 |
|
Opportunity for Administrative Responsibilities |
4 |
1 |
|
Research Facilities and Equipment |
2 |
0 |
|
Benefits |
2 |
0 |
|
Instructional Facilities and Equipment |
1 |
0 |
|
Pressure to Publish |
1 |
0 |
|
Other |
30 |
6 |
|
No Report |
12 |
2 |
|
* Write-in responses. NOTE: Total includes only those who provided a previous employment sector in Question 53. |
||
TABLE 3-11 Career Impact of Aspects of the Work Environment and Life Cycle Events on Female Engineering Faculty at U.S. Institutions
|
|
Total |
Positive Impact |
Negative Impact |
No Impact/Not Applicable |
No Report |
||||
|
No. |
No. |
% |
No. |
% |
No. |
% |
No. |
% |
|
|
Opportunities for Advancement |
775 |
399 |
51 |
100 |
13 |
188 |
24 |
88 |
11 |
|
Requirement to Publish |
775 |
421 |
54 |
152 |
20 |
133 |
17 |
69 |
9 |
|
Teaching Responsibilities |
775 |
480 |
62 |
166 |
21 |
61 |
8 |
68 |
9 |
|
Opportunity to do Research |
775 |
492 |
63 |
115 |
15 |
91 |
12 |
77 |
10 |
|
Number of Women on Engineering Faculty |
775 |
140 |
18 |
257 |
33 |
308 |
40 |
70 |
9 |
|
Opportunity for Administrative Responsibilities |
775 |
182 |
23 |
125 |
16 |
395 |
51 |
73 |
9 |
|
Research Facilities and Equipment |
775 |
339 |
44 |
235 |
30 |
129 |
17 |
72 |
9 |
|
Research Funding Available to Faculty |
775 |
306 |
39 |
276 |
36 |
116 |
15 |
77 |
10 |
|
Your Ability to Obtain Research Funding |
775 |
403 |
52 |
199 |
26 |
99 |
13 |
74 |
10 |
|
Instructional Facilities and Equipment |
775 |
274 |
35 |
185 |
24 |
237 |
31 |
79 |
10 |
|
Salary Level |
775 |
287 |
37 |
162 |
21 |
256 |
33 |
70 |
9 |
|
Benefits |
775 |
301 |
39 |
62 |
8 |
340 |
44 |
72 |
9 |
|
Level of Communication Among Department Faculty |
775 |
333 |
43 |
262 |
34 |
110 |
14 |
70 |
9 |
|
Opportunities to Attend Professional Meetings |
775 |
545 |
70 |
77 |
10 |
82 |
11 |
71 |
9 |
|
Geographic Location |
775 |
315 |
41 |
178 |
23 |
207 |
27 |
75 |
10 |
|
Job or Job Opportunities in Area for Spouse or Partner |
775 |
274 |
35 |
162 |
21 |
217 |
28 |
122 |
16 |
|
Marriage |
775 |
292 |
38 |
116 |
15 |
286 |
37 |
81 |
10 |
|
Being Part of a Dual-Career Couple |
775 |
242 |
31 |
260 |
34 |
195 |
25 |
78 |
10 |
|
Having Children |
775 |
128 |
17 |
272 |
35 |
288 |
37 |
87 |
11 |
|
Balancing Work and Family Responsibilities |
775 |
127 |
16 |
401 |
52 |
166 |
21 |
81 |
10 |
TABLE 3-12 Factors Facilitating the Academic Careers of Female Engineering Faculty at U.S. Institutions
|
Factor |
Number |
Percent |
|
Total |
775 |
100 |
|
Aspects of the Work Environment (Rewards of Teaching; Availability of External Research Funds; Flexible Schedules; Opportunity Both to Teach and to Conduct Research; Affirmative Action) |
252 |
33 |
|
Influences From Others (Mentors; Family; Professional Networks) |
133 |
17 |
|
Self 1 (Personal Ability; Research and Publications) |
10 |
14 |
|
Education (University Where Ph.D. Was Earned; Timing of Degree; Developments in Chosen Field) |
54 |
7 |
|
Prior Experience (As a Teaching or Research Assistant; As a Postdoctoral Fellow; Working in Industry) |
50 |
6 |
|
Other |
8 |
1 |
|
No Report |
168 |
22 |
|
NOTE: Subcategories listed under each broad area of influence are examples of some of the write-in responses. |
||
TABLE 4-1 Suggestions From Female Engineering Faculty at U.S. Institutions of Areas for Additional Inquiry
|
Topic |
Number of Responses |
|
Total |
206 |
|
Personal Background |
9 |
|
Parents’ Educational Background |
2 |
|
Family’s Socioeconomic Status |
2 |
|
Careers of Siblings |
1 |
|
Other Precollege Influences on Career Decisions |
4 |
|
Preparation for Academe |
22 |
|
Financing One’s Education |
3 |
|
Postdoctoral Experience |
2 |
|
Preparation for Work in Academe |
7 |
|
Factors Affecting Choice to Work in Academe |
10 |
|
Family Status and Responsibilities |
33 |
|
Balancing Work Responsibilities and Personal Life |
24 |
|
Sex of Partner |
7 |
|
Careers of Children |
2 |
|
Terms of Employment |
28 |
|
Specific Field and Position of Employment |
7 |
|
Primary Work Activity |
5 |
|
Tenure |
5 |
|
Salary in Comparison to That of Men |
4 |
|
Importance of Collaboration and Publication |
4 |
|
Availability of Research Funding |
3 |
|
Work Environment |
26 |
|
Evolving Work Environment |
4 |
|
Collegiality of Faculty in My Department |
5 |
|
Extra-Departmental Influences |
8 |
|
Influences of Female Engineering Faculty and Administrators |
9 |
|
Job Satisfaction and Factors Affecting Success |
85 |
|
Overall Job Satisfaction |
18 |
|
Mentoring |
19 |
|
Factors Enabling Some Female Faculty to be More Successful Than Others |
8 |
|
Other Obstacles Faced in Education and/or Employment Because of Being Female (Including Discrimination) |
40 |
|
Non-Native U.S. Citizens |
3 |


