
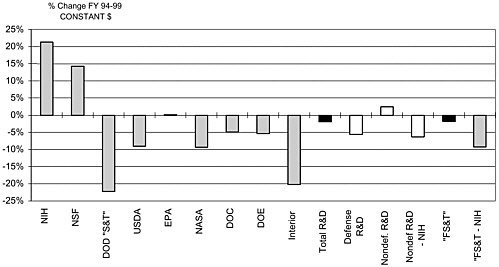
Table I-13. Trends in R&D, FY 1994–1999
Change in Constant Dollars
|
|
FY 1994 |
FY 1998 |
FY 1999 |
% Chg. in Constant $ |
|
|
|
Actual |
Estimate |
Budget |
FY 94–98 |
FY 94–99 |
|
Dept. of Defense |
35,510 |
37,430 |
37,010 |
-3.6% |
-6.5% |
|
DOD 6.1–6.3 |
8,283 |
7,800 |
7,181 |
-13.8% |
-22.2% |
|
NASA |
9,406 |
9,816 |
9,504 |
-4.5% |
-9.4% |
|
Dept. of Energy |
6,771 |
6,288 |
7,142 |
-15.0% |
-5.4% |
|
Nat'l Institutes of Health |
10,474 |
13,097 |
14,163 |
14.4% |
21.3% |
|
NSF |
2,243 |
2,568 |
2,857 |
4.8% |
14.3% |
|
Agriculture |
1,528 |
1,553 |
1,549 |
-7.0% |
-9.1% |
|
Interior |
708 |
609 |
629 |
-21.3% |
-20.2% |
|
Transportation |
641 |
676 |
775 |
-3.5% |
8.5% |
|
EPA |
588 |
672 |
657 |
4.6% |
0.1% |
|
Commerce |
1,022 |
1,081 |
1,083 |
-3.2% |
-4.9% |
|
All Other* |
2,185 |
2,248 |
2,365 |
-5.8% |
-2.9% |
|
Total R&D |
71,074 |
76,038 |
77,735 |
-2.1% |
-1.9% |
|
Defense R&D |
38,299 |
40,409 |
40,289 |
-3.5% |
-5.6% |
|
Nondefense R&D |
32,775 |
35,629 |
37,446 |
-0.5% |
2.5% |
|
Basic Research |
13,693 |
15,710 |
16,917 |
5.0% |
10.8% |
|
''FS&T''1 |
43,002 |
45,557 |
47,057 |
-3.1% |
-1.8% |
|
Source: AAAS Report XX, OMB R&D data, and revised agency R&D estimates. Adjusted for inflation according to OMB's GDP deflators. * -Includes non-NIH programs in Health and Human Services. 1 An alternative measure for the federal investment in science and technology proposed by the National Academy of Sciences. This measure includes all federal R&D except for advanced development, testing and evaluation work in DOD and DOE. The DOD 6.1–6.3 categories represent the DOD contribution to the FS&T budget. DOE FS&T includes nearly all DOE R&D; the changes to DOE FS&T are -16.0% (FY 94–98) and -4.7% (FY 94–99) Complete historical data (86–99) tables are available on the World Wide Web at: http://www.aaas.org/spp/dspp/rd/rdwwwpg.htm in the "Guide" section. |
|||||
Table I-14. AAAS Analysis of the Projected Effects of the President's FY 1999 Budget on Federal R&D, FY 1998–2003 (budget authority in millions of dollars)
|
|
FY 1998 |
FY 1999 |
FY 2000 |
FY 2001 |
FY 2002 |
FY 2003 |
% Chg. FY '98–'03 |
|
|
|
Estimate |
Budget |
Projected |
Projected |
Projected |
Projected |
current $ |
constant $ |
|
Defense (military) |
37,430 |
37,010 |
34,795 |
33,844 |
34,396 |
35,230 |
-5.9% |
-15.3% |
|
Health and Human Services |
13,809 |
14,888 |
15,723 |
16,660 |
17,965 |
20,080 |
45.4% |
30.8% |
|
Nat'l Institutes of Health |
13,097 |
14,163 |
14,989 |
15,918 |
17,225 |
19,322 |
47.5% |
32.7% |
|
NASA |
9,816 |
9,504 |
9,397 |
9,389 |
9,493 |
9,513 |
-3.1% |
-12.8% |
|
Energy |
6,288 |
7,142 |
7,061 |
7,117 |
7,219 |
7,236 |
15.1% |
3.5% |
|
Defense |
2,979 |
3,279 |
3,295 |
3,229 |
3,306 |
3,357 |
12.7% |
1.4% |
|
Nondefense |
3,310 |
3,864 |
3,766 |
3,888 |
3,913 |
3,879 |
17.2% |
5.4% |
|
Nat'l Science Foundation |
2,568 |
2,857 |
2,946 |
3,038 |
3,131 |
3,229 |
25.8% |
13.1% |
|
Agriculture |
1,553 |
1,549 |
1,561 |
1,552 |
1,555 |
1,556 |
0.1% |
-9.9% |
|
Commerce |
1,081 |
1,083 |
1,096 |
1,096 |
1,105 |
1,077 |
-0.4% |
-10.4% |
|
Interior |
609 |
629 |
632 |
624 |
623 |
623 |
2.5% |
-7.8% |
|
Transportation |
676 |
775 |
816 |
774 |
727 |
700 |
3.6% |
-6.8% |
|
Environ. Protection Agency |
672 |
657 |
667 |
724 |
754 |
776 |
15.4% |
3.8% |
|
All Other |
1,536 |
1,640 |
1,631 |
1,646 |
1,658 |
1,675 |
9.1% |
-1.9% |
|
Total R&D |
76,038 |
77,735 |
76,326 |
76,463 |
78,627 |
81,696 |
7.4% |
-3.4% |
|
Defense R&D |
40,409 |
40,289 |
38,091 |
37,073 |
37,702 |
38,587 |
-4.5% |
-14.1% |
|
Nondefense R&D |
35,629 |
37,446 |
38,235 |
39,390 |
40,925 |
43,108 |
21.0% |
8.8% |
|
"FS&T" |
45,557 |
47,057 |
47,930 |
49,052 |
50,778 |
53,128 |
16.6% |
4.9% |
|
Source: AAAS analyses of defense and nondefense R&D. The analyses, containing agency details and methodology, are available on the World Wide Web at: http://www.aaas.org/spp/dspp/rd/rdwwwpg.htm |
||||||||
Table II-1. R&D in the FY 1999 Budget by Agency (budget authority in millions of dollars)
|
|
FY 1997 |
FY 1998 |
FY 1999 |
Change FY 98–99 |
|
|
|
Actual |
Estimate |
Budget |
Amount |
Percent |
|
Total R&D (Conduct and Facilities) |
|||||
|
Defense (military) |
37,238 |
37,430 |
37,010 |
-420 |
-1.1% |
|
Science & Tech. (6.1–6.3) |
7,493 |
7,800 |
7,181 |
-619 |
-7.9% |
|
All Other DOD R&D |
29,745 |
29,630 |
29,829 |
199 |
0.7% |
|
Health and Human Services |
12,912 |
13,809 |
14,888 |
1,079 |
7.8% |
|
Nat'l Institutes of Health |
12,217 |
13,097 |
14,163 |
1,066 |
8.1% |
|
NASA |
9,352 |
9,816 |
9,504 |
-312 |
-3.2% |
|
Energy |
6,217 |
6,288 |
7,142 |
854 |
13.6% |
|
Nat'l Science Foundation |
2,424 |
2,568 |
2,857 |
290 |
11.3% |
|
Agriculture |
1,556 |
1,553 |
1,549 |
-4 |
-0.3% |
|
Commerce |
964 |
1,081 |
1,083 |
2 |
0.2% |
|
Interior |
591 |
609 |
629 |
21 |
3.4% |
|
Transportation |
612 |
676 |
775 |
99 |
14.6% |
|
Environ. Protection Agency |
595 |
672 |
657 |
-15 |
-2.3% |
|
Veterans Affairs |
588 |
608 |
670 |
62 |
10.2% |
|
Education |
185 |
209 |
265 |
56 |
26.8% |
|
Agency for Int'l Develop. |
169 |
150 |
154 |
4 |
2.7% |
|
Smithsonian |
142 |
146 |
155 |
9 |
6.2% |
|
Tennessee Valley Auth. |
52 |
37 |
35 |
-2 |
-5.4% |
|
Labor |
35 |
71 |
33 |
-38 |
-53.5% |
|
Nuclear Reg. Comm. |
62 |
61 |
53 |
-8 |
-13.1% |
|
Corps of Engineers |
44 |
42 |
40 |
-2 |
-4.8% |
|
Housing and Urban Dev. |
34 |
37 |
50 |
13 |
35.1% |
|
Justice |
48 |
65 |
60 |
-5 |
-7.7% |
|
Social Security |
8 |
18 |
30 |
12 |
66.7% |
|
Postal Service |
68 |
56 |
59 |
3 |
5.4% |
|
Int'l Security Assist. |
21 |
21 |
21 |
0 |
0.0% |
|
Treasury |
13 |
13 |
13 |
0 |
0.0% |
|
Arms Ctrl. & Disarm. |
1 |
1 |
1 |
0 |
0.0% |
|
Marine Mammal Com. |
1 |
1 |
1 |
0 |
0.0% |
|
Total R&D |
73,934 |
76,038 |
77,735 |
1,697 |
2.2% |
|
Defense R&D |
40,047 |
40,409 |
40,289 |
-120 |
-0.3% |
|
Nondefense R&D |
33,886 |
35,629 |
37,446 |
1,817 |
5.1% |
|
"FS&T"1 |
43,340 |
45,557 |
47,057 |
1,500 |
3.3% |
Table II-1. R&D in the FY 1999 Budget by Agency (budget authority in millions of dollars)
|
|
FY 1997 |
FY 1998 |
FY 1999 |
Change FY 98–99 |
|
|
|
Actual |
Estimate |
Budget |
Amount |
Percent |
|
Conduct of R&D |
|||||
|
Defense (military) |
37,116 |
37,295 |
36,891 |
-404 |
-1.1% |
|
Science & Tech. (6.1–6.3) |
7,493 |
7,800 |
7,181 |
-619 |
-7.9% |
|
All Other DOD Conduct |
29,623 |
29,495 |
29,710 |
215 |
0.7% |
|
Health and Human Services |
12,687 |
13,577 |
14,639 |
1,062 |
7.8% |
|
Nat'l Institutes of Health |
11,994 |
12,867 |
13,915 |
1,048 |
8.1% |
|
NASA |
9,038 |
9,529 |
9,184 |
-345 |
-3.6% |
|
Energy |
5,443 |
5,485 |
6,195 |
710 |
12.9% |
|
Nat'l Science Foundation |
2,248 |
2,357 |
2,655 |
298 |
12.6% |
|
Agriculture |
1,384 |
1,431 |
1,470 |
39 |
2.7% |
|
Commerce |
918 |
929 |
984 |
55 |
5.9% |
|
Interior |
582 |
601 |
622 |
21 |
3.5% |
|
Transportation |
591 |
656 |
757 |
101 |
15.4% |
|
Environ. Protection Agency |
570 |
641 |
636 |
-5 |
-0.9% |
|
Veterans Affairs |
267 |
276 |
304 |
28 |
10.1% |
|
Education |
185 |
206 |
255 |
49 |
23.8% |
|
Agency for Int'l Develop. |
169 |
150 |
154 |
4 |
2.7% |
|
Smithsonian |
137 |
141 |
149 |
8 |
5.7% |
|
Tennessee Valley Auth. |
52 |
37 |
35 |
-2 |
-5.4% |
|
Labor |
35 |
71 |
33 |
-38 |
-53.5% |
|
Nuclear Reg. Comm. |
62 |
61 |
53 |
-8 |
-13.1% |
|
Corps of Engineers |
44 |
42 |
40 |
-2 |
-4.8% |
|
Housing and Urban Dev. |
34 |
37 |
50 |
13 |
35.1% |
|
Justice |
48 |
65 |
60 |
-5 |
-7.7% |
|
Social Security |
8 |
18 |
30 |
12 |
66.7% |
|
Postal Service |
68 |
56 |
59 |
3 |
5.4% |
|
Int'l Security Assist. |
21 |
21 |
21 |
0 |
0.0% |
|
Treasury |
13 |
13 |
13 |
0 |
0.0% |
|
Arms Ctrl. & Disarm. |
1 |
1 |
1 |
0 |
0.0% |
|
Marine Mammal Com. |
1 |
1 |
1 |
0 |
0.0% |
|
Total Conduct of R&D |
71,723 |
73,697 |
75,290 |
1,593 |
2.2% |
|
Defense |
39,591 |
39,871 |
39,699 |
-172 |
-0.4% |
|
Nondefense |
32,132 |
33,826 |
35,591 |
1,765 |
5.2% |
Table II-1. R&D in the FY 1999 Budget by Agency (budget authority in millions of dollars)
Table II-2. R&D in the Department of Defense (budget authority in millions of dollars)
|
|
FY 1997 |
FY 1998 |
FY 1999 |
Change FY 98–99 |
|
|
|
Actual |
Estimate |
Budget |
Amount |
Percent |
|
Research, Development, Test, and Evaluation (RDT&E) |
|||||
|
Basic Research ("6.1") |
1,032 |
1,042 |
1,111 |
69 |
6.7% |
|
Applied Research ("6.2") |
2,822 |
2,996 |
3,020 |
24 |
0.8% |
|
Total Research |
3,854 |
4,038 |
4,131 |
93 |
2.3% |
|
Adv. Tech. Development ("6.3") |
3,639 |
3,762 |
3,050 |
-712 |
-18.9% |
|
Total Science & Technology1 |
7,493 |
7,800 |
7,181 |
-619 |
-7.9% |
|
Demons. and Valid. ("6.4") |
5,864 |
6,397 |
6,516 |
120 |
1.9% |
|
Engineering and Manufacturing Development ("6.5") |
8,536 |
8,199 |
7,987 |
-213 |
-2.6% |
|
Management Support ("6.6") |
3,465 |
3,199 |
2,771 |
-428 |
-13.4% |
|
Operational Sys. Dev. ("6.7") |
11,145 |
11,064 |
11,624 |
560 |
5.1% |
|
BA Adjustment |
-99 |
-59 |
0 |
60 |
-100.7% |
|
Total RDT&E |
36,404 |
36,600 |
36,079 |
-521 |
-1.4% |
|
Other Appropriations2 |
834 |
830 |
931 |
101 |
12.2% |
|
Total DOD R&D |
37,238 |
37,430 |
37,010 |
-420 |
-1.1% |
|
Total Conduct of R&D |
37,116 |
37,295 |
36,891 |
-404 |
-1.1% |
|
Total R&D Facilities & Equip. |
122 |
135 |
119 |
-16 |
-11.9% |
|
Source: OMB data for R&D for FY 1999, Budget of the United States Government FY 1999, and DOD "RDT&E Programs" (R-1). 1 This represents DOD's contribution to the "FS&T" budget (see Chapter 6). 2 R&D support in military personnel, military construction, and other appropriations. Character of work ("6.x" categories) are expressed in total obligational authority (TOA). BA Adjustment converts TOA into budget authority. |
|||||
|
DOD Military Budget (in BILLIONS of dollars budget authority) |
|||||
|
|
FY 1997 |
FY 1998 |
FY 1999 |
Change FY 98–99 |
|
|
|
Actual |
Estimate |
Budget |
Amount |
Percent |
|
RDT&E (see above) |
36.4 |
36.6 |
36.1 |
-0.5 |
-1.4% |
|
Military Personnel |
70.3 |
69.7 |
70.8 |
1.1 |
1.6% |
|
Operations and Maintenance |
92.3 |
94.4 |
94.8 |
0.4 |
0.4% |
|
Procurement |
42.9 |
44.8 |
48.7 |
3.9 |
8.7% |
|
Military Construction |
5.7 |
5.1 |
4.3 |
-0.8 |
-15.5% |
|
Family Housing |
4.1 |
3.8 |
3.5 |
-0.3 |
-8.7% |
|
Revolving and Management Funds |
7.7 |
2.0 |
0.6 |
-1.5 |
-71.1% |
|
Allowances and Offsets |
-1.5 |
-1.5 |
-1.5 |
0.0 |
-2.2% |
|
Total DOD Budget |
258.0 |
254.9 |
257.3 |
2.4 |
0.9% |
|
DOD military budget only (excludes civilian activities of the Corps of Engineers). |
|||||
Table II-11. R&D in the Department of Energy (budget authority in millions of dollars)
|
|
FY 1997 |
FY 1998 |
FY 1999 |
Change FY 98–99 |
|
|
|
Actual |
Estimate |
Budget |
Amount |
Percent |
|
Summary of DOE R&D (see notes at end of table): |
|||||
|
1. Energy Supply1 |
583.8 |
550.4 |
709.0 |
158.6 |
28.8% |
|
2. Science1 |
2,220.8 |
2,228.2 |
2,445.2 |
217.1 |
9.7% |
|
3. Fossil Energy |
286.6 |
276.1 |
295.0 |
18.9 |
6.9% |
|
4. Energy Conservation |
319.1 |
355.8 |
454.6 |
98.8 |
27.8% |
|
5. Atomic Energy Defense |
2,809.2 |
2,978.6 |
3,278.6 |
300.0 |
10.1% |
|
6. Clean Coal Technology2 |
-2.1 |
-101.0 |
-40.0 |
— |
— |
|
Total DOE R&D |
6,217.4 |
6,288.1 |
7,142.4 |
854.3 |
13.6% |
|
1. Energy Supply1 (does not include non-R&D components) |
|||||
|
Solar and Renewable Energy |
237.1 |
266.9 |
356.8 |
89.9 |
33.7% |
|
Nuclear Energy |
130.3 |
61.4 |
130.7 |
69.3 |
112.9% |
|
Fusion Energy Sciences |
216.4 |
222.1 |
221.5 |
-0.6 |
-0.3% |
|
Total Energy Supply R&D1 |
583.8 |
550.4 |
709.0 |
158.6 |
28.8% |
|
2. Science1 (does not include non-R&D components) |
|||||
|
High-Energy Physics |
657.1 |
673.0 |
686.0 |
13.1 |
1.9% |
|
Nuclear Physics |
310.0 |
319.8 |
332.6 |
12.8 |
4.0% |
|
Basic Energy Sciences |
|||||
|
Materials Sciences |
368.5 |
391.0 |
417.2 |
26.2 |
6.7% |
|
Chemical Sciences |
194.5 |
200.7 |
209.6 |
8.9 |
4.4% |
|
Engineering & Geosciences |
40.9 |
41.2 |
44.4 |
3.2 |
7.8% |
|
Energy Biosciences |
27.3 |
27.4 |
32.5 |
5.1 |
18.5% |
|
Equipment & Construction4 |
11.5 |
7.0 |
132.4 |
125.4 |
1791.4% |
|
Adjustment |
-9.7 |
-4.8 |
0.0 |
4.8 |
-100.0% |
|
Total BES |
633.0 |
662.5 |
836.1 |
173.6 |
26.2% |
|
Computational and Technology Research |
|||||
|
Math., Info. and Compu. Sci. |
114.8 |
127.2 |
141.3 |
14.1 |
11.1% |
|
Laboratory Technology Res. |
23.7 |
15.8 |
16.3 |
0.5 |
3.4% |
|
Advanced Energy Projects |
11.4 |
7.6 |
3.0 |
-4.6 |
-60.4% |
|
Adjustment |
-2.6 |
-1.7 |
0.0 |
1.7 |
-100.0% |
|
Total CTR |
147.3 |
148.9 |
160.6 |
11.8 |
7.9% |
Table II-11. R&D in the Department of Energy (budget authority in millions of dollars)
|
|
FY 1997 |
FY 1998 |
FY 1999 |
Change FY 98–99 |
|
|
|
Actual |
Estimate |
Budget |
Amount |
Percent |
|
Biological and Environmental Research |
|||||
|
Life Sciences |
143.5 |
165.2 |
162.0 |
-3.2 |
-1.9% |
|
Environmental Processes |
109.1 |
108.4 |
119.2 |
10.8 |
10.0% |
|
Environmental Remediation |
34.9 |
66.3 |
67.4 |
1.1 |
1.7% |
|
Medical Apps./ Measurement |
56.6 |
66.0 |
43.9 |
-22.1 |
-33.4% |
|
Construction |
36.1 |
0.0 |
0.0 |
0.0 |
— |
|
Adjustment |
-6.7 |
-4.4 |
0.0 |
4.4 |
-100.0% |
|
Total BER |
373.5 |
401.5 |
392.6 |
-8.9 |
-2.2% |
|
Energy Research Analyses |
1.5 |
1.3 |
1.0 |
-0.3 |
-24.7% |
|
Univ. & Science Education |
0.0 |
0.0 |
15.0 |
15.0 |
— |
|
Small Bus. Innov. Research |
79.2 |
0.0 |
0.0 |
0.0 |
— |
|
Multiprogram Lab Support |
19.2 |
21.2 |
21.3 |
0.1 |
0.4% |
|
Total Science1 |
2,220.8 |
2,228.2 |
2,445.2 |
217.1 |
9.7% |
|
3. Fossil Energy R&D (does not include non-R&D components) |
|||||
|
Coal |
100.9 |
107.4 |
130.0 |
22.6 |
21.1% |
|
Petroleum |
45.2 |
48.6 |
50.2 |
1.6 |
3.3% |
|
Gas |
117.3 |
111.2 |
109.6 |
-1.7 |
-1.5% |
|
Cooperative R&D |
5.4 |
5.8 |
5.8 |
0.0 |
-0.1% |
|
Other R&D programs |
7.0 |
7.5 |
7.6 |
0.1 |
1.4% |
|
Adjustments and deduct non-R& |
10.8 |
-4.4 |
-8.2 |
-3.8 |
84.7% |
|
Total Fossil Energy R&D |
286.6 |
276.1 |
295.0 |
18.9 |
6.9% |
|
4. Energy Conservation (does not include non-R&D components) |
|||||
|
Building Technologies |
80.1 |
78.8 |
126.4 |
47.7 |
60.5% |
|
Industrial Technologies |
115.4 |
136.2 |
166.6 |
30.4 |
22.3% |
|
Transportation Technologies |
172.5 |
193.3 |
246.1 |
52.8 |
27.3% |
|
Adjustments and deduct non-R& |
-48.9 |
-52.4 |
-84.5 |
-32.1 |
61.2% |
|
Total Energy Conservation |
319.1 |
355.8 |
454.6 |
98.8 |
27.8% |
|
5. Atomic Energy Defense Activities (does not include non-R&D components) |
|||||
|
Weapons Activities |
|||||
|
Stockpile Stewardship |
|||||
|
ASCI* |
151.6 |
223.5 |
329.1 |
105.6 |
47.2% |
Table II-11 R&D in the Department of Energy (budget authority in millions of dollars)
|
|
FY 1997 |
FY 1998 |
FY 1999 |
Change FY 98–99 |
|
|
|
Actual |
Estimate |
Budget |
Amount |
Percent |
|
Other Programs and Initiatives |
220.0 |
231.7 |
300.8 |
69.2 |
29.9% |
|
Core Res. and Adv. Tech. |
557.1 |
593.7 |
645.9 |
52.2 |
8.8% |
|
Testing Capab. & Readiness |
166.0 |
180.4 |
183.9 |
3.5 |
1.9% |
|
Core Steward. Equip. & Const |
129.6 |
150.6 |
161.7 |
11.1 |
7.3% |
|
Inertial Confinement Fusion |
234.6 |
215.7 |
213.8 |
-1.9 |
-0.9% |
|
National Ignition Facility |
131.9 |
197.8 |
284.2 |
86.4 |
43.7% |
|
Tech. Partnerships and Edu. |
69.4 |
64.8 |
69.0 |
4.2 |
6.4% |
|
Adjustment |
-3.4 |
-0.5 |
0.0 |
0.5 |
-100.0% |
|
Total Stockpile Stewardship |
1,656.8 |
1,857.8 |
2,188.4 |
330.6 |
17.8% |
|
Other Weapons Activities R&D |
33.4 |
31.9 |
73.6 |
41.7 |
130.5% |
|
Total Weapons Activities R& |
1,690.2 |
1,889.7 |
2,262.0 |
372.3 |
19.7% |
|
Naval Reactors |
681.9 |
670.5 |
665.5 |
-5.0 |
-0.7% |
|
Nonproliferation & Verification |
211.9 |
210.0 |
210.0 |
0.0 |
0.0% |
|
Nuclear Safeguards & Security |
24.0 |
23.6 |
23.6 |
0.0 |
0.0% |
|
Environmental Management |
197.5 |
180.3 |
113.0 |
-67.3 |
-37.3% |
|
Intelligence |
3.7 |
4.5 |
4.5 |
0.0 |
0.0% |
|
Total Atomic Defense R&D |
2,809.2 |
2,978.6 |
3,278.6 |
300.0 |
10.1% |
|
6. Clean Coal Technology2 |
-2.1 |
-101.0 |
-40.0 |
— |
— |
|
Total DOE R&D |
6,217.4 |
6,288.1 |
7,142.4 |
854.3 |
13.6% |
|
Conduct of R&D |
5,442.7 |
5,484.7 |
6,194.8 |
710.1 |
12.9% |
|
R&D Facilities |
774.7 |
803.4 |
947.6 |
144.3 |
18.0% |
|
DOE "FS&T"3 |
5,369.5 |
5,437.2 |
6,293.0 |
855.8 |
15.7% |
|
Source: Agency budget justification and agency supporting documents. * -Accelerated Strategic Computing Initiative. 1 DOE has changed its appropriation account structure. Programs in the General Science and Research account and selected programs in Energy Supply have been shifted to a new "Science" account. The table shows DOE programs under the new account structure. 2 Negative because of rescissions and deferrals of previously appropriated funds. 3 DOE contribution to the "FS&T" budget. Please see Chapter 6. 4 Includes $128 million in FY 1999 for the National Spallation Neutron Source. |
|||||
Table II-11. Department of Energy R&D
Department of Energy Budget (budget authority in millions of dollars)
|
|
FY 1997 |
FY 1998 |
FY 1999 |
Change FY 98–99 |
|
|
|
Actual |
Estimate |
Budget |
Amount |
Percent |
|
Weapons Activities |
3,911 |
4,147 |
4,500 |
353 |
8.5% |
|
Defense Environmental Restoration |
4,398 |
4,296 |
4,260 |
-37 |
-0.9% |
|
Defense Facilities Closure Projects |
862 |
996 |
1,006 |
10 |
1.0% |
|
EM Privatization |
330 |
200 |
517 |
317 |
158.4% |
|
Nuclear Waste and Other Defense |
1,829 |
1,829 |
1,857 |
28 |
1.6% |
|
Total DOE Defense |
11,331 |
11,468 |
12,140 |
672 |
5.9% |
|
Science |
2,267 |
2,236 |
2,482 |
247 |
11.0% |
|
Energy Supply |
944 |
1,024 |
1,129 |
105 |
10.3% |
|
Fossil Energy |
359 |
362 |
383 |
21 |
5.8% |
|
Energy Conservation |
534 |
591 |
774 |
182 |
30.9% |
|
Other Energy Programs |
165 |
40 |
290 |
250 |
622.1% |
|
Nondefense Environmental Mngm |
572 |
494 |
462 |
-32 |
-6.5% |
|
Power Marketing Administrations |
223 |
230 |
235 |
4 |
1.9% |
|
Departmental Administration & IG |
154 |
115 |
139 |
24 |
20.7% |
|
Total DOE Budget |
16,547 |
16,561 |
18,035 |
1,474 |
8.9% |
|
Source: Department of Energy budget justification. DOE appropriations only (does not include offsets and mandatory). Includes R&D and non-R&D components. |
|||||


