
5
EVALUATION OF THE LATRA EXPOSURE-RESPONSE FUNCTIONS
THE purpose of this chapter is to evaluate whether the forms of the ERFs used in the LATRA for HCl, NO2, and HNO3, are representative of the relationship between exposure and the probability of health effects. Particular attention is given to the following questions:
-
What is the appropriate independent variable or variables for the ERF (maximum concentration, time-weighted-average (TWA) concentration over a defined duration, such as 5, 10, or 60 min, or the product of concentration and time)?
-
What is the appropriate form of the ERF models (probit, logistic, or other)?
-
What is the appropriate process for accounting for variation in sensitivity among individuals and identifiable sensitive subgroups in an exposure-response framework?
-
What is the appropriate process for distinguishing among mild, moderate, and severe health effects in an exposure-response framework?
-
What is the optimal process for quantifying the relation between exposure concentration and health effect using existing toxicological information on the likely incidence, sensitivity of individuals, and severity of effect?
-
How should uncertainty in the estimates of risk of effects from exposure to single and multiple rocket emissions be represented in the LATRA-ERF model?
This chapter is divided into three sections. In the first section, the subcommittee evaluates the current structure of the LATRA-ERF model
relative to the questions listed above. In the second section, the subcommittee suggests alternative methods for deriving ERFs that could eliminate some of the limitations in the current approach. The third section presents the subcommittee's conclusions and recommendations regarding use of the current and alternative approaches to the LATRA-ERF framework.
THE LATRA-ERF MODEL
To assess the appropriateness of the LATRA-ERF model, the subcommittee considered six issues: (1) selection of the independent variable; (2) choice of the exposure-response model; (3) representation of sensitive populations; (4) representation of severity categories; (5) selection of the chemical-specific exposure-response values to which an ERF is fit; and (6) representation and propagation of uncertainties in LATRA. During its evaluation, the subcommittee members identified a few other features of the LATRA model that they felt needed comment.
SELECTION OF INDEPENDENT VARIABLES
In the LATRA-ERF model, the independent variable for assessing health effects is the maximum 1-hr TWA concentration or, in some cases, a ceiling concentration. There are alternatives to those independent variables. The subcommittee's review of the sparse toxicity data for the compounds in question (Appendices D, E, and F) indicates that the product of concentration and time (C × T) or (C × T x) appears to be a more appropriate independent variable for exposure times ranging from 5 to 60 min, at least for severe effects and mortality for HCl and NO2 (see Chapter 6). Use of the product of exposure concentration and time as the independent variable allows estimation of the risks associated with exposures of different durations using a single ERF. With C × T x as the independent variable for exposures from 5 to 60 min, it also is not necessary to set a ceiling concentration; the 5-min peak concentration that REEDM can estimate (it does not estimate shorter peak concentrations) is within the range of exposure durations over which the C × T x relationship holds.
For effects for which the relationship between effect and the product of concentration and time is unknown, as might be the case for mild and moderate effects, a TWA concentration for specific exposure dura-
tions (e.g., 10 and 30 min) would be a more appropriate independent variable. The subcommittee believes that 1 hr is too long an averaging time for the exposure estimate and the toxicity value because of the typical speed with which a ground plume from a rocket launch passes over an exposure location (see Appendix A); periods of 10 to 30 min would match the exposure situation more accurately.
CHOICE OF EXPOSURE-RESPONSE MODEL
Exposure-response (or dose-response) models can be grouped into four major categories: (1) safety-factor models that estimate a safe dose for a defined population and a margin of exposure (MOE) relative to that dose (i.e., the difference between the safe dose and typical environmental exposures); (2) statistical models, such as probit or logistic models, that use observed statistical population sensitivity distributions fit to a probability distribution; (3) stochastic models, such as multihit and multistage models used for radiation-and chemical-induced cancer effects; and (4) biological-mechanism-based models. The LATRA dose response model is intended to be a stochastic model in which the probit model represents a stochastic distribution of probability of response for a given level of severity among the population (see Chapter 2; Lloyd Philipson, ACTA Inc., personal commun., Jan. 15-16,1997). Thus, in the LATRA model, all individuals in the population subgroup represented by the ERF are considered equally sensitive, but owing to random events, there is a probability distribution describing the likelihood of an individual suffering an effect. However, that is a departure from existing practice in toxicology in which probit or lognormal models are used to represent the variation in sensitivity to a toxic compound among individuals in a specified population.
In the LATRA-ERF model, a "safe" dose for health effects has been used in place of human data to construct the lognormal distribution, and that distribution has been interpreted as a stochastic, rather than statistical, model. That construct includes the implicit assumption that a safe exposure dose established by applying safety factors to animal or human toxicity data can be interpreted as a stochastic measurement. Because safety factors are used only to establish safe levels for healthy or sensitive populations, using safety factors to construct a stochastic exposure-response distribution goes beyond the intended use of those
factors. Moreover, the LATRA ERF is reasonably interpreted as a statistical model because the probit (lognormal) function can be used to represent the variation in (or the distribution of) sensitivity among individuals in a target population. Thus, the LATRA-ERF model appears to be a hybrid between a safety-factors model and a statistical model, rather than the stochastic model it is stated to be.
This hybrid model introduces a problem of perception on the part of users. It suggests that the ERF is more accurate and precise than actually is true. In applying the ERF as a probit model, the user might believe (or perceive) that the model is a reliable tool for estimating the fraction of the population that is likely to experience a health effect at a given magnitude of exposure. That model is accurate, however, only when the parameters of the probit model are fit to actual exposure versus-incidence data.
Without actual incidence data from humans or animals, it is difficult to endorse the use of exposure-response models that predict incidence of some effect type or severity, unless they are constructed using an expert elicitation process (e.g., see Evans et al. 1994). Except for the ease of use, particularly for anchoring the low and high incidence ends of the sensitivity distribution with sparse effects data, it is not clear why the probit model was used instead of other models.
SENSITIVE SUBGROUPS
In theory, a probit model should be able to capture large variations among individuals in sensitivity to a toxic substance. Because the explicit purpose of a statistical model (e.g., probit model) is to construct a response function for a population with a distribution of sensitivities among the members of a population, a properly constructed probit (or logistic model) should by definition include both sensitive and healthy individuals. As a dose-response model used in toxicology, the probit model represents each individual as having a different dose at which he or she will exhibit the response.
Thus, the subcommittee considered whether the sensitive populations and healthy populations should be represented by separate ERFs or should be considered members of a single population that can be represented by a single distribution ranging from the more sensitive to the more resistant individuals (as depicted in Figure 4-1A). Historical precedent provides little assistance in answering that question; the Com-
mittee on Toxicology (COT) and other organizations generally account for subgroups likely to be more sensitive than healthy adults by applying safety factors to ensure that a threshold for response is not exceeded. There is no precedent, however, for using safety factors to estimate dose-response curves.
The most recent version of the LATRA ERFs for ceiling concentrations appears to be constructed by using a factor of 1 for HCl, 2 for NO 2, and 13 for HNO3 to convert C01 ceiling concentrations (concentrations associated with a 1% response rate) for normal populations to C01 ceiling concentrations for the sensitive populations (see Table 2-1). (In an earlier version of the ERFs, other factors were used; Philipson et al. 1996) The toxicological bases for those three values are not clear. In the absence of data on sensitive populations, it is common practice among risk assessors to assume that the sensitive population is 10-fold more sensitive (see Chapter 3). In the past, COT concluded that it was reasonable to use factors of 2 to 10 to extrapolate between healthy and sensitive populations (NRC 1986). Data presented in Chapter 3 (and Appendices D, E, and F) indicate that the threshold for response for individuals with asthma and COPD might be lower than that for healthy individuals, on average, by a factor of 3 for HCl, 10 for NO2, and 2O for HNO3.
The Air Force proposes to include separate ERFs for healthy and sensitive populations so that the estimated number of people affected will be lower as the proportion of sensitive individuals in the area over which an exhaust plume is expected to pass decreases. However, with no data on how the slopes of the ERFs should differ between sensitive and normal subgroups, it is difficult to justify any particular relation between the ERF for sensitive individuals and the ERF for a healthy population beyond the relation between the concentrations associated with a threshold for response.
Another attribute of the LATRA ERFs of concern to the subcommittee is truncating the ERF at the 1% lower bound of incidence (if that value does indeed represent a 1% incidence level). The LATRA-ERF model predicts that no one is affected below the concentration associated with the 1% incidence level.
SEVERITY OF EFFECTS
In LATRA, separate ERFs were developed for different categories of severity of effect—mild and serious—rather than for specific health end
points (e.g., cough or fibrosis). No clear explanation is given of how the upper-bound concentration associated with a 99% incidence of mild effects and the lower-bound concentration associated with a 1% incidence of serious effects were established for the LATRA ERFs. Ideally, the Air Force would first develop ERFs by using end points that can be clearly described (e.g., infrequent-to-moderate coughing or 20% increase in airway resistance) and then decide how to classify one or more ERFs or parts of ERFs for those specific end points into a severity category. By developing ERFs in value-based severity categories before adequate data are available, the Air Force is implicitly incorporating value judgments about severity into the ERFs in the absence of a documentable rationale. Moreover, if the Air Force were to change its valuation of the severity of different types of health effects because of a change in policy, the ERFs would have be recalculated. If ERFs were developed first by health end point, the value judgments concerning severity could be made explicit after the ERFs were fit to actual toxicity data associated with clearly described health end points.
EXPOSURE-RESPONSE VALUES
An ERF for the LATRA model is constructed by assuming that exposures considered safe correspond to 1% incidence and that the 99% incidence is 5 times the 1% incidence level for sensitive individuals and 10 times the 1% incidence level for healthy individuals (see Chapter 2). The subcommittee notes that this procedure is likely to be less accurate, possibly substantially less accurate, than fitting the ERF log-probit model to actual incidence data.
The subcommittee notes that ERFs need not be specified by symmetrical percentiles or percentiles at the extremes of the distribution. That observation is important, especially because animal and human studies seldom yield those percentiles directly. The 50th percentile is often the most precise point in a distribution, and use of all available data should provide the most accurate probability distribution to represent the toxicity of the agent.
In the absence of human incidence data, it might not be possible to develop accurate ERFs. Nevertheless, it should be possible to character-
ize the level of uncertainty associated with anchoring the probit curve by assigning a safe dose to the 1st percentile of the curve and some multiple of that to the 99th percentile. That uncertainty can be investigated through such questions as: (1) What are the appropriate percentiles to use in estimating a curve? and (2) How sensitive is the prediction of incidence to the percentiles used? One way to examine those questions is to consider an example in which several lognormal (i.e., log-probit) distributions of exposure versus the fraction of incidence have the same median value, and examine how the prediction of risk varies with the choice of percentiles used to anchor the ERF. That is done in Figure 5-1, where three ERFs for moderate effects for NO2 are derived for healthy and sensitive populations under the assumption that the concentration at which moderate effects are seen (assumed to be 4 ppm for healthy adults and 2 ppm for sensitive populations for purposes of illustration only) correspond to the 0.1%, 1%, or 5% lower bounds of a lognormal distribution and that the upper bound of the ERF (assumed to be 40 ppm for healthy adults and 10 ppm for sensitive populations for purposes of illustration only) correspond to the 95%, 99%, and 99.9% upper bounds on the exposure-response curves. Figure 5-1 illustrates that although the central portion of the ERF is not sensitive to the assumptions regarding the incidence associated with the anchor-point concentrations, the tails are. Moreover, it is the lower tail of the distribution that is most important to the Air Force risk estimates (e.g., risk of effect of 1 in 5,000, 3 in 1,000, or 1 in 100 persons). The use of actual human incidence data would improve the accuracy of the ERF predictions.
REPRESENTATION OF UNCERTAINTIES
The subcommittee is concerned that many uncertainties in the LATRA-ERF model are not expressed or not appropriately quantified in the final model output. For example, in the procedures for applying the ERFs in LATRA, binomial distributions obtained from the PE(S, C,T ) distributions are combined by adding their means and variances to obtain the mean and variance of the total number of people suffering a given severity of
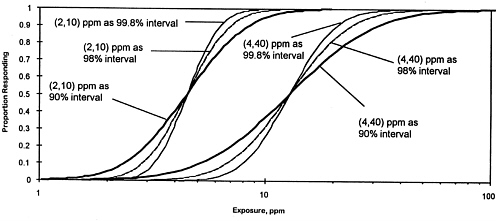
FIGURE 5-1 Sensitivity of the ERF for NO2 to assumptions regarding interpretation of bounding values used to set cumulative distribution of the proportion of the population experiencing the effect. The curves on the left are the ERFs for sensitive populations with bounding values of 2 and 10 ppm. The heavy curve corresponds to the assumption that 2 and 10 ppm represent the 90% interval for response; 2 ppm is the concentration at which 5% of the sensitive population responds, and 10 ppm is the concentration at which 95% of the sensitive population responds. The two light curves correspond to the assumption that 2 and 10 ppm represent the 98% and 99.8% interval for response. The curves on the right are the similar ERF curves for healthy populations with bounding values of 4 and 40 ppm.
effect at a particular receptor location. However, it is not clear to the subcommittee why the PE function is used in a binomial to estimate the number of effects within a subpopulation. It should be recognized that
n(N,S,C,T ) = sum(i = 1,2,. . . N ) {i × Pbnml[i,N,PE(S,C,T )]} = N × PE(S,C,T ), i.e.,
n(N,S,C,T ) = N × PE(S,C,T ).
Thus, there is no need to use the binomial distribution to estimate the expected numbers of health effects of a given severity. The variance that comes out of that approach is the variance associated with the application of the binomial to the population in a Monte Carlo simulation and excludes the variance in the function PE(S,C, T). The binomial procedure does not provide an opportunity to estimate the uncertainty in the ERFs. The binomial distribution is an appropriate distribution form for constructing a mixed distribution under Monte Carlo simulation.
The use of the binomial distribution assumes a homogenous subgroup in which every individual has exactly the same probability of developing an adverse health effect for a given exposure. Unless the subgroup is indeed homogenous, the use of the binomial distribution in this way will underestimate risk. By using the binomial model to characterize the number of effects in a finite population, the variance that results is that associated with repeatedly applying a model that is relevant to a large population to a small sample of that population. The subcommittee believes that this is not the appropriate variance for communicating the uncertainty associated with an ERF. The relevant variance for the ERF is the estimation error associated with fitting the logprobit model to actual exposure-response data (examples provided in Chapter 6).
OTHER FEATURES OF LATRA
The subcommittee notes that the method of estimating the potential for additive effects of simultaneous exposure to different compounds with similar modes of action in the LATRA model is likely to underestimate risks. The LATRA model simply estimates the joint probability of an effect from the independent probabilities; it does not allow for the possibility that the compounds are dose additive (i.e., exposure to sub-
threshold concentrations of both compounds at the same time could result in a response) or that simultaneous exposure to concentrations associated with mild responses for each compound singly could result in a severe response.
For the agents under consideration, the subcommittee is of the opinion that, in the event of a catastrophic abort when more than one of the compounds could be released simultaneously, additive effects are possible, even likely (synergistic effects are unlikely). EPA (1986) described three methods that could be used to conduct a quantitative risk assessment for mixtures of toxic substances. Their use depends on the availability of data on the mixtures and on the components of the mixtures. (A discussion of the use of these methods is in Seed et al. 1995.) The preferred method is to use data obtained from testing the actual mixture to assess the potential for health effects from exposure to the mixture. The next preferred method is to use data obtained from testing one or more mixtures with compositions similar to the mixture of interest. The third method that the EPA recommends is the component-based method, which involves assessing the risk posed by exposure to individual components of the mixture. Data from risk assessments of individual components are then used to estimate the risk from exposure to the mixture of interest by assuming a dose-additivity model for systemic toxicants and a response-additivity model for carcinogens (Seed et al. 1995). These methods have also been discussed by the NRC (1988, 1994). For the three rocket-emission toxicants reviewed in this report, it is the opinion of the subcommittee that the dose-additivity model would be appropriate.
The subcommittee is concerned with the procedure of combining risk estimates from normal launch scenarios, multiplied by the probability of a normal launch, with risk estimates from accident scenarios, multiplied by the probability of an accident, to determine the expected risk from a launch event. It is not common or accepted practice in risk assessment to combine risks for conditional events. The risks from an aborted launch are conditional on the probability of an aborted launch, and that information should be appropriately communicated in the results presented to the base commander. By combining the likelihood of a catastrophic abort and the relatively high risks associated with that event with the relatively low risks associated with a normal launch, the Air Force loses information on the event that is most likely to occur (i.e., information on risks associated with a normal launch).
It was not clear from either the technical material presented to the subcommittee or from discussions with the Air Force how the maximum 1-hr TWA concentration is selected from the output of REEDM. From the perspective of a given receptor location, the chemical concentration in the plume will first rise and then fall as the plume passes over a receptor location. It must be recognized that there are many ways to cut the resulting concentration-over-time profile into 60-min segments. It is unclear how or whether the LATRA model selects the highest 60-min concentration or ceiling concentration from the time-varying concentration at a given location.
Many of the ERFs have very steep slopes, ranging from essentially zero incidence to 100% incidence over roughly an order of magnitude change in concentration. Given that atmospheric models can at best only predict concentrations within a factor of 2 or 3 at a single location (Turner 1994), the subcommittee is concerned about the reliability of the overall process with such models for estimating incidence of health effects in exposed populations.
ALTERNATIVE APPROACHES
As discussed in Chapters 3 and 4, dose-response curves are used to provide two types of information—(1) the relationship between dose and incidence of effect in a group of subjects and (2) the relationship between dose and severity of effect. Most dose-response models provide only one of those relationships but not both. The LATRA-ERF model is designed primarily to provide incidence data. As part of the process for evaluating the LATRA-ERF, the subcommittee explored the capabilities and limitations of a number of alternate approaches to the current LATRA-ERF model. Particular attention was given to approaches that include both severity and incidence information in a single model, such as ordinal regression. The results of those evaluations are summarized in this section.
GENERAL CONSIDERATIONS IN DOSE-RESPONSE MODELS
The purpose of the LATRA-ERF is to provide a model that links the expected number and severity of effects with both exposure concentra-
tion and exposure duration. There are a number of alternative formulations for defining this relationship—ranging from simple threshold models to complex multiple regression models. Model selection depends on the quantity and quality of the available data.
In the most general sense, the subcommittee considered a model of the form
P(Y ≥ S|C,T) = function (Y,S,C,T ),
where P(Y ≥S|C,T ) is the ERF for an exposure characterized by concentration, C, and time, T, and is equal to the probability of the severity of effect, Y , equaling or exceeding a given severity category, S, at a specified exposure concentration, C, and duration T .
The simplest form of this model, based on the use of a single population threshold, is
P(Y ≥ S|C,T) = 1 when C > threshold (T,Y) and = 0 otherwise.
The next level of complexity would give a simple probit model:
P(Y ≥ S|C,T ) = O(A + B × C) for each Y and T (5, 10, 60 min etc.);
or a more complex probit model:
P(Y ≥ S|C,T ) = O[A + B × (CTg)] for each Y 2.
Setting g = 1 would result in a strict Haber's rule model. Haber's rule states that the biological effects of some types of toxicants tend to be related to the total cumulative exposure (area under the concentration time curve). For a strict Haber's rule model, the total exposure for risk estimation is the TWA concentration (C) multiplied by the time (T) (duration of exposure).
Another model at this level of complexity would be a logistic model, which would take the form
P(Y ≥ S|C,T ) = exp[A + B × (CTg)]/{1+ exp[A + B × (CTg)]} for each Y.
With the same data (i.e., the same 1% and 99% bounds), the probit and
the logistic models give similar results in the 1% to 99% incidence range. However, these two models give significantly different results outside the data range for which they are calibrated. The logistic model is more flexible in handling exposure concentration versus time. Figure 5-2 compares the predictions of the two models for estimating an ERF for NO2.
ORDINAL REGRESSION
Ordinal regression is an example of a more comprehensive and flexible approach for relating both incidence and severity of effects to both exposure concentration and duration. Ordinal regression was first proposed by Hertzberg and Miller (1985) and later was refined by Guth et al. (1991). In this approach, health effects are first assigned to severity categories based on evaluation of the reported information and consideration of biological and statistical significance. The aggregate group of subjects at any particular exposure concentration and duration is classified as giving evidence of a specific severity of response. A model, such as the logistic regression model, is applied using the severity code as the dependent variable and the exposure concentration and exposure duration as the independent variables. For any level of severity, the output of the regression provides a concentration-by-duration profile (both central estimates and confidence-limit estimates) for any desired risk level.
The ordinal regression model continues to be refined and applied to some specific chemicals and data (Simpson et al. 1996), but the data requirements and complexities of the model fitting make the model infeasible for routine use or use in LATRA. The available toxicity data for HCl, NO2, and certainly for HNO3, include few or no studies with dose-response data for non-lethal effects. Ordinal regression also requires that levels of severity are assigned to effects data prior to developing the regression model. Any changes in interpretation of the severity of various signs or symptoms would require that the ordinal regression model be recalculated. Finally, in this method, the imprecision of the estimate of the probability of an effect in a given severity level is reflected in the confidence-limit estimate for the central tendency. Thus, a statistical refinement of the LATRA model would be required to derive estimates of the risk or incidence of individuals suffering an effect of at least a given severity level.
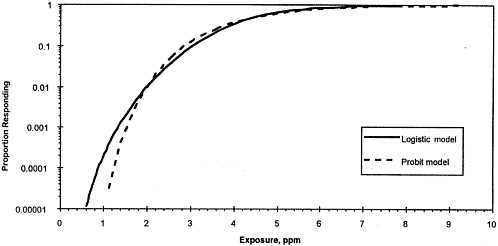
FIGURE 5-2 Sensitivity of the ERF for NO2 to the dose-response model. The two dose-response curves for the sensitive population correspond to the assumption that 2 ppm results in a 1% incidence and 10 ppm results in a 99% incidence. The two dose-response models are similar in their predictions down to an exposure of about 2 ppm. Below that concentration, the logistic model gives a higher fraction of response at a given concentration of exposure. At 1 ppm, the fraction of response predicted by the two models differs by more than an order of magnitude.
MAXIMUM ENTROPY INFERENCE
The maximum-entropy-inference (MEI) method uses subjectivity to develop distribution functions with sparse data (Lee and Wright 1994). Entropy, in its strictest definition, is a tendency toward disorder. When an attempt is made to maximize the entropy of a distribution, conclusions are made about the data but made in a way that is inclusive of all variance—both variance associated with variability (due to inherent randomness in the observed populations) and variance associated with uncertainty (due to measurement error, observation error, or lack of knowledge). The entropy of a distribution, H , is defined as a measure of its uncertainty. The method requires a constraint and maximizes the uncertainty of the model distribution given that constraint. Examples of constraint are a range limitation (minimum and maximum values), a bound on the median or mean, or a constraint on some other characteristic of a distribution including a variance value or percentile values. In a certain sense, the MEI method chooses a shape, given what is known (i.e., the constraints), that provides a maximum spread of information with a minimum chance of any plausible outcome being excluded from the range of outcomes produced. This method is only as biased as the methods used to estimate the constraints. It requires, however, knowledge of the scale at which the data are distributed; it must be decided whether to maximize the uncertainty in the units of the data or in the transformed state (e.g., log transform). The method provides a distribution that maximizes H, given the entropy is calculated as
H = ∫ p(x) log2p(x)dx
for continuous distributions. If the Air Force wishes to pursue the development of ERFs further, it would be appropriate for it to consider whether the MEI approach would be useful for characterizing the uncertainty in the exposure-response relationship.
HAZARD-QUOTIENT-HAZARD-INDEX APPROACH
The hazard-quotient model is simply a comparison of the estimated exposure concentration (EEC) to a NOEL or other reference toxicity
|
Hazard-Index (HI) Calculation HI = EEC1/RTV1 + EEC2/RTV2 + . . . +EECi/RTVi where EECi = estimated environmental concentration for the ith contaminant; and RTVi = reference toxicity value (e.g. a NOEL) for the ith contaminant. Individuals for which the HI > 1 are assumed to be at risk of a an effect from exposure to the combination of contaminants. The EEC and RTV values should be expressed in the same way. Thus, if the RTV is expressed as exposure concentration multiplied by time (C × T), the EEC should also be in units of C × T; if the RTV is a function of C for a specified duration, the EEC should be expressed as a concentration for that exposure duration. |
value (RTV) (e.g., threshold for moderate effects). The Air Force's comparison of its tier limits to the exposure concentrations estimated by REEDM is an example of the hazard-quotient model. Usually, the RTV is developed so that it is a conservative estimate of a threshold concentration (or dose) above which some health effects might occur in some individuals and below which, effects are considered unlikely to occur in most or all individuals in a specified group or population. Thus, when the ratio of the EEC to the RTV is less than 1 (i.e., the quotient EEC/ RTV is less than 1), effects are considered unlikely. When the quotient is greater than 1, some effects might occur in some individuals. Interpretation of the ratio of the two values depends on the uncertainty associated with each. As the value of the EEC/RTV increases, both the severity and incidence of effect are likely to increase, but the ratio is not used to predict incidence or severity.
Estimating the number of people exposed at levels above RTVs using the hazard-quotient model would not produce risk estimates that are more precise or accurate than the available toxicity data would warrant. RTVs can be developed to represent no-observed-effect levels (NOELs) or thresholds for mild, moderate, and severe effects. In a risk
assessment, the magnitude of an EEC/RTV estimate also can be useful information to a risk manager, even though that value cannot be related to incidence or severity of effect. An additional advantage of the hazard-quotient model is that it allows estimation of the number of people at risk of additive effects from simultaneous exposure to two or more substances, a consideration that is not appropriately represented in the LATRA model and that would be difficult to develop in the ERF framework.
To apply dose-additivity to the hazard-quotient approach, it is only necessary to sum the hazard quotients for the individual emission toxicants (see text box). That sum is commonly called the hazard index (EPA 1989). A hazard index should be estimated separately for each exposure duration or C × T modeled. A risk of a health effect is assumed to exist at those exposure locations where the hazard index exceeds 1. As was the case for the individual hazard quotients, interpretation of hazard indices greater than 1 depends on the assumptions inherent in the estimate of exposure and estimate of a NOEL or other RTV, and hazard indices cannot be associated with incidence of effects.
CONCLUSIONS AND RECOMMENDATIONS
Overall the subcommittee does not endorse use of the LATRA-ERF model as it currently is constructed. The ERFs give the appearance of substantial accuracy, yet are not supported by the available toxicological information. The subcommittee suggests, as a possible alternative, application of the hazard-quotient-hazard-index approach to risk characterization for the rocket-emission toxicants. However, if the Air Force wants to pursue the LATRA-ERF model (e.g., using expert elicitation to establish ERFs), there are ways to improve that framework. The subcommittee's conclusions and recommendations regarding each of the six issues are described below. A few recommendations on other features of LATRA also are provided.
SELECTION OF THE INDEPENDENT VARIABLE
The ERFs in LATRA are currently based on 1-hr TWA concentrations and ceiling values. The subcommittee believes that 1 hr is too long an
averaging period because of the typical speed with which the ground cloud of emissions from a rocket launch pass over a given exposure location; increments of 10 to 30 min would match the exposure situation more accurately. The subcommittee endorses the use of ceiling values for noncumulative effects. The subcommittee also identified some effects for which the product of exposure concentration and time (C × T) would be appropriate. It recommends that sensitivity of the LATRA output to the selection of the independent variable be examined. The evaluation should include how the estimates of the number of health effects in a given category of severity (e.g., mild or severe) depend on (1) which independent variable (the TWA concentration or the total cumulative exposure) is used and (2) which averaging time is used to estimate the TWA concentration in the ERF. If the TWA concentrations for 10, 30, and 60 min are used, those results should be compared with the results of using total cumulative exposure (C × T or the time integral of concentration).
CHOICE AND QUANTIFICATION OF EXPOSURE-RESPONSE MODEL
A log-probit model is an appropriate analytic form for a dose-response model that will be used to estimate incidence of effects. A key weakness of the current derivation of LATRA ERFs, however, is that a dose-response model for predicting incidence is derived from concentrations that are used to define safe levels (at the lower bound) and dangerous levels (at the upper bound). The subcommittee does not believe that it is appropriate to assume that no health effects occur below a 1% incidence level for mild effects. Nor does the subcommittee believe that it is appropriate, in the absence of supporting data, to interpret a concentration that is 5- or 10-fold higher than a 1% incidence level as the concentration at which all individuals are likely to show those responses. More important, combining two such values to construct a model for predicting incidence in the range between those values lacks support from either epidemiological or toxicological data. In short, the concentrations that are used have no specified relation to incidence and thus should not be used as predictors of incidence without explicit explanation of the unknown accuracy of such an approach.
To the extent possible, the Air Force should use end-point-specific incidence data to develop end-point-specific ERFs. However, with the
exception of mortality and a few other end points, incidence data for HCl, NO2, and HNO3 are not available (see Appendices D, E, and F and Chapter 6). Without incidence data from humans or animals, it is difficult to endorse the use of exposure-response models that predict incidence unless they are constructed through some type of expert elicitation process. In such a process, a group of selected experts would be interviewed using carefully developed procedures to elicit their individual professional opinions concerning what health effects would be expected at each of a series of exposure durations and concentrations. Their opinions would be compared by a formal process, and a majority opinion and the range in opinions would be used to establish a quantitative relationship between exposure and effect and the uncertainty of opinion concerning that relationship. For an example of a properly constructed expert elicitation process, see Evans et al. (1994).
Until more data become available or such an expert elicitation can be carried out for end points with no incidence data, the subcommittee believes that a hazard-quotient model would be more appropriate. For the hazard-quotient model, estimates of the number of people at risk would be based on the number of people with exposures above a no-observed-effect level. How far exposure concentrations are above safe levels might also be useful information. The hazard-quotient model also could be used to estimate how many people might be at risk of moderate or severe effects if the Air Force is willing to accept the level of uncertainty associated with the exposure values identified as thresholds for moderate and severe effects (see Appendices D and E).
SENSITIVE SUBGROUPS
Under the LATRA model, separate ERFs are developed for sensitive and normal populations. However, a properly constructed probit model can portray wide variation in human sensitivity within a single exposure-response function. Moreover, available data are insufficient to quantify different ERFs for sensitive and healthy (normal) populations. Thus, the subcommittee cannot support the use of separate ERFs for sensitive and normal populations, although it does support the use of different thresholds for effect if the hazard-quotient-hazard-index approach is used to characterize risk.
Under the LATRA model, the ERFs are truncated at the 1% inci-
dence level, which suggests that there are no effects at lower exposure concentrations. In a true probit or logistic model, a small but still significant probability of incidence occurs below the 1% level. With a large nearby population, dozens of people could be affected at or below the exposure concentrations associated with a 1% incidence level. Using actual incidence data to construct the ERF would make it possible to predict the incidence below the 1% level. In the absence of incidence data to construct ERFs, however, this issue is not of concern.
SEVERITY OF EFFECTS
To avoid embedding value judgments in the scientific exposure-response analysis, the subcommittee recommends that, if ERFs are used, they be developed first by health end point. Then decisions can be made as to which exposure concentrations to associate with mild, moderate, and severe effects, considering all end points and variation in severity within end points (e.g., mild to severe bronchoconstriction). However, incidence dose-response data are lacking for all but severe end points for HCl and NO2 and are altogether lacking for HNO3. It is possible to estimate a threshold for mild effects (based on a NOEL). It also might be possible to estimate thresholds for moderate and severe effects for HCl and NO2 (see Appendices D and E), although there are large uncertainties associated with the time-dependence of those estimates. Those thresholds could be used with the hazard-quotient approach to characterize risk.
REPRESENTATION AND PROPAGATION OF UNCERTAINTIES
Uncertainties in LATRA predictions arise from a number of sources, including specification of the problem; formulation of the conceptual model and the computational model; estimation of input values; and calculation, interpretation, and documentation of the results. Of those sources, only uncertainties due to estimation of input values can be quantified in a straightforward manner based on the type of variance propagation techniques used in the LATRA-ERF model. However, the LATRA model does not formally address the uncertainties and variability in the air concentrations of exposures derived from LATRA. In addi-
tion, uncertainties that arise from misspecification of the problem and model-formulation errors generally are not assessed in LATRA.
With regard to uncertainties in the LATRA process, the subcommittee observes that the use of complex stochastic simulations of exposure response cannot be justified when the underlying toxicological data are inadequate or essentially absent, as is the case for the compounds of interest in this study. In this situation, a formal stochastic analysis can obscure the important source of uncertainty—the absence of complete toxicological data. The absence of concentration-response data can be remedied by the collection of more data, particularly data that can be used to assess variation in susceptibility in human populations. Until such data become available, ERFs that express variability of response cannot be constructed.
The binomial model generates a variance that underestimates the variance associated with fitting the ERF to response data. The subcommittee recommends not using the binomial model in LATRA to assess uncertainty. Variability and uncertainty in the distribution of health outcomes should be retained in reporting the final results across different population subgroups and rocket-emission release scenarios.
It is recommended that sensitivity analyses be conducted to investigate the impact of the assumptions and procedures used to construct the ERFs on the model predictions of risk. It is also recommended that the Air Force generate appropriate toxicity data to calibrate and validate the proposed model. The investments in appropriate testing procedures, at this time, would be worth the effort by improving the model predictibility and reducing the uncertainty. Such studies should, at a minimum, examine concentration times, time responses, and include adequate histopathology. This will allow the Air Force to calibrate their model more appropriately based on sound data.
OTHER FEATURES OF LATRA
The subcommittee recommends that the Air Force evaluate potential health effects resulting from simultaneous exposure to more than one toxic rocket emission assuming the potential for additive effects. That could be accomplished using the hazard-index approach to characterize risk.
Instead of presenting one risk estimate for a launch, combining the
risks of a normal launch and catastrophic abort, the subcommittee believes that it would be appropriate for the Air Force to present risks for the normal and aborted launches separately or to provide both separate conditional risks and combined risks.
The Air Force should ensure that any TWA exposure estimates used to estimate risk are the maximum values possible for that averaging time. For example, the maximum 30-min concentration passing over an exposure location should be the value compared with a 30-min ERF or effect threshold.
The subcommittee also recommends that the Air Force evaluate the relative accuracies of the exposure estimates from REEDM and the ERFs (or effect thresholds suggested here). If the Air Force can determine whether it is the exposure or effects component of LATRA that is the more serious limit to the model's accuracy in predicting risk, it can invest efforts in improving the less accurate component.


