
6
EXPOSURE-RESPONSE FUNCTIONS FOR ROCKET-EMISSION TOXICANTS
THIS chapter provides examples of procedures for developing ERFs for the three rocket-emission toxicants—HCl, NO2, and HNO3 — according to the subcommittee's recommendations in Chapter 5. The ERFs are derived from available exposure-response data for those compounds, rather than set by simply estimating the exposures associated with a 1% and a 99% incidence on a lognormal distribution, as is currently done for the LATRA-ERF model. As will become clear in this chapter, few health end points have sufficient data to estimate ERFs for the rocket-emission toxicants.
This chapter is organized in five sections. The first three sections provide analyses of quantal exposure-response data for the three rocket-emission toxicants in order of increasing data availability—HNO 3, HCl, and NO2. The fourth section provides an example of how to develop an ERF from continuous, instead of quantal data, using data from toxicity studies of NO2. The final section presents the subcommittee's conclusions and recommendations regarding use of these ERFs in LATRA.
NITRIC ACID
An acute toxicity profile for nitric acid (HNO3) is provided in Appendix F . HNO3 can produce respiratory damage because it is a strong acid, it is an excellent oxidizing agent, and it reacts immediately with any tissue it contacts. It causes such effects as skin burns, eye irritation, coughing, dyspnea, and pulmonary edema. The serious respiratory effects, includ-
ing pulmonary edema, can occur several hours after an acute exposure and are probably related to inflammation resulting from cellular necrosis in lung tissues.
Several studies have shown that exposure to HNO3 at concentrations up to 0.2 ppm for 4 hr produces no observable effects in healthy humans. Concentrations as low as 0.05 ppm might cause some mild respiratory effects in asthmatic individuals. The subcommittee estimates that a no-effect level for HNO3 is 1.0 ppm (ceiling) for periods up to 1 hr for healthy individuals and 0.05 ppm (ceiling) for periods up to 1 hr for asthmatic individuals and others with compromised respiratory function. However, as described in the following subsections, an exposure-response function (ERF) cannot be established for HNO3 in healthy individuals or in asthmatic individuals, because too few data have been published on the effect levels of HNO3 for animals or humans.
HEALTHY ADULTS
The no-observed-effect level (NOEL) for humans exposed to HNO3 is 0.2 ppm for 4 hr (Aris et al. 1993) (see Chapter 3 and Appendix F). In that study, 10 persons were exposed and examination by bronchoscopy 18 hr later, revealing no adverse effects. If Haber's rule applies, an acceptable exposure concentration is 0.8 ppm (i.e., 0.2 ppm × 4) for 1 hr and 1.6 ppm for 30 min. Those concentrations are based on observing no effects in 10 individuals. When a small number of subjects are used (10 in this case), little confidence can be placed in the observation of no effects, and a confidence limit should be calculated for the observation. The true probability of an observable effect at a concentration of 0.2 ppm for 4 hr could be as high as 0.067, with a 50% chance of observing no effects in 10 individuals. That is, the probability of not observing an effect in 10 individuals is (1-0.067)10 = 0.50. That calculation provides a means of obtaining a conservative risk estimate even though no responses occurred in a small sample. If the probability of an observable effect is 0.067 at 0.2 ppm for 4 hr, and if Haber's rule applies, an exposure at 0.8 ppm for 1 hr implies the same risk of 0.067, or an incidence of 67 per 1,000 individuals. Thus, an incidence of 0.067 at a contamination of 0.8 ppm for 1 hr is one data point that might be used in establishing an ERF.
Abraham et al. (1982) exposed seven normal sheep to HNO3 vapor
at a concentration of 1.6 ppm for 4 hr. ''Two of the normal sheep responded with large post-HNO3 exposure increases in air reactivity"; increases were over 100% in specific airway resistance of the lung. Those data indicate a risk of 2/7 (0.29) at a concentration of 1.6 ppm for 4 hr. If Haber's rule applies, an exposure at 6.4 ppm for 1 hr implies a risk of 0.29. That provides a second data point for developing an ERF, assuming that sheep and humans respond similarly to HNO3.
For the healthy adult population, only the two data points described above are available to establish an ERF for HNO3. Both points are based on a small sample size, both depend on Haber's rule, and the second data point is based on animals, not humans. Thus, the subcommittee believes that an ERF for respiratory resistance based on those two data points is too uncertain to estimate human health risks associated with exposure to HNO3. Using the hazard-quotient approach to estimating the number of individuals who might be exposed at concentrations above a NOEL would be an appropriate alternative (see Chapter 5).
SENSITIVE SUBJECTS
Koenig et al. (1989a) obtained measurements on adolescent asthmatic subjects exposed to HNO3 at a concentration of 0.05 ppm for 40 min. One of seven subjects showed an increase in respiratory resistance of 70% (see Appendix F). If Haber's rule applies, then 0.033 ppm for 1 hr corresponds to a risk of increased respiratory resistance of 1/7 (or 14%). A later study, however, showed no effects (Koenig et al. 1989b). Thus, a risk of 14% at 0.033 ppm for 1 hr could serve as a conservative estimate of one of the two points needed to develop an ERF for individuals with asthma. Abraham et al. (1982) reported that six of seven hypersensitive sheep exposed to HNO3 at 1.6 ppm for 4 hr showed increases of over 100% in specific airway resistance of the lung. Those data indicate a risk of 6/7 (86%) at 1.6 ppm for 4 hr. If Haber's rule applies, an exposure at 6.4 ppm (i.e., 1.6 ppm × 4) for 1 hr implies a risk of 86%, which could be used as a second point to establish an ERF for sensitive individuals. This assumes that hypersensitive sheep and sensitive humans respond similarly to HNO3.
Based on the above data, sensitive individuals might be 20 times more sensitive than healthy individuals at low concentrations of HNO3,
as stated in Chapter 3. However, as indicated for healthy individuals, the subcommittee believes that an ERF for respiratory resistance for sensitive individuals based on only two data points (with small sample sizes, using Haber's rule, and with the second point based on animal data) is too uncertain to estimate the incidence of effects associated with exposure to HNO3 from rocket launches.
HYDROGEN CHLORIDE
An acute toxicity profile for hydrogen chloride (HCl) is provided in Appendix D. HCl is a highly irritating gas or aerosol, depending on environmental exposure conditions. The toxicity of the gas and aerosol are similar in animal studies. The toxicity of HCl in humans and animals is related to its surface-damaging properties. Therefore, the mechanism of action of HCl in animals and humans is expected to be similar. Although damage to the upper respiratory system and eyes is possible from exposure to HCl, serious damage to these structures is only seen at high exposure concentrations. Of more concern is inhalation of HCl into the airways of the lower respiratory system at high exposure concentrations. The few studies on adults with mild asthma suggest that asthmatic individuals might not be more susceptible to low concentrations of HCl than nonasthmatic individuals. However, as the protective properties of the upper airways are overcome, those with asthma might show significantly greater sensitivity to HCl.
Data presented in Appendix D suggest that 2 and 5 ppm might represent no-observed-effect levels (NOELs) for sensitive and healthy populations, respectively. There are no data by which to estimate ERFs for HCl for mild effects for sensitive or healthy populations.
Dose-response incidence data are available for HCl for two end points only: mortality and corneal opacity (see Appendix D). ERFs can be developed for those end points as described below. It is unlikely, however, that ERFs for those endpoints would be useful to the Air Force. They are presented primarily to show how ERFs can be developed from quantal dose-response (incidence) data.
MORTALITY
Data on rodent mortality provide the most information available for
establishing ERFs for HCl. Because mice are more sensitive than rats to HCl (see Appendix D), ERFs for mice were developed. However, it must be kept in mind that mice are also more sensitive than humans to HCl (Appendix D).
Darmer et al. (1974) exposed mice for 5 or 30 min at several concentrations of HCl. Mortality is plotted in Figure 6-1 on log-probability (log-probit) scales. The linear plots indicate that the logarithm of fatal concentrations is reasonably well described by a normal distribution (i.e., a lognormal distribution). The 30-min exposure is about six times more potent than the 5-min exposure, indicating that Haber's rule applies to the mortality end point for those concentrations and durations of exposure. Because Haber's rule applies and the studies by Darmer et al. (1974) and Wohlslagel et al. (1976) have similar results, the 5- and 30min mortality results are plotted in Figure 6-2 as a single ERF for percentage dead versus cumulative (total) exposure, which is expressed in milligram-minutes per cubic meter.
No deaths occurred in two groups of animals in those experiments
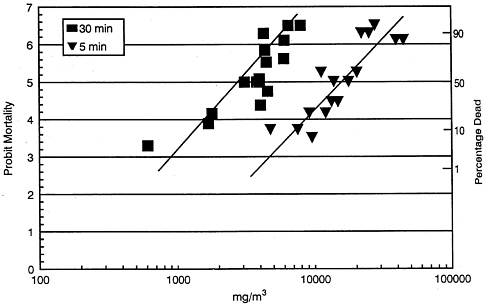
FIGURE 6-1 Plots (log-probit) of mouse mortality (percentage dead) versus HCl exposure concentration (mg/m3) for 30 min (![]() ) and 5 min (
) and 5 min (![]() ). Data are from Darmer et al. (1974) (see Appendix D). See text of this chapter for percentages used to plot points representing groups of animals in which all or no animals died.
). Data are from Darmer et al. (1974) (see Appendix D). See text of this chapter for percentages used to plot points representing groups of animals in which all or no animals died.
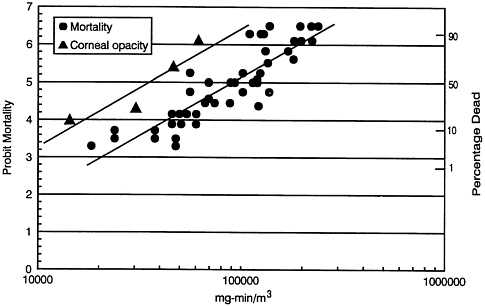
FIGURE 6-2 Plots (log-probit) of mouse mortality (![]() ) (percentage dead) and guinea-pig corneal opacity (
) (percentage dead) and guinea-pig corneal opacity (![]() ) (percentage affected) versus HCl cumulative exposure (mg·min/m3). Mouse data are from Darmer et al. (1974) and Wohlslagel et al. (1976) (see Appendix D). Guinea-pig data are from Burleigh-Flayer et al. (1985) (see Appendix D). See text of this chapter for percentages used to plot points representing groups in which all or no animals died.
) (percentage affected) versus HCl cumulative exposure (mg·min/m3). Mouse data are from Darmer et al. (1974) and Wohlslagel et al. (1976) (see Appendix D). Guinea-pig data are from Burleigh-Flayer et al. (1985) (see Appendix D). See text of this chapter for percentages used to plot points representing groups in which all or no animals died.
(group exposed for 5 min at 9,551 mg/m3 (6410 ppm) and 610 mg/m3 (410 ppm) (Table D-6). Some mortality might have occurred in those groups if more animals had been tested per group. That possibility is particularly true for the 5-min exposure at 9,551 mg/m3, because deaths occurred in other groups exposed at lower concentrations. With 10 animals in a group, the true mortality could be as high as 0.067 and the chance that no animals would die in a particular test would still be 50%. That is, the probability that no animals in 10 would die is (1-0.067)10 = 0.50. Also, no deaths were observed in 15 mice exposed to 610 mg/m3 (410 ppm) of HCl for 30 min. In this case, if the true mortality were 0.045, there is a 50% chance that no deaths would occur in a sample of 15 animals. The 50% confidence limits are the incidences plotted in Figures 6-1 and 6-2 for those two groups where no mortality was observed.
In three other groups of animals, mortality was 100%; however, if
more animals had been included in those groups, some might have survived. Thus, the true mortality could be as low as 93.3%, and the chance of obtaining a 100% mortality of 10 animals would still be 50%. That percentage is a conservative adjustment for the ERF at low concentrations of HCl, because it lowers the slope of the ERF and, in turn, increases the incidence of effects at the low exposure concentrations. Such adjustments provide a conservative correction for potentially unlikely results that are due to small sample sizes.
Because the variation in response rate with exposure is relatively constant across exposure concentration multiplied by time, a simple least-squares fit is applied to the mouse mortality data (Figure 6-2), giving
probit = -10.59 + 1.366 In(CT),
where C is concentration in milligrams per cubic meter and Tis duration in minutes. The ERF for mortality in mice shown in Figure 6-2 is relatively steep. Mortality changes from 5% to 95% over a 12-fold increase in the total exposure. The HCl exposure estimated to correspond to a risk of 10-4 (probit = 1.28) is 5,940 mg·min/m3 (3,990 ppm•min).
The Air Force does not include lethality in its LATRA risk assessment for rocket-launch emissions. If the Air Force wanted to estimate the possibility that someone might die from emissions from a rocket launch, it could use the mouse model as a conservative estimate, because the mouse is the most sensitive of the animal species tested for acute effects (Appendix D). Humans can be expected to have responses to HCl that are more like those of baboons because the upper respiratory tract of the baboon is most like that of humans, and the geometry of the upper respiratory tract is expected to play an important role in moderating the toxicity of inhaled HCl. Because the sensitivity to HCl is greater in mice than baboons and assuming humans have responses to HCl which are more like baboons, no additional safety factor is needed, and the mouse model is likely to overestimate risks of death in humans. Because only a few thousand people are likely to be exposed to substantial amounts of HCl under the worst conditions, the mouse model indicates that a total exposure of 3,990 ppm•min is unlikely to result in any human deaths. Over a 60-min interval, the average concentration is 66 ppm (3,990 ppm•min/60 min). Applying Haber's rule, the average concentrations that are unlikely to result in any human deaths for 60min or less are shown below.
|
Duration (min) |
HCl (ppm) |
|
60 |
66 |
|
30 |
130 |
|
10 |
400 |
|
5 |
800 |
CORNEAL OPACITY
Corneal opacity resulting from HCl exposure was observed in guinea pigs by Burleigh-Flayer et al. (1985); the NOEL was 320 ppm (477 mg/m3) for 30 min (Appendix D). The true risk of corneal opacity could be as high as 15.9% with a 50% chance of not observing any such effects in four animals. That incidence was plotted in Figure 6-2 and was used in curve fitting. Also, the incidence of corneal opacity at 1,380 ppm (2,056 mg/m3) was adjusted from 100% to 87.1%, because the incidence could be that low with a 50% chance that all five animals would exhibit corneal opacity. The least-squares line for corneal opacity was
probit = -9.957 + 1.425 ln(CT ),
where C is concentration in milligrams per cubic meter and Tis duration of exposure in minutes.
The exposure estimated to correspond to a risk of corneal opacity in guinea pigs of 10-4 (1 in 10,000) was 2,660 mg•min/m3 (1,785 ppm·min). Using Haber's rule, exposures that are not likely to result in severe effects, such as corneal opacity observed in guinea pigs, are shown below.
|
Duration (min) |
HCl (ppm) |
|
60 |
30 |
|
30 |
60 |
|
10 |
180 |
|
5 |
360 |
DOSE-RESPONSE FOR MILD, MODERATE, AND SERIOUS EFFECTS
The slopes of the dose-response curves for mortality in mice and corneal opacity in guinea pigs are very similar; the serious effect of corneal
opacity in guinea pigs occurred at concentrations only a factor of two below the concentrations that caused death in mice. Unfortunately, dose-response data for other nonlethal serious effects are lacking, and there are no quantitative data from humans on serious effects. Thus, it is difficult to predict whether the ERF for corneal opacity in guinea pigs would overestimate or underestimate the risk of effects that could be considered serious in humans. Obviously, exposures should be limited to lower concentrations of HCl to avoid moderate and mild effects.
Data are not available to estimate the incidence of mild or moderate effects in humans or animals. Adequate data are available, however, to estimate a NOEL for mild effects in sensitive humans (i.e., 1.8 ppm for 45 min; see Appendix D), and investigators have identified a possible threshold for mild effects in healthy humans (i.e., 5 ppm for up to 1 hr; see Appendix D). Few data are available to estimate a threshold for moderate effects in healthy adults, and no data are available to estimate a threshold for moderate effects in sensitive individuals. Therefore, the subcommittee examined the possibility of constructing an ERF for mild effects in sensitive humans by using a NOEL for humans as a lower anchor point and the slope of an ERF from animal data. However, the true incidence of mild effects in sensitive humans at the NOEL is unknown. The slope of the ERF could be set equal to the slope of the mortality dose-response in mice (equivalent to the slope of the corneal opacity dose-response in guinea pigs). That construct is based on two assumptions: (1) that the slope of an ERF for humans would be the same as the slope of an ERF for laboratory test animals, and (2) that the slope of an ERF for mild-to-moderate effects would be the same as the slope of an ERF for severe-to-lethal effects. There are problems with both assumptions.
As the heterogenicity of a population increases, a wider range of doses is associated with effects (i.e., the slope of the dose-response curve becomes shallower). Responses to HCl exposure are likely to be more variable in heterogenous human populations downwind of a rocket launch than in a homogenous group of inbred animals. Hence, the slope of an ERF for animals is likely to be more steep than the slope of an ERF for the same end point in a human population. Thus, an ERF based on the slope of an animal dose-response function is likely to overestimate risks to humans if anchored to the human NOEL as a lower bound. This conservative bias, however, might be acceptable to the Air Force. A more serious problem is the relation between ERFs for mild, moderate, and severe effects. At low exposure concentrations in occupa-
tional settings, the irritative effects of HCl appear to be primarily a function of the exposure concentration rather than the concentration multiplied by time (Appendix D). That observation suggests that Haber's law is less applicable as the exposure concentration declines (and the effects become more mild). Thus, it would not be appropriate to plot the incidence of mild effects against cumulative exposure (i.e., C × T ) using the same slope as an ERF for severe effects. Instead, it would be necessary to plot the incidence of mild (or moderate) effects as a function of exposure C and T separately, either by multiple regression analysis with two independent variables (C and T ) or by plotting separate incidence-versus-concentration ERFs for different exposure durations (e.g., 10, 20, and 30 min). Either approach could be incorporated into the LATRA-ERF model; however, the subcommittee believes that the available toxicological data are insufficient to support either type of model fitting at this time.
NITROGEN DIOXIDE
Available data indicate that exposure to NO2 can result in a wide variety of respiratory effects in humans and animals (Appendix E). Although the severity of effects increases with increasing exposure concentration and duration, concentration has the more pronounced influence. Reports of exposures at high concentrations for short durations were most often related to accidents, where exposure concentrations were poorly characterized.
Certain groups might be more sensitive to the effects of NO2 exposure than others; those groups are persons with pre-existing cardiopulmonary problems and children. Lower concentrations of NO2 might affect those groups more than healthy adults, or the severity of an effect at a given concentration might be greater. The existing data do not clearly indicate a difference in sensitivity among humans to low concentrations of NO2, and studies have not been conducted on humans using high concentrations. The groups identified above are potentially at risk of more severe reactions than the general population when exposed to very high concentrations of NO2.
Exposure-response data are available for NO2 for a number of end points. Of those, the subcommittee attempted to develop ERFs from the most promising data sets: exposure-response data for animal mortality and for human airway responsiveness.
MORTALITY
Hine et al. (1970) exposed rats, mice, guinea pigs, rabbits, and dogs to NO2 at several concentrations for various durations. In these studies the guinea pig was more susceptible to the lethal effects of NO2 than the mouse and rat, and the rabbit and dog were relatively more resistant. Reviews of the literature (Mauderly 1984, 1988) indicate that the pulmonary-function responses of the guinea pig to sensory irritants are similar to those observed in humans at low exposure concentrations. Indeed, the guinea pig is used in standard tests for irritancy (Alarie 1973a,b, 1981; Wong and Alarie 1982). However, guinea pigs are more sensitive than other laboratory animals to mortality from exposure to high concentrations of an irritant because the guinea pig's airways tend to completely constrict and occlude the passage of air (Azoulay-Dupuis 1983; EPA 1993). Therefore, the mouse data were used here to construct ERFs. Larsen et al. (1979) considered the mouse to be more sensitive to NO2 than humans; a mathematical model was used to calculate expected mortality as a function of NO2 concentrations and exposure durations.
Examination of the mortality data provided by Hine et al. (1970) shows that Haber's rule does not strictly apply for mortality in mice—NO2 concentration is more important than exposure duration. Using the same type of model adopted by Larsen et al. (1979) for mouse mortality, the standard normal deviate for mortality obtained by a leastsquares model fit to the results of Hine et al. (1970) gives
z = 3.23 ln(0.004 CT 0.24)
where C is concentration in ppm and T is the duration of exposure in minutes. For a mortality risk of 10-4 (i.e., the 0.01 percentile), the standard normal deviate is
z = -3.72.
For an exposure of 5 min, the concentration estimated to produce mortality in 1 in 10,000 mice is obtained from
-3.72 = 3.23 ln(0.004 x C × 50.24)
giving
C = 54 ppm.
If mice are more sensitive than humans, the risk of death in humans is estimated to be less than 1 in 10,000 for a 5-min exposure to NO2 at 54 ppm. Similarly, the estimated concentrations for other durations of exposure associated with mortality risks of less than 10-4 are shown below.
|
Duration (min) |
HCl (ppm) |
|
5 |
54 |
|
10 |
45 |
|
30 |
35 |
|
60 |
30 |
Concentrations estimated for other levels of risk can be obtained by selecting the appropriate value for z. For example, z = -3.09 for a risk of 10-3 (i.e., the 0.1 percentile of a standard normal distribution).
Gardner et al. (1979) exposed mice to viable microorganisms of Streptococcus pyogenes in addition to NO2 at various concentrations for several durations. For these challenged mice, Larsen et al. (1979) derived a prediction model for the standard normal deviate of
z = 1.13 ln(0.027 CT0.33)
where C is the concentration of NO2 in parts per million and T is the duration of exposure in minutes. At risk levels of 10-4, the mice challenged with Streptococcus pyogenes were 70 to 90 times more sensitive for mortality than mice exposed only to NO2.
AIRWAY RESPONSIVENESS IN HUMANS
Table 15-9 of the U.S. Environmental Protection Agency (EPA 1993) air quality criteria document for NO2 summarizes the results of several studies investigating airway responses of asthmatic subjects exposed to NO2 at concentrations of 0.1 to 1.0 ppm for 20 to 120 min. Results were erratic, and airway responsiveness tended to be somewhat less severe in exercising subjects than in resting subjects. Hence, only studies that examined resting subjects were considered here. Airway responsiveness was measured by specific airway conductance or resistance, forced expiratory volume, or total respiratory resistance. Most individuals
showed an increase in airway responsiveness, considered a deleterious effect, after NO2 exposure. However, in some studies, a few individuals showed reduced airway responsiveness. Therefore, the difference in the proportions of individuals showing positive and negative airway responsiveness was used as a measurement of the effect of exposure to NO2. The subcommittee concluded that the data, listed in Table 6-1, are too erratic to model. The lack of a discernable exposure-response relationship in the data might have been because a small range of concentrations was tested or the experimental conditions varied.
CONTINUOUS (NONQUANTAL) MEASUREMENTS
With quantal (dichotomous) data, risk is defined as the proportion of individuals or animals that are observed to display a specific biological effect (e.g., death, pneumonia, or tearing). Many biological effects do not fall into discrete categories but are measured on a continuous scale (e.g., body weight, breathing rate, or minute volume). For some continuous measurements, an adverse-effect level might have already been established, and risk can be estimated by the proportion of individuals or animals exceeding that level. However, that approach does not make full use of continuous data (Gaylor 1996), and more often than not, an
TABLE 6-1 Airway Responsivenessa in Resting Humans with Asthma Exposed to NO2 (ppm·min < 10)
|
Number Tested |
NO2, ppm |
Duration, min |
NO2 x Duration, ppm·min |
Proportion Increased |
Proportion Decreased |
Proportion Difference |
|
20 |
0.10 |
60 |
6.0 |
0.65 |
0.35 |
0.30 |
|
19 |
0.10 |
60 |
6.0 |
0.53 |
0.42 |
0.11 |
|
15 |
0.10 |
60 |
6.0 |
0.40 |
0.47 |
-0.07 |
|
20 |
0.10 |
60 |
6.0 |
0.70 |
0.15 |
0.55 |
|
7 |
0.11 |
60 |
6.6 |
—b |
—b |
0.00b |
|
20 |
0.14 |
30 |
4.2 |
0.70 |
0.30 |
0.40 |
|
14 |
0.25 |
30 |
7.5 |
0.79 |
0.14 |
0.65 |
|
20 |
0.27 |
30 |
8.1 |
0.70 |
0.30 |
0.40 |
|
8 |
0.48 |
20 |
9.6 |
0.62 |
0.00 |
0.62 |
|
a Data from Table 15-9, EPA (1993) air-quality criteria document for NO2. b Proportions not listed but authors stated no effect of NO2. |
||||||
adverse-effect level for a continuous measurement is not established, particularly for laboratory animals under specific experimental conditions. In such cases, Gaylor and Slikker (1990) developed a technique for estimating risk based on the dose-response relationship and the distribution of measurements (variability among animals) about the dose-response curve. In the absence of a defined adverse-effect level, an ''abnormal" level can be defined; for example, the level corresponding to the 1st and 99th percentiles of the unexposed control animals. Then, the probability of animals with abnormal levels can be estimated as a function of dose.
Examples of end points measured on a continuous scale are various measures of pulmonary function in inhalation studies. For example, Januszkiewicz and Mayorga (1994) showed a relationship between lung resistance (RL), expressed as centimeters of water per liter per second (cmH2O/L-sec), and inhaled exposure dose (D) of NO2, expressed as milligrams per kilogram (mg/kg) of body weight. Sheep were exposed to NO2 at 100 ppm for 15 min or at 500 ppm for 15 to 20 min. Lung resistance was measured 24 hr later. The dose-response relationship from Januszkiewicz and Mayorga (1994) was
RL = 1.3 + 0.72 D.
The measurements in the control animals appear to be adequately described as a normal distribution with a mean of 1.3 and a standard deviation of s = 0.55. For this distribution, the 99th percentile was
1.3 + (2.33 x 0.55) = 2.6.
Thus, values of lung resistance in sheep above 2.6 cmH2O/L-sec will be considered abnormal. Using that information, it is possible to estimate the risk (probability) of an abnormal level of Rp in sheep as a function of exposure to NO2. For example, suppose one wishes to estimate the exposure at which an additional 10% of the sheep will experience an abnormal level of lung resistance. Because 1% of sheep are by definition in the abnormal range, an excess risk of 10% means the total risk is 11%. Probabilities for normal distributions are calculated from z scores, where z = (measured level-mean)/(standard deviation). The z score corresponding to an upper-tail probability of 0.11 is z = 1.23. That is, 11% of the readings exceed 2.6, where
z = 1.23 = (2.6 -mean)/0.55,
or where the mean = 1.92. Hence,
RL = 1.92 = 1.3 + 0.72 D
and
D = 0.86 mg/kg body weight.
That is, the excess risk of lung resistance in sheep is estimated to be 10% at a dose of NO2 of 0.86 mg/kg of body weight. Similar calculations for other levels of excess risk are shown in Table 6-2.
If sheep and humans are equally sensitive to NO2 when expressing dose on the basis of milligrams per kilogram of body weight, then a dose of 0.86 mg/kg corresponding to an excess risk of 10% is 0.86 × 60 = 51.6 mg total of NO2 for a 60-kg adult. A moderately active human inhales about 1 m3 of air per hour. Thus, in 1 hr, a human inhales 51.6 mg of NO2 at a concentration of 51.6 mg/m3. Expressed on the basis of milligram minutes per meter cubed, that exposure is equal to 51.6 mg/m3 × 1 hr × 60 min/hr, or 3,096 mg•min/m3 (1,650 ppm•min) for a risk of 10%. Calculations for other levels of excess risk in humans are given in Table 6-3.
Alternatively, suppose the risk of abnormal lung resistance is a function of the air concentration of NO2 multiplied by the exposure duration instead of a function of the inhaled dose. On the basis of an average minute volume of 7.6 liters (0.0076 m3) in sheep (calculated from measurements reported by Januszkiewicz and Mayorga 1994), an exposure of an average 42-kg sheep to NO2 at 1 mg/kg body weight, or 42 mg total, is equivalent to an exposure of 42 mg ÷ 0.0076 m3/min = 5,526 mg•min/m3. Hence, an exposure of 0.056 mg/kg is equal to 0.056 × 5,526 = 310 mg•min/m3 or 165 ppm•min for an excess risk of 0.001. Calculations for other levels of excess risk in sheep are given in Table 6-4.
TABLE 6-2 Excess Risk of Increased Lung Resistance (RL) in Sheep
|
Excess Risk |
Total Risk |
z score |
Mean RL |
Exposure (D), mg/kg Body Weight |
|
0.001 |
0.011 |
2.29 |
1.34 |
0.056 |
|
0.01 |
0.02 |
2.05 |
1.47 |
0.24 |
|
0.1 |
0.11 |
1.23 |
1.92 |
0.86 |
TABLE 6-3 Excess Risk of Increased Lung Resistance in Humans Based on Data from Sheep
|
|
Exposure |
|||
|
Excess Risk |
mg/kg |
mg |
mg•min/m3 |
ppm•min |
|
0.001 |
0.056 |
3.4 |
204 |
110 |
|
0.01 |
0.24 |
14.4 |
864 |
460 |
|
0.1 |
0.86 |
51.6 |
3096 |
1650 |
CONCLUSIONS AND RECOMMENDATIONS
The LATRA model has been developed as an approach for estimating the number of people that might be affected as a result of exposure to toxic emissions from rocket launches. The accuracy of the LATRA predictions depends on the accuracy of the ERFs, which provide an estimate of the incidence of health effects (mild or severe) as a function of exposure. The Air Force procedure for deriving ERFs was described in detail in Chapter 2 and evaluated in Chapter 5.
As described in Chapter 5, the subcommittee recommends using all available and pertinent exposure-response data to establish an ERF via a model-fitting process rather than using only estimates of exposures that might (or might not) correspond to the 1st and 99th percentiles. In this chapter, the subcommittee provided examples for procedures for developing ERFs for HNO3, HCl, and NO2. Extensive use was made of Haber's law that predicts effects on the basis of exposure duration times airborne concentrations of chemicals. In some cases, extrapolations across large differences in exposure duration (e.g., from 60 min to 5 min) might result in uncertain predictions. Based on its analysis, the subcommittee concluded that the paucity of exposure-response data for non-lethal end points makes it impossible to construct ERFs for most of the
TABLE 6-4 Excess Risk of Increased Lung Resistance in Sheep
|
|
Exposure |
|||
|
Excess Risk |
mg/kg |
mg |
mg•min/m3 |
ppm•min |
|
|
0.056 |
3.4 |
310 |
165 |
|
0.01 |
0.24 |
14.4 |
1330 |
710 |
|
0.1 |
0.86 |
51.6 |
4750 |
2530 |
situations of interest to the Air Force. However, when an ERF cannot be constructed, it is usually possible to estimate an exposure concentration and duration that is unlikely to result in health effects (i.e., a NOEL). Thus, it should be possible to use LATRA to estimate the number of people who are likely to be exposed at levels exceeding a no-observed-effect level (NOEL) and to indicate the magnitude of the excess (see Chapter 5). That estimate does not provide an estimate of the number of individuals affected or severity of effects, but it does provide an estimate of the number of people at risk from exposures in excess of the NOELs.
For the examples of ERFs constructed in this section, the uncertainty in the measurements of exposure is approximately a factor of two, higher or lower. Hence, estimates of the incidence of effects based on those ERFs would not be accurate. The magnitude of the uncertainty could be determined by calculating the expected number of individuals at risk with the ERFs shifted higher and lower; however, there are additional uncertainties if animal data are used to estimate effects for humans and if the slope of the dose-response relationship for one end point is used to estimate the slope of dose-response relations for another end point.
Given the limited dose-response data available for the rocket-emission toxicants, Chapter 5 recommended that either an expert elicitation process be used to estimate ERFs or the hazard-quotient-hazard-index approach be used to characterize risks. The subcommittee feels that it has exhausted the possibilities for constructing ERFs from incidence data for HCl and HNO3. The subcommittee did not examine all of the dose-response studies available for NO2 for their potential to develop ERFs, however. Thus, it is possible that additional health-end-point specific ERFs could be developed for NO2 using one of the approaches described in this chapter and Chapter 5. However, risk characterization will be more clear if the same risk-assessment model is applied to all three rocket-emission toxicants.


