
This paper was presented at a colloquium entitled “Neuroimaging of Human Brain Function,” organized by Michael Posner and Marcus E.Raichle, held May 29–31, 1997, sponsored by the National Academy of Sciences at the Arnold and Mabel Beckman Center in Irvine, CA.
Event-related brain potentials in the study of visual selective attention
STEVEN A.HILLYARD* AND LOURDES ANLLO-VENTO
Department of Neurosciences, 0608, University of California at San Diego, La Jolla, CA 92093–0608
ABSTRACT Event-related brain potentials (ERPs) provide high-resolution measures of the time course of neuronal activity patterns associated with perceptual and cognitive processes. New techniques for ERP source analysis and comparisons with data from blood-flow neuroimaging studies enable improved localization of cortical activity during visual selective attention. ERP modulations during spatial attention point toward a mechanism of gain control over information flow in extrastriate visual cortical pathways, starting about 80 ms after stimulus onset. Paying attention to nonspatial features such as color, motion, or shape is manifested by qualitatively different ERP patterns in multiple cortical areas that begin with latencies of 100–150 ms. The processing of nonspatial features seems to be contingent upon the prior selection of location, consistent with early selection theories of attention and with the hypothesis that spatial attention is “special.”
To analyze the neural bases of a cognitive system such as attention, we must identify not only the participating brain regions but also the temporal microstructure of information flow among the regions involved. Although imaging methods that register changes in cerebral blood flow (positron emission tomography, PET, and functional magnetic resonance imaging, fMRI) have proven highly effective for defining the anatomical areas and networks that are activated during cognitive operations (1), these methods (for the present at least) are severely limited in their ability to reveal the temporal patterns of activation within these networks. Indeed, the intrinsically sluggish nature of the hemodynamic response to increased neuronal activity may place a lower limit of the order of hundreds of milliseconds on the time resolution capability of blood-flow imaging techniques.
Fine-grained information about the temporal structure of neural activation patterns can be obtained through noninvasive recordings of the electrical and magnetic fields that are generated in association with synchronous nerve cell activity. The electrical field potential changes that are time-locked with sensory, motor, or cognitive events are termed event-related potentials (ERPs) and consist of a series of voltage oscillations that reflect the time course of neuronal activity with a resolution of the order of milliseconds (2). While surface-recorded ERPs (and the corresponding event-related magnetic fields) faithfully reflect the temporal patterns of activity within neuronal populations, their source locations in the brain can only be estimated and not visualized directly as can be done with PET or fMRI. This indirect estimation of ERP generator locations on the basis of surface-recorded voltage distributions is termed the “inverse problem.” While the inverse problem cannot be solved uniquely in any given case, the validity of such indirect source calculations has been enhanced by improved algorithms for modeling intracranial generators in terms of multiple dipoles or sheets of densely packed current sources (e.g., refs. 3 and 4). More recent modeling approaches also take into account the anatomical organization and biophysical properties of the cortical mantle and intervening tissues (5, 6). A promising new approach to the inverse problem is to use the anatomically precise information from PET or fMRI activations to constrain the calculated source locations of ERPs (7). Mangun et al. (8) outline the principles for combining ERP and blood-flow neuroimaging techniques in the same experimental framework and propose procedures for linking the spatial and temporal dimensions of event-related neural activity.
The focus of the present paper is on the contributions made by ERP recordings in revealing the timing and localization of stimulus selection processes in the brain during visual attention. Similar analyses using ERPs have been undertaken for other cognitive systems (9). The emphasis here is on recent experiments in which the anatomical localization of attention-related ERP changes was supported by PET data, either in combined experiments or by comparison across experiments. The spatio-temporal information in these ERP waveforms has helped to resolve several major issues that have arisen in cognitive studies of visual attention, including early versus late levels of selection, the extent of processing of unattended stimuli, the uniqueness of spatial attention, and the predominance of spatial over feature-selective attention (10). In addition, the waveforms of ERPs elicited during attention to multifeature stimuli provide information about the time course with which individual features and feature conjunctions are selected, and the interactions among ERP components can help to distinguish mechanisms of serial, parallel, and hierarchical feature processing.
Distributed Networks for Control of Visual Attention. Experiments using blood-flow neuroimaging methods have complemented previous studies of brain-lesioned patients in identifying a network of interconnected cortical and subcortical areas that play a key role in the control of visual attention in humans (11, 12). These areas include dorsolateral prefrontal and posterior parietal cortex, the anterior cingulate gyrus, and the pulvinar nucleus of the thalamus. It has been proposed that this network constitutes the essential control circuitry for visual attention that determines which stimuli are to be attended, with the prefrontal cortex initiating and maintaining the selective sensory bias in working memory and the parietal cortex directing and shifting attention to specific locations in
© 1998 by The National Academy of Sciences 0027–8424/98/95781–7$2.00/0
PNAS is available online at http://www.pnas.org.
|
|
Abbreviations: ERP, event-related brain potential; SN, selection negativity; PET, positron emission tomography; fMRI, functional magnetic resonance imaging; SP, selection positivity; LPC, late positive component. |
|
* |
To whom reprint requests should be addressed, e-mail: shillyard@ucsd.edu. |
extrapersonal space (13–15). This control circuitry in turn determines which stimuli entering the visual pathways are to be facilitated or suppressed by virtue of anatomical projections to the ventral stream of extrastriate visual areas that encode stimulus features and objects (16, 17) and perhaps to dorsal stream areas that encode stimulus motion as well. In other words, this attentional control circuitry provides “bias signals” that either enhance or suppress sensory representations in the extrastriate visual pathways according to their momentary relevance (18, 19). In an alternative formulation, Crick (20) has proposed that the control circuitry for spatial attention may act via the reticular/perigeniculate nuclei of the thalamus to selectively modulate thalamic input to the cortex. If such a mechanism exerted control over the transmission of visual signals in the geniculo-striate projection, it would be expected that short-latency activity in primary visual cortex would be modulated during appropriate attentional tasks.
Mechanisms of Spatial Attention. ERP data have been very informative about the time course of visual processing in humans and its modulation by spatial attention. The visual ERP consists of several characteristic voltage deflections beginning about 50 ms after stimulus onset that have been labeled the C1 (50–90 ms), P1 (80–130 ms), and N1 (140–200 ms) components (Fig. 1). Directing attention to the location of a stimulus typically results in an amplitude enhancement of the P1 and multiple N1 components evoked by that stimulus with little or no change in component latencies or scalp distributions (reviewed in refs. 8, 21, and 22). This suggests that spatial attention exerts a gain control or selective amplification of sensory information flow in the visual pathways between 80 and 200 ms after stimulus onset (14, 23). Such an amplification mechanism would presumably give inputs from attended locations an improved signal/noise ratio so that more information can be extracted from relevant portions of the visual field.
This pattern of P1/N1 amplitude enhancement seems to be a general characteristic of the spatial focusing of attention

FIG. 1. Grand average visual ERPs over 17 subjects recorded from four scalp sites in response to small circular checkerboard stimuli in a spatial attention task. Stimuli were flashed in a rapid, randomized sequence to the left and right visual fields while subjects attended to one visual field at a time. ERPs shown are in response to left field flashes, with waveforms superimposed for attend-left (solid lines) and attend-right (dotted lines) conditions. Note that attending to the stimulus location produces an increased amplitude of the P1 components (80–130 ms) over the contra- and ipsilateral occipital scalp, as well as of multiple N1 components (120–200 ms) over frontal (front), parietal (par), and occipital (occ) scalp areas. In contrast, the earlier C1 component (50–90 ms), which was localized to primary visual cortex, did not change as a function of attention. Abscissa, time base in milliseconds. Reproduced with permission from Clark and Hillyard (32) (Copyright 1996, by MIT Press).
across a variety of task situations. Stimuli at attended locations elicit larger P1/N1 components than at unattended locations whether the stimuli are presented continuously in randomized sequences, as in Fig. 1, or cued on each trial as to the most probable location of the subsequent target stimulus. In such trial-by-trial cueing tasks, enhanced P1/N1 amplitudes to target stimuli at valid (precued) locations have been associated with speeded reaction times and improved detectability of target signals (22, 24–26). which lends support to the hypothesis that these ERP amplitude modulations reflect sensory information that is used for perceptual judgements. Similar P1/N1 modulations have been found in visual search tasks in which subjects had to deploy focal attention to identify the shape of a target defined by its color in an array (27, 28). In contrast, the earlier C1 component has been found to remain invariant as a function of spatial attention (29–32).
To investigate the anatomical level(s) of the visual pathways at which spatial attention affects processing, several studies have attempted to localize the respective neural generators of the C1 and P1 components. The C1 has a midline occipitoparietal scalp distribution that is well accounted for by a dipolar source in primary visual (striate) cortex (32). Moreover, the C1 inverts in polarity as a function of stimulus elevation in the visual field in a way that is consistent with the mapping of the retina onto the upper and lower banks of the calcarine cortex (29, 33). In contrast, the P1 component reportedly does not invert in polarity with stimulus position, and dipole modeling of its neural generators has indicated sources in the ventral-lateral extrastriate cortex of the occipital lobe (30, 32). Thus, spatial attention does not seem to influence visual processing in the striate cortex itself (indexed by C1) but rather acts to produce an amplification of stimulus-evoked activity in extrastriate cortex beginning at about 80 ms poststimulus (indexed by P1).
To verify the extrastriate localization of this early spatial attention effect, several recent studies have combined ERP recordings with PET obtained during performance of the same task and with the same subjects. In the first such experiment by Heinze and colleagues (7), subjects were required to direct their attention to the right or left half of bilateral symbol arrays that were flashed in rapid sequence, while maintaining central fixation (Fig. 2). Separate runs of attend-left, attend-right, and passive trials were carried out in two separate sessions, the first with ERP recordings from 30 scalp channels and the second with PET following intravenous injection of a positron emitting tracer (H2O15). In the ERP recording session, an enlarged P1 component was observed over the hemisphere contralateral to the attended visual field (Fig. 2A), in line with previous studies (34). Dipole modeling of the P1 attention effect was carried out on the subtracted attend-left minus attend-right scalp distributions to eliminate any nonspecific arousal or motivational effects. A pair of dipolar sources in the ventral extrastriate cortex of the fusiform gyrus provided an excellent fit to the P1 attention effect, accounting for 98% of the variance in the scalp voltage distribution within the P1 latency range (Fig. 2B).
In the PET session, significant blood-flow changes were observed in the posterior fusiform gyrus at a location that corresponded closely to that of the calculated P1 dipole (Fig. 2C). To further support the proposal that the enlarged contralateral P1 and the enhanced contralateral blood flow reflected the same pattern of attention-related neural activity, it was shown that dipolar sources calculated across the ERP waveform were situated closest to the locus of PET activation precisely at the peak of the P1 wave (110–130 ms). In addition, when dipoles were placed (seeded) at the fusiform site of PET activation, they accounted for over 96% of P1’s scalp voltage distribution. Thus, the combined ERP and PET evidence was consistent with the hypothesis that neural activity in the
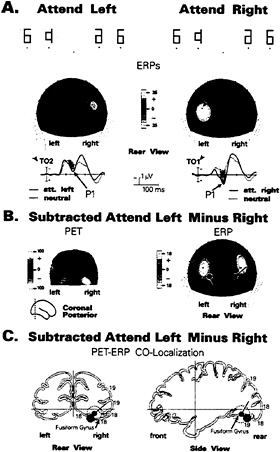
FIG. 2. (A) ERP waveforms and associated scalp current distributions of the P1 component (80–130 ms) in a spatial attention task (7) in which subjects attended to either the right or left halves of flashed symbol arrays (Top). Spatial attention increased the P1 amplitude over the occipital scalp contralateral to the attended hemifield in relation to a neutral (passive) condition. (B) Comparison of PET activation foci during the same task (in a separate session) with the positions of model dipoles calculated (using BESA) to best fit the P1 attention effect. To eliminate any effects of general arousal, difference images were formed by subtracting the attend-right from the attend-left condition. The dipoles in the right and left hemispheres have opposite polarities due to their being calculated from the subtracted (attend-left minus attend-right) scalp distributions. (C) Anatomical localizations of the best-fit P1 dipole and center of PET activation (red circle) mapped onto brain sections from the Talairach and Tournoux (44) atlas. For simplicity, only right hemisphere data are shown. Dashed circle surrounding dipole indicates the zone where changes in dipole position had minimal (<2%) effects on residual model variance. The center of PET activation in the posterior fusiform gyrus is included within the range of error of the P1 dipole.
posterior fusiform gyrus was modulated by spatial attention over the latency range 90–130 ms.
A recent study by Mangun and colleagues (35) extended these findings by comparing ERP and PET activations during two conditions of lateralized spatial attention, the first identical to the symbol-matching task of Heinze et al. (7) and the second a simple dot detection task. The ERP recordings showed the typically enhanced contralateral P1 wave, but in this study two foci of PET activation were observed in the hemisphere contralateral to the attended visual field, one in the posterior fusiform gyrus as in the Heinze et al. study and a second in ventral-lateral extrastriate cortex of the middle occipital gyrus. It was found that P1 amplitude variations as a function of task difficulty covaried more closely with the fusiform PET activation, further supporting the hypothesis that this extrastriate region is the principal site of the neural activity indexed by the P1 attention effect.
Both the Heinze et al. and Mangun et al. studies presented the stimuli to be attended in the upper visual fields, above the horizontal meridian. A different pattern of results was found by Woldorff et al. (36) when bilateral stimuli were presented to the lower visual fields in a combined ERP/PET study of spatial attention. In this case, it was found that the principal locus of PET activation was in more dorsal occipital areas corresponding to Brodmann’s areas 18/19 of the hemisphere contralateral to the attended field. A weaker zone of PET activation was also seen in the fusiform gyrus, but dipole modeling of the P1 attention effect indicated a neural generator situated in the dorsal occipital area where PET activation was maximal. Woldorff et al. (36) suggested that the results of these different studies could be reconciled if spatial attention primarily affected neural activity in retinotopically organized visual cortical areas (such as V2, V3/VP, V4) within which the upper and lower field representations would be situated in ventral and dorsal occipital cortex, respectively. In this case, the fusiform gyrus activation that was seen with both upper and lower field stimuli may represent additional modulation of higher order areas of the ventral visual-processing stream.
In none of these combined PET/ERP studies was there any evidence for an influence of attention on visual processing in the primary visual cortex (V1). Further support for this finding comes from a study by Gratton (37) of spatial attention using a novel optical imaging technique that reveals localized patterns of cortical neuronal activity by passing near-infrared light through the head to an array of detectors over the scalp. This method offers better time resolution than either PET or fMRI so that the time course of optical input modulation following each stimulus could be determined in a design where flashed shapes were presented to the left and right visual fields in random order. Separate zones of optical signal modulation were observed in medial and lateral occipital cortex (corresponding to areas 17 and 19, respectively) in the hemisphere contralateral to stimulus presentation, but only the signals from extrastriate cortex varied as a function of spatial attention to the right or left field. The time course of this extrastriate attention effect corresponded approximately to that of the P1 effect seen in ERP studies (onset before 100 ms), and its localization in area 19 corresponded closely to that of the P1 dipole modeled by Clark and Hillyard (32).
The reported absence of attentional modulation of neural activity in area V1 as registered by all these techniques offers no support for the idea that geniculo-striate transmission may be under the control of spatial attention (20). However, there is a preliminary report (38) of increased activation shown by fMRI in area V1 contralateral to the attended visual field when a target shape had to be discriminated from surrounding distractors. If this effect proves reliable, it will be necessary to verify its timing with ERP or magnetic recordings to determine whether the initial afferent input into V1 is affected by attention or whether the observed blood-flow changes are a consequence of delayed feedback from higher visual areas projecting back to V1. Recent observations of spatially selective attention effects on single neuron firing rates in monkey area V1 (39) suggest that further efforts to identify similar effects in humans would be worthwhile.
Although no clear evidence has yet been presented for early modulation of V1 activity with attention in humans, the short latency of the extrastriate P1 effect (onset at 70–80 ms) suggests that spatial attention first affects visual processing at a level not far above V1 and perhaps as early as V2 (36). Thus, the initial stimulus selection/amplification takes place in pos-
terior extrastriate cortex at a level where only elementary visual features and patterns are represented and prior to anterior temporal lobe areas where full recognition occurs (18, 40). These spatio-temporal properties of the P1 attention effect provide strong evidence in favor of “early selection” theories of attention, which specify that sensory inputs are selectively modulated during sensory/perceptual processing prior to stimulus identification (e.g., refs. 10 and 41). Further support for an early selection mechanism comes from observations that P1 amplitudes are enhanced for all stimuli occurring at an attended location, whether those stimuli are the relevant events being discriminated or task-irrelevant probes (27, 34). Thus, at the earliest stage, spatial attention seems to modulate inputs solely according to their location without regard to their identity.
The N1 component is generally enhanced along with the P1 to attended-location stimuli (see Fig. 1), but much less is known about its neural origins. The N1 consists of a complex of at least three separate subcomponents that are associated with current flows over frontal (peaking at 140 ms). parietal (150–160 ms), and occipital (170–190) scalp areas (32), but a detailed analysis of the underlying sources is lacking. Nonetheless, some observed dissociations between the P1 and N1 attention effects suggest that they reflect different aspects of spatial attention (reviewed in ref. 28). In particular, in a task where subjects were cued by an arrow or arrows as to the location(s) where a near-threshold target might occur, the ERP to a valid (precued) target stimulus showed an enlarged occipital N1 component relative to a neutral cue condition (all locations precued). whereas an invalid target elicited a smaller P1 than did the neutrally cued target (25). In other words, the “costs” of spatial cueing were associated with a suppression of inputs from unattended locations at an early (80–130 ms) stage, whereas the “benefits” of cueing were associated with an enhancement of signals arising from attended locations at a later stage (130–180 ms). This ERP evidence thus suggests that spatial attention involves two qualitatively different mechanisms for suppression and enhancement, respectively, which act at different levels of the visual pathways.
The Timing of Feature Selections. In marked contrast with spatial attention, the selection of stimuli on the basis of nonspatial features such as color or shape is not associated with a modulation of the evoked P1 and N1 components. Instead, stimuli having relevant or attended features elicit a broad negative ERP termed the “selection negativity” (SN), which begins between 140 and 180 ms poststimulus and persists for another 200 ms or more (42). The SN is best observed in difference potentials (e.g., Fig. 3A) in which the ERP elicited by a stimulus with the unattended feature value (e.g., a blue stimulus when red is attended) is subtracted from the ERP elicited by the same stimulus when it has the relevant value of the attended feature (e.g., a blue stimulus when blue is attended). The onset of the SN waveform thus provides a high-resolution measure of the time at which a particular feature or feature conjunction is discriminated and selectively processed according to its task relevance. In addition, localizing the neural source(s) of the SN can provide information about the specific brain areas that participate in attentional selection of different stimulus features.
In a recent study (43), we attempted to determine the timing and anatomical sources of the SN and associated ERP components during attention to color. In different experimental conditions, subjects attended to either red or blue checkerboards that were randomly intermixed in rapidly presented sequences at fixation. The task was to detect an occasional slight dimming of the attended-color checkerboards (targets). ERP components associated with color-selective attention were isolated in difference waves formed by subtracting the ERP elicited by a given colored stimulus when it was not attended from the ERP elicited by the same stimulus when it
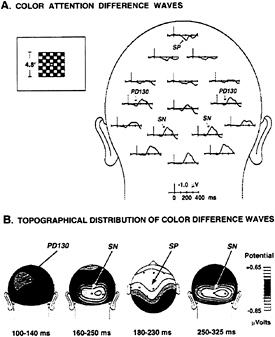
FIG. 3. (A) Grand average ERP difference waves in a color task (43) in which red and blue flashed checkerboards were presented in a rapid, randomized sequence at the center of the screen. Stimulus durations were 100 ms, and stimulus onset asynchronies ranged from 150 to 450 ms. Either the red or blue checks were attended on separate runs. Difference waves were formed by subtracting ERPs to the unattended color from those to the attended color, collapsed over red and blue stimuli. Attention-related components include a posterior selection negativity (SN), an anterior selection positivity (SP), and an early positive difference (PD130). (B) Scalp voltage distributions of attention-related ERP difference components at different latency ranges.
was attended (Fig. 3A). The difference waves included a prominent SN elicited during the interval 160–350 ms after stimulus onset, which had a scalp distribution narrowly focused over posterior visual cortex (Fig. 3B). A smaller “selection positivity” (SP) appeared during this same interval over the anterior scalp. The earliest ERP elicited during color attention, however, was a small positive deflection that peaked at 130 ms (PD130), with maximum amplitude over occipital-parietal cortex.
Dipole modeling using the BESA algorithm (3) was used to identify sources of the successive components in the color-attention difference waves. Symmetrical pairs of dipoles that provided the best fit to the ERP scalp distributions were calculated (Fig. 4A) and subsequently coregistered onto corresponding MRI images to evaluate their anatomical origins (Fig. 4B). The initial PD130 wave was well accounted for by a generator in dorsal-lateral occipital cortex (dipoles 1 and 2), whereas the major SN deflection onsetting at 160 ms was associated with sources in ventral occipital cortex near the collateral sulcus (dipoles 3 and 4). Subsequent shifts in SN topography were linked to sources in premotor cortex (dipoles 5 and 6, onsetting at 190 ms) and more anterior occipitotemporal regions of the fusiform gyrus (dipoles 7 and 8, onsetting at 240 ms). The locations of these dipoles were transformed into standard coordinates of the Talairach and Tournoux (44) atlas and were compared with the cortical areas previously identified in blood-flow neuroimaging studies as being involved in color-selective processing (Fig. 4C). Each of
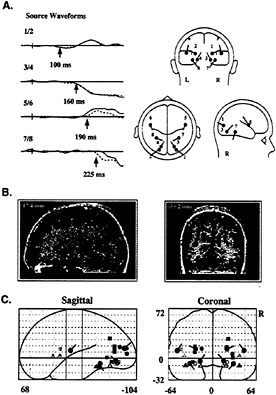
FIG. 4. (A) Set of dipoles (Right) and source waveforms (Left) in the best-fit BESA model of the attention-related ERP difference components shown in Fig. 3. Dipolar sources were constrained to be mirror-symmetrical in location across the hemispheres (left hemisphere, solid line; right hemisphere, dashed line). Note that dipoles 1 and 2 provided a best fit to the PD130 component, with activity beginning at 100 ms. The principal SN dipoles (3 and 4) and source waveforms are shown in red. The remaining dipoles account for subsequent, overlapping phases of the SN-SP complex, with onset times as indicated for each dipole pair. (B) Examples of how calculated dipole locations were coregistered with anatomical MRI sections. In this instance, dipoles 3 and 4 were localized to the fusiform gyrus of the occipital cortex. (C) Projections of mean dipole positions in the coordinate system of the Talairach and Tournoux (44) atlas, superimposed upon coordinates of PET or fMRI activations in previous studies of color-selective processing [solid squares, Corbetta et al. (17); outlined squares, Clark et al. (56); solid circles, Gulyas et al. (57); solid triangles, Martin et al. (58); outlined circles, Zeki et al. (59); outlined triangles. Sakai et al. (60)]. Activations shown in green lie close to dipoles 1 and 2; in red, to dipoles 3 and 4; in orange, to dipoles 5 and 6; and, in blue, to dipoles 7 and 8.
the dipole locations corresponded closely to brain areas that have been activated during color processing in PET or fMRI studies, thus providing converging evidence for the validity of the inverse source calculations.
Taken together, this evidence from ERP and blood-flow neuroimaging studies indicates that an initial selection for color takes place in dorsal occipital cortex starting at around 100 ms, followed by a more pronounced selective processing of the attended-color stimuli in the posterior fusiform gyrus/ collateral sulcus starting at around 160 ms. This cortical region around the collateral sulcus has shown color-specific activation in many previous neuroimaging studies (Fig. 4C) and probably corresponds to area V4 identified in monkey studies as the major cortical center for coding and analysis of color information (16). Both ERP and blood-flow neuroimaging data thus indicate that attention to color enhances neuronal activity in this region (17, 33). Subsequent ERP components seem to reflect motor preparatory activity in premotor cortex (starting at 190 ms) and higher level color-selective processing along the ventral occipito-temporal pathway (starting at 240 ms). Thus, the juxtaposition of ERP and neuroimaging data makes it possible to trace the time course of stimulus-selective processing through successive stages of the visual pathways.
A prominent SN is also generated when stimuli are selected on the basis of other nonspatial features such as spatial frequency (45, 46), orientation (47, 48), direction of motion (31), and shape (49). The onset latencies of these SNs vary over the range of 125–200 ms, depending on the relative discriminability of the attended and unattended features. Differences in scalp topography have been reported for SNs associated with different types of feature selections (31, 50), which indicates that separate cortical areas are engaged in processing the task-relevant cues.
Multifeature Processing and Selection Hierarchies. Object identification requires that the various features of a stimulus be combined into a single percept. The question of how these features, probably represented in different cortical areas, become unified in a single representation has been termed the “binding problem” (51). A vigorously debated issue in the attentional literature is whether selection for location plays a special role relative to selection of other stimulus features. Treisman’s Feature Integration Theory, for example, states that spatial selection is a prerequisite for the correct binding of visual features into objects (51–53). An alternative view, however, suggests that all stimulus properties, including spatial location, are encoded in parallel across the visual field and processed to the level of object identification (54, 55).
ERPs can be used to examine the relationship between spatial and feature selection, as they provide a real-time index of the selective operations involved in the analysis of an object’s properties. In a recent experiment by Anllo-Vento and Hillyard (31), pairs of adjacent colored squares were flashed sequentially to produce a perception of movement. These pairs were presented either to the left or right visual field in a rapid randomized sequence (Fig. 5A). Subjects were asked to attend selectively to stimuli in one visual field and to detect slower moving targets that contained the critical value of the attended feature, be it color or movement direction. Separate runs were carried out for selection by color (red versus blue) or by movement direction (horizontal versus vertical). Thus, to perform the task correctly, subjects needed to discriminate (i) the location to be attended (left or right visual field), (ii) the relevant stimulus feature (color or direction of motion), and (iii) the speed of movement of the occasional targets (fast or slow).
Selection of the attended spatial location was reflected in an amplitude modulation of the P1 and N1 components, starting at approximately 80 ms poststimulus (Fig. 5B): this is another example of the attentional amplification associated with spatial selection discussed above. In contrast, selection of the relevant feature (color or direction of motion) was indexed by a broad SN that extended between 150 and 300 ms, followed by a later positivity. Significantly, the SN was only elicited by stimuli having the attended feature at the attended location (thick tracings) and not at the unattended location (thin tracings). In other words, the feature (color or movement direction) selection was strongly contingent upon the prior spatial selection. Finally, the discrimination of the infrequent change in speed of movement (i.e., the target) requiring a manual response was associated with an N2 and late positive component (LPC) beginning between 250 and 300 ms after stimulus onset. It is important to note that all of these ERP measures of spatial and feature-selective processing preceded the motor response times by several hundred milliseconds. The timing and waveform of these ERP indices were very similar whether subjects
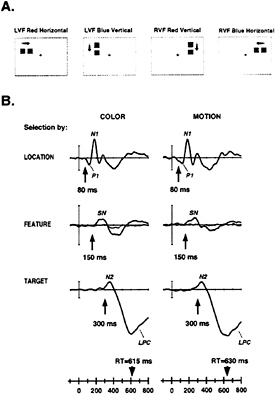
FIG. 5. (A) Sample stimuli from study by Anllo-Vento and Hillyard (31). Stimuli were presented to the left and the right visual field (LVF and RVF, respectively) in random order. Each stimulus consisted of a pair of briefly flashed adjacent squares separated by a short time interval (50 or 150 ms), which was perceived as a square moving in the direction of the arrow. Infrequent target pairs (150-ms separation) seem to move more slowly than standard pairs (50-ms separation). Stimulus color (red, blue), field of presentation (left, right) and movement direction (vertical, horizontal) were all randomized. (B) Subtracted ERP difference waves reflecting the hierarchical selection of location, feature, and target under attend-color (Left) and attend-motion (Right) conditions. Selection of the relevant visual field location (Top) was reflected in the difference wave formed by subtracting the ERP to the unattended field from the ERP to the attended field: difference ERPs shown are from contralateral occipito-temporal sites and show attentional modulation of the P1 and N1 components starting at 80 ms. Selection by feature (Middle) was indexed by the SN component beginning at about 150 ms and was seen in the difference waves formed by subtracting the ERP to the unattended feature value from the ERP to the attended feature value for stimuli at the attended location (thick line), but not at the unattended location (thin line). Selection of targets (movement speed) was reflected in N2 and LPC components beginning at 250–300 ms and was apparent in the difference waves formed by subtracting the ERPs to the nontarget (fast-moving) stimuli from the target (slow-moving) stimuli presented at the attended location and having the attended feature value. Mean motor reaction time (RT) is shown on time base for each condition.
were attending to color, a stimulus property mediated by the ventral visual pathway, or direction of motion, a feature presumably processed by the dorsal visual pathway. However, differences in scalp distribution between the SNs associated with color and motion selection were indicative of separate cortical origins.
These results suggest that the registration and processing of an object’s features in both the ventral and dorsal pathways can be strongly gated by spatial attention. More specifically, the selective processing of nonspatial features reflected in the SN, N2, and LPC components is strongly dependent upon the prior selection for location, reflected in the P1 and N1 components. This hierarchical relationship supports early selection theories that propose attentional control over perceptual processing and seems to conflict with the late selection view that different stimulus attributes are processed in parallel at all locations (54, 55). Moreover, the different ERP configurations associated with spatial and nonspatial selections provide strong evidence that attention to location operates via qualitatively different mechanisms from attention to other stimulus features. In sum, it seems that attention to location is indeed “special” (52, 53) and plays a unique role in feature integration.
CONCLUSION
The studies reviewed above illustrate how ERP and neuroimaging data can be combined to reveal both the spatial and temporal properties of neural activity during selective attention. As we have noted, such physiological data can supply converging operations for testing alternative psychological models of attention derived from behavioral studies (21). Information about the physiological bases of attention in humans also provides an essential link with the rapidly expanding literature on animal studies of attention (16, 18, 19). By comparing the spatio-temporal configurations of neural activity in homologous brain regions during the performance of comparable tasks across species, the validity of animal models of human attentional processes can be properly established. A close interplay between human and animal investigations will be required to learn how stimulus information is encoded, transformed, and selectively processed by the brain’s attentional systems.
We thank our current and former colleagues who have made essential contributions to the work reported here: Vince Clark, Hajo Heinze, Hermann Hinrichs, Steve Luck, Ron Mangun, Tom Münte, and Marty Woldorff. Jon Hansen, Matt Marlow, Carlos Nava, and Theresa Rubin provided valuable technical assistance. This research was supported by Office of Naval Research Grant N00014–93–I–0942, National Institute of Mental Health Grant MH25594, National Institutes of Health Grant NS 17778, and the San Diego McDonnell-Pew Center for Cognitive Neuroscience.
1. Fox, P.T. & Woldorff, M.G. (1994) Curr. Opin. Neurobiol. 4, 151–156.
2. Picton, T.W., Lins, O.G. & Scherg, M. (1994) in Handbook of Neurophysiology, eds. Boller, F. & Grafman, J. (Elsevier Science, Amsterdam), Vol. 9, pp. 429–499.
3. Scherg, M. (1990) in Auditory Evoked Magnetic Fields and Potentials. Advanced Audiology, eds. Grandori, F., Hoke, M. & Romani, G.L. (Karger, Basel), Vol. 6, pp. 40–69.
4. Gevins, A., Leong, H., Smith, M.E., Le, J. & Du, R. (1995) Trends Neurosci. 18, 429–436.
5. Dale, A.M. & Sereno, M.I. (1993) J. Cognit. Neurosci. 5, 162–176.
6. Cuffin, B.N. (1996) IEEE Trans. Biomed. Eng. 43, 299–303.
7. Heinze, H.J., Mangun, G.R., Burchert, W., Hinrichs, H., Scholz, M., Münte, T.F., Goes, A., Scherg, M., Johannes, S., Hundeshagen, H., Gazzaniga, M.S. & Hillyard, S.A. (1994) Nature 372, 543–546.
8. Mangun, G.R., Hopfinger, J.B. & Heinze, H.J. (1998) Behavioral Research Methods Instrumentation and Computers, in press.
9. Rugg, M.D. & Coles, G.H. (1995) Electrophysiology of Mind: Event-Related Brain Potentials and Cognition (Oxford University Press, Oxford).
10. Naatanen, R. (1992) Attention and Brain Function (Lawrence Erlbaum Associates, Hillsdale, NJ).
11. Mesulam, M.M. (1990) Ann. Neurol. 28, 597–613.
12. Nobre, A.C., Sebestyen, G.N., Gitelman, D.R., Mesulam, M.M., Frackowiak, R.S.J. & Frith, C.D. (1997) Brain 120, 515–533.
13. Corbetta, M., Miezin, F.M., Shulman, G.L. & Petersen, S.E. (1993) J. Neurosci. 13, 1202–1226.
14. Posner, M.I. & Dehaene, S. (1994) Trends Neurosci. 17, 75–79.
15. LaBerge, D. (1995) in The Cognitive Neurosciences, ed. Gazzaniga, M.S. (MIT Press, Cambridge, MA), pp. 649–661.
16. Desimone, R., Wessinger, M., Thomas, L. & Schneider, W. (1990) Cold Spring Harbor Symp. Quant. Biol. 55, 963–971.
17. Corbetta, M., Miezin, F.M., Dobmeyer, S., Shulman, G.L. & Petersen, S.E. (1991) J. Neurosci. 11, 2383–2402.
18. Desimone, R. & Duncan, J. (1995) Annu. Rev. Neurosci. 18, 193–222.
19. Luck, S.J., Chelazzi, L., Hillyard, S.A. & Desimone, R. (1997) J. Neurophysiol. 77, 24–42.
20. Crick, F. (1984) Proc. Natl. Acad. Sci. USA 81, 4586–4590.
21. Hillyard, S.A., Mangun, G.R., Woldorff, M.G. & Luck, S.J. (1995) in The Cognitive Neurosciences, ed. Gazzaniga, M.S. (MIT Press, Cambridge, MA), pp. 665–681.
22. Mangun, G.R. (1995) Psychophysiology 32, 4–18.
23. Hillyard, S.A. & Mangun, G.R. (1987) in Current Trends in Event-Related Potential Research, eds. Johnson, R., Jr., Rohrbaugh, J.W. & Parasuraman, R. (Elsevier Science, Amsterdam), pp. 61–67.
24. Mangun, G.R. & Hillyard, S.A. (1991) J. Exp. Psychol. Hum. Percept. Perform. 17, 1057–1074.
25. Luck, S.J., Hillyard, S.A., Mangun, G.R. & Gazzaniga, M.S. (1994) J. Cognit. Neurosci. 6, 84–91.
26. Anllo-Vento, L. (1995) Int. J. Neurosci. 80, 353–370.
27. Luck, S.J., Fan, S. & Hillyard, S.A. (1993) J. Cognit. Neurosci. 5, 188–195.
28. Luck, S.J. & Hillyard, S.A. (1995) Int. J. Neurosci. 80, 281–297.
29. Mangun, G.R., Hillyard, S.A. & Luck, S.J. (1993) in Attention and Performance XIV, eds. Meyer, D. & Kornblum, S. (MIT Press, Cambridge, MA), pp. 219–243.
30. Gomez, C.M., Clark, V.P., Luck, S.J., Fan, S. & Hillyard, S.A. (1994) Brain Topogr. 7, 41–51.
31. Anllo-Vento, L. & Hillyard, S.A. (1996) Percept. Psychophys. 58, 191–206.
32. Clark, V.P. & Hillyard, S.A. (1996) J. Cognit. Neurosci. 8, 387–402.
33. Clark, V.P., Fan, S. & Hillyard, S.A. (1995) Hum. Brain Mapp. 2, 170–187.
34. Heinze, H.J., Luck, S.J., Mangun, G.R. & Hillyard, S.A. (1990) Electroencephalogr. Clin. Neurophysiol. 75, 511–527.
35. Mangun, G.R., Hopfinger, J., Kussmaul, C.L., Fletcher, E. & Heinze, H.J. (1997) Hum. Brain Mapp. 5, 273–279.
36. Woldorff, M.G., Fox, P.T., Matzke, M., Lancaster, J.L., Veeraswamy, S., Zamarripa, F., Seabolt, M., Glass, T., Gao, J.H., Martin, C.C. & Jerabek, P. (1997) Hum. Brain Mapp. 5, 280–286.
37. Gratton, G. (1997) NeuroReport 8, 1749–1753.
38. Worden, M. & Schneider, W. (1996) Soc. Neurosci. Abstr. 22, 1856.
39. Motter, B.C. (1993) J. Neurophysiol. 70, 909–919.
40. Unserleider, L.G. & Haxby, J.V. (1994) Curr. Opin. Neurobiol. 4, 157–165.
41. Reinitz, M.T. (1990) Percept. Psychophys. 47, 497–505.
42. Harter, M.R. & Aine, C.J. (1984) in Varieties of Attention, eds. Parasuraman, R. & Davies, D.R. (Academic Press, London), pp. 293–321.
43. Anllo-Vento, L., Luck, S.J. & Hillyard, S.A. Hum. Brain Mapp., submitted for publication.
44. Talairach, J. & Tournoux, P. (1988) Co-Planar Stereotaxic Atlas of the Human Brain (Thieme, New York).
45. Harter, M.R. & Previc, F.H. (1978) Electroencephalogr. Clin. Neurophysiol. 45, 628–640.
46. Zani, A. & Proverbio, A.M. (1997) J. Psychophysiol. 11, 21–32.
47. Previc, F.H. & Harter, M.F. (1982) Percept. Psychophys. 32, 465–472.
48. Kenemans, J.L., Kok, A. & Smulders, F.T.Y. (1993) Electroencephalogr. Clin. Neurophysiol. 88, 51–63.
49. Smid, H., Mulder, G., Mulder, L. & Brands, G.J. (1992) J. Exp. Psychol. Hum. Percep. Perform. 18, 1101–1119.
50. Martinez, A., Anllo-Vento, L. & Hillyard, S.A. (1997) Soc. Neurosci. Abstr. 23, 1585.
51. Treisman, A. (1996) Curr. Opin. Neurobiol. 6, 171–178.
52. Treisman, A.M. & Gelade, G. (1980) Cognit. Psychol. 12, 97–136.
53. Treisman, A. (1993) in Attention: Selection, Awareness, and Control: A Tribute to Donald Broadbent, eds. Baddeley, A.D. & Weiskrantz, L. (Oxford Univ. Press, Oxford), pp. 5–35.
54. Duncan, J. & Humphreys, G.W. (1989) Psychol. Rev. 96, 433–458.
55. Duncan, J. & Humphreys, G.W. (1992) J. Exp. Psychol. Hum. Percept. Perform. 18, 578–588.
56. Clark, V.P., Parasuraman, R., Keil, K., Maisog, J.M., Karni, A., Ungerleider, L.G. & Haxby, J.V. (1995) Hum. Brain Mapp. 1, Suppl., 32.
57. Gulyas, B., Heywood, C.A., Popplewell, D.A., Roland, P.E. & Cowey, A. (1994) Proc. Natl. Acad. Sci. USA 91, 9965–9969.
58. Martin, A., Haxby, J.V., Lalonde, F.M., Wiggs, C.L. & Ungerleider, L.G. (1995) Science 270, 102–105.
59. Zeki, S., Watson, J.D.G., Lueck, C.J., Friston, K.J., Kennard, C. & Frackowiak, R.S.J. (1991) J. Neurosci. 11, 641–649.
60. Sakai, K., Watanabe, E., Onodera, Y., Uchida, I., Kato, H., Yamamoto, E., Koizumi, H. & Miyashita, Y. (1995) Proc. R. Soc. London B 261, 89–98.


