
Proc. Natl. Acad. Sci. USA
Vol. 95, pp. 22–28, January 1998
Colloquium Paper
This paper was presented at a colloquium entitled “The Age of the Universe, Dark Matter, and Structure Formation,” organized by David N.Schramm, held March 21–23, 1997, sponsored by the National Academy of Sciences at the Beckman Center in Irvine, CA.
Galaxies and large scale structure at high redshifts
CHARLES C.STEIDEL
Palomar Observatory, California Institute of Technology, 105–24, Pasadena, CA 91125
ABSTRACT It is now straightforward to assemble large samples of very high redshift (z~3) field galaxies selected by their pronounced spectral discontinuity at the rest frame Lyman limit of hydrogen (at 912 Å). This makes possible both statistical analyses of the properties of the galaxies and the first direct glimpse of the progression of the growth of their large-scale distribution at such an early epoch. Here I present a summary of the progress made in these areas to date and some preliminary results of and future plans for a targeted redshift survey at z=2.7–3.4. Also discussed is how the same discovery method may be used to obtain a “census” of star formation in the high redshift Universe, and the current implications for the history of galaxy formation as a function of cosmic epoch.
Background
It is quite amazing to note the rate of change and progress in both theoretical and observational aspects of cosmology and galaxy formation in just the last year or two. As we have seen at this colloquium, many people will be surprised if we do not know the answers to most “Holy Grail” caliber questions in the next 5–10 years. Lest we fear that all of the questions on the minds of cosmologists will be answered and there will be nothing left to do. there will be the incredibly messy problem of how galaxy formation really works. We may well know in minute detail how many baryons we have to work with, and what the initial spectrum of density fluctuations was like on all relevant scales—even the values for mundane cosmological parameters like H0 and OM that would allow real calculations of luminosities and space densities (for example)—but still not really understand the galaxy formation process.
However, we can inch our way forward: the universe of galaxies well beyond z~1 has opened up to direct empirical study in the last couple of years, thanks largely to the new possibility of obtaining spectra of extremely faint galaxies with the Keck 10 m telescopes. There is also tremendous progress being made on distant galaxy studies using complementary techniques, such as measuring accurate metal abundances of high redshift galaxies using quasi-stellar object (QSO) absorption lines (1) and attempts to model the kinematics of possible massive disk galaxies at high redshift (2). In this contribution, I will focus on direct observations of high redshift galaxies, and in particular on the demonstrated efficiency with which galaxies can be preselected for spectroscopy using color criteria that depend on a guaranteed spectral feature, the redshifted Lyman continuum discontinuity at 912(1+z) Å.
As has been emphasized previously (3–7), the Lyman continuum break feature, which is illustrated in Fig. 1, does not depend on any specific assumptions about the interstellar medium of the galaxy or the precise intrinsic spectrum of a population of young stars. Even if galaxies were completely transparent to their own Lyman continuum radiation [a very unlikely possibility, given what we know about star-forming galaxies at other redshifts (8)], the ubiquitous UV opacity of intervening material guarantees an observed Lyman limit UV “drop-out” feature. This idea is so simple that, of course, it is not new; however, it is probably fair to say that searches for very high redshift galaxies were somewhat discouraged by work in the late 1980s and early 1990s in which it was shown that that the bulk of the so-called “faint blue galaxies” to apparent magnitudes of R~26 must lie at redshifts smaller than z~3 by virtue of the fact that at most a small fraction remained undetected in the U band, the shortest wavelength at which the effect of the Lyman discontinuity can be seen from the ground (9). As I will discuss, however, as constraining as this observation seemed at face value, there remained plenty of room for a large population of galaxies at high redshifts without violating the constraints (4, 5).
The fact that there seemed to be no detectable very high redshift galaxies (aside from radio galaxies) was consistent with the increasingly prevailing theoretical view that the galaxy formation process should involve the gradual build-up of both large-scale structure and individual galaxies, and at such high redshifts it might be expected that nothing would have had enough time to coalesce to the point where it could be observed as a luminous “proto-galaxy.” In fact, in most of these hierarchical scenarios, galaxies never pass through a phase in which a great deal of star formation is occurring in a single entity on a short time scale. This represents a paradigm shift from the “classical” view of galaxy formation inspired in the 1960s (10, 11) and carried forward to the early 1980s in which galaxy spheroids, or the bulges of spirals and elliptical galaxies, formed in a coordinated “burst” of star formation at early times, leading to the prediction that a population of very luminous, high redshift protogalaxies should be relatively straightforward to observe. Subsequent searches for these protogalaxies had turned up empty-handed for the most part (12, 13), implying one or more of the following: (i) the Lyman a emission line is not the best way to find high redshift objects due to the fact that it suffers preferential extinction because of the resonant scattering process (14); (ii) there are no protogalaxies (at least, none that have the properties expected), and individual star-forming units are too small to be detected at the levels of sensitivity of the surveys; or (iii) the classical picture of galaxy formation can be preserved if all of the protogalaxies are enshrouded in dust so that all of the UV photons are reprocessed into the far-IR.
As I will summarize below, it is now abundantly clear that there is prodigious star formation activity at very high redshifts: there are systems with star formation rates that are as
© 1998 by The National Academy of Sciences 0027–8424/98/9522–7$2.00/0
PNAS is available online at http://www.pnas.org.
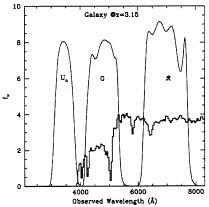
FIG. 1. A plot showing a model star forming galaxy at z=3.15, which has been modified to reflect the average opacity of the intergalactic medium, and also a reasonable interstellar medium in the galaxy itself. Superposed are the filter passbands that have been used for isolating such galaxies on the basis of the pronounced discontinuity at the rest frame Lyman limit, which in this model occurs at an observed wavelength of ~3,900 Å.
high or higher than at any other epoch observed to date (many are forming stars rapidly enough to be consistent with the classical picture of galaxy formation). Beyond that, there is a great deal of promise in early attempts to describe the star formation history of the universe since z≥4, but there are a number of caveats that must be heeded before the census is much more than broadly indicative. Finally, it is now entirely feasible to map out the large scale structures delineated by these early galaxies with presently available observational facilities. Initial attempts in these directions will be described below.
The Picture at z≤1
A strong motivation for pushing studies of galaxy evolution beyond z~1 is the relatively coherent picture of the z<1 universe that has resulted from a number of recently completed redshift surveys (15–18). Broadly speaking, there are two principle conclusions emerging from the studies, which at first glance may appear contradictory: first, the “luminosity density,” particularly at blue and UV rest wavelengths, is a strongly increasing function of redshift from the present time to z~1; second, it appears that “big” galaxies, or those that populate the bright end of the luminosity function and would generally fall into the morphological categories of early type spiral, S0, or elliptical, have evolved very little since z~1. Evidence for these statements appears to be very strong, as redshift surveys selected in many different ways yield the same qualitative results, and the results are also supported by Hubble Space Telescope (HST) morphological studies (19, 20) and by kinematic studies of individual galaxies (21). A simple (qualitative) way of reconciling the two general inferences is that the change in the luminosity density is dominated by relatively small galaxies undergoing enhanced star formation, whereas larger (more massive) systems evolve relatively quiescently. There is some evidence that near z~1 the enhanced star formation activity is beginning to “migrate” to more massive systems with increasing redshift (16). In any case, it is fairly clear that the “formation epoch” of most massive galaxies must be prior to the epoch corresponding to z~1. If the “bottom-up”, hierarchical picture of galaxy formation (often described using catch-phrases like “gradual merging of subgalactic fragments”) is correct, then apparently most of the activity relevant to the formation of massive galaxies must have occurred at much higher redshifts. It is unclear whether this challenges the prevailing theoretical views of galaxy formation, or not.
Beyond z~1
Prior to a couple of years ago, QSOs and radio galaxies represented our sole window into the high redshift (postrecombination) universe, with many very successful surveys accumulating an impressive number of objects (22–24). Still, it was not completely clear what these relatively rare, hyperluminous active galactic nuclei (AGN) were telling us about the state of the galaxy formation/evolution process in general, and their surface densities were too low to permit a great deal of information on their clustering properties on small and intermediate scales. There is reason to believe that the formation of luminous AGN and the formation of massive galaxies ought to go hand in hand, but in the end it would be very reassuring to see pure, unadulterated star formation at high redshift (should such a thing exist).
Our own attempts to understand the nature of “normal” galaxies beyond z~1 originally grew out of the perspective on the high redshift universe afforded by working in the area of QSO absorption lines. Here, while spectroscopic surveys for field galaxies were still turning up only a few galaxies beyond z~0.7 (circa 1990), metal line QSO absorption systems were known, as were their statistics and some details concerning their chemical and other physical properties, to well beyond z~3. The original motivation for a targeted search for galaxies associated with known QSO absorption systems at z>3 (3, 4) was that it would be a means of testing whether finding objects using the Lyman discontinuity would be viable, having seen that the Lyman α emission line searches were producing mostly null results. The reasoning was that, if an object whose redshift was known exactly, with an approximately known position (i.e., near the QSO line of sight), could be found using a specially designed set of broad-band filters optimized for the detection of Lyman continuum breaks near z~3, then one would simultaneously demonstrate that the technique works, and obtain a believable redshift (or, at least the basis for a plausibility argument) for something that would always remain impossible to confirm directly using conventional spectroscopy. Happily, it turns out that we were being overly pessimistic about the prospects for spectroscopy (7).
It is well known that the nature of the spectra of galaxies is such that there is very little in the way of spectroscopic features to facilitate secure redshifts for z≥1.3, when the [OII] λ3727 line (or the 4,000-Å break region for earlier type systems) begins to leave the useful spectroscopic window. It is also the case that observing samples of galaxies selected by apparent magnitude, although very useful for some purposes, will end up being a very inefficient means of accumulating large samples of the most distant galaxies, as the median redshift of even the faintest spectroscopic samples is still considerably smaller than z~1 (25). As it has turned out, obtaining spectra of galaxies at higher redshifts, say z≥2.7, is (practically speaking) considerably easier than in the “spectroscopic no man’s land” of the z~1–2.5 regime. The reason is that there are many strong spectral features (including the infamous Lyman α emission line in many cases, but also including very strong resonance lines in the rest-frame far-UV that are both interstellar and stellar in their origins) that appear in the wavelength range over which optical spectrographs have by far the best sensitivity and the lowest background. Because of this, it turns out to be relatively straightforward (given the Keck telescopes!) to obtain spectra of large samples of galaxies that
are photometrically selected to lie in a particular range of redshift, both to obtain a sample at a particular cosmic epoch with maximum efficiency and as a means of quickly accumulating probes in an essentially preselected volume, for studies of large-scale structure.
The photometric selection technique that we have been using (3–6) for the high redshift galaxies turns out to be extremely efficient, with more than 95% of the objects that are flagged as high redshift candidates resulting in confirmed high redshift galaxies when a successful spectrum is obtained; essentially all of the “interlopers” are Galactic K subdwarf stars. The convenient aspect of the z~3 redshift regime is that the characteristic colors of the galaxies are really unlike any of the foreground galaxies, as is illustrated graphically in Fig. 2, with the same diagram for the spectroscopically confirmed galaxies at the time of this writing shown in Fig. 3. This means that there is actually quite a bit that can be done using the photometric candidates alone, without follow-up spectroscopy [see the discussion below on the Hubble Deep Field (HDF) and the star formation history of the Universe]. However, the spectroscopy is an essential component for most studies of large-scale structure, and of course it has taken considerable effort to establish the reliability of the color selection parameters and explore parameter space enough to arrive at the optimum selection criteria. At the time of this writing, we have obtained confirming spectra of more than 250 z~3 galaxies selected from our ground-based images, taken from a List of candidates that numbers more than 1,000, in several high latitude fields.
The spectra themselves are very interesting (7, 26, 27), spanning a wide range of properties from objects dominated by a strong Lyman α emission line, to those with extremely strong Lyman α seen in absorption. The dominant spectral features,
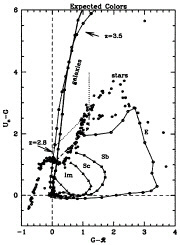
FIG. 2. The expected loci in the Un versus G—ℜ color plane of galixies from redshift zero to 3.6. The points along each curve are at intervals of 0.1 in ∆z. Note that at z~2.8 all models begin to ascend the “plume” into the region of the diagram that is uncontaminated by any other galaxy at any other redshifts. The dotted and dashed curves outline the regions from which we choose our high redshift galaxy candidates. Note that the only contaminants of the high redshift region are stars, which turn out to be subdwarfs of spectral type K. See reference 5 for more details.
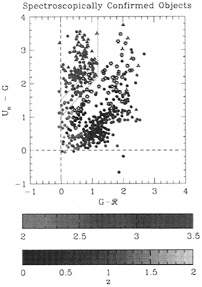
FIG. 3. A color-coded “realization of the plot in Fig. 2, showing the location of galaxies with spectroscopic redshifts and their locations in the color-color plane. Triangles represent objects that are undetected in the Un passband, so that the Un—G color is a lower limit. Note that in our primary color selection region, there are no galaxies at low redshift, and that in general all galaxies with z<2 [these are objects whose redshifts have been obtained by Cowie et al. (16) in the same fields we have used for the high redshift galaxy searches] are very well separated from the objects at very high redshift.
and the ones which often secure the redshifts, are strong interstellar lines of C II, O I, Si II, Si IV, Al II, and C IV. In the highest quality spectra, it is possible to separate high ionization stellar wind features from the interstellar lines of the same species, and also to identify purely photospheric stellar features that confirm the presence of O and B stars in the composite spectra. We have begun a program of near-IR spectroscopy with the aim being to both study the familiar nebular lines in the rest-frame optical (which can help make independent estimates of reddening and star formation rates) and also to attempt to obtain kinematic line widths that might be used to constrain masses. These are very challenging observations with 4 m class telescopes, but should be quite routine with near-IR spectrographs on 8–10 m telescopes. It has become clear from the few measurements we have made to date that neither the Lyman α emission lines nor the strong interstellar absorption features have velocities that are coincident with the true systemic velocities of the galaxies—the Lyman α line is redshifted, and the interstellar lines blue-shifted, with respect to systemic. It is clear that the interstellar lines are produced in outflowing material, and the Lyman α emission is likely severely affected by radiative transfer effects, so that unfortunately the far-UV is unlikely to be ultimately useful for studying the dynamics of these early galaxies (although it is potentially extremely useful for the study of the details of the stellar content of the galaxies, and the dynamical state and physical conditions in the interstellar medium).
The star formation rates in individual galaxies can be estimated directly from the flux density in the UV continuum (7, 28). Without any corrections for far-UV extinction (see
below), the star formation rates, assuming a Salpeter initial mass function, are in the range 6–70 M⊙·yr−1 for the currently most-favored cosmology (judging by the other talks at this meeting) of H0=65 km·s−1·Mpc−1 (Mpc=million parsec) and ΩM=0.2 (for simplicity, we will assume that ΩΛ=0 throughout). The surface density and inferred space density of high redshift galaxies have been previously discussed (5, 7, 27); although it is difficult to know exactly how to compare objects selected in the far-UV at high redshift with galaxies selected in the optical in relatively local redshift surveys, it is perhaps most fair to compare the distribution of inferred star formation rates in the high redshift galaxies with those seen in a local survey. Fig. 4 is a plot of a composite “star formation luminosity function” that is formed by combining the results of the ground-based survey (which represents a much larger sample at the high-star formation rate (SFR) end of the distribution) with that culled from color-selected objects in the HDF. The most striking feature of the diagram is that the abundance of very vigorously star forming objects is much higher at z~3 than in the local universe.
Given the far-UV selection criteria that are implicit in the use of the Lyman continuum break technique, it is of course difficult to assess the degree to which the sample is being censored by dust extinction; however, it is possible to estimate the importance of extinction (and its effects on the inferred star formation rates) for the observed objects with confirmed redshifts and measured spectral energy distributions. Given a model for the spectral energy distribution of unobscured star formation (30) coupled with the statistical blanketing due to intervening H I (6), we find that the level of extinction implied in our sample ranges from zero to about 2 magnitudes evaluated at 1,600 Å in the rest frame, with the “average” effective extinction ranging from a factor of 2–4 depending on the precise reddening curve adopted. Because the color selection criteria depend upon a moderately blue far-UV color to separate the objects from the locus of foreground galaxies in the color-color plane (see Figs. 2 and 3), we would probably have missed objects for which the far-UV extinction is more substantial than the above numbers. Thus, the star formation rates quoted above should be modified upward by a factor of 2–4 on average (although there is a possible trend for the most
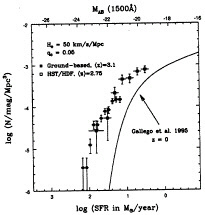
FIG. 4. A plot of the “star formation rate” function for the high redshift galaxies from the combined ground-based and HDF samples. The solid curve is the same function as determined for a local sample using Hα objective prism data (29).
intrinsically luminous objects to have somewhat larger extinction corrections). It is interesting to note that, after making the implied correction to the star-formation luminosity function shown in Fig. 4, the “knee” in the luminosity function would correspond to a star formation rate of nearly 100 M⊙·yr−1 and a space density at that luminosity of roughly the present density of ~L* galaxies. The point of this exercise is simply to show that, in fact, the distribution of star formation rates is quite compatible with the classical picture of rapid formation of luminous galaxies (bulges and spheroids) at high redshift, in which it would be possible to form a very large stellar mass on a time scale of <1 Gyr.
A lot has been made of the “small” sizes of faint galaxies in very deep HST images, such as the HDF. However, it is not really clear that this is the case for objects that are demonstrated to be intrinsically luminous. The typical measured half-light radii of z~3 galaxies in HST images is rh≈0.2–0.4 arc seconds (26, 28, 31). Adopting once again the current “maximum likelihood” cosmology, at z~3 this corresponds to scale lengths of 2–4 kiloparsecs (kpc), which is quite comparable to the scale lengths of large galaxies today, and much larger than typical starburst galaxies in the local Universe (32) as seen in the far-UV. It should be remembered that these are scale lengths, not total sizes. Coupled with the fact that the galaxies are being observed in the rest-frame far-UV, the apparent compactness is a result (at least in part) of the fact that there is severe cosmological surface brightness dimming by z~3 and HST is best at revealing high surface brightness structure. In short, there is no direct support for the assertion that individual objects harboring high star formation rates at high redshift are “small”. As an illustration. Fig. 5 shows two different “stretches” of the same z~3 galaxy (it is an exceptionally luminous one, but one which has a typical scale length). There is a dominant core that carries perhaps 90% of the light (Fig. 5 Right), whereas to lower surface brightness, the diameter of the galaxy approaches 15–20 kpc for the adopted cosmology.
Large Scale Structure at z~3
At very high redshift, it will be extremely difficult, if not impossible, to ever construct as comprehensive a redshift survey as the monumental surveys that have been completed recently (or are planned for the near future) in the relatively nearby universe for the purposes of studying the large-scale distribution of galaxies (ref. 33 and M.Geller, unpublished work). Nevertheless, we have reached a point where the selection techniques and follow-up spectroscopy have become efficient enough that a real attempt to evaluate structure in the high redshift universe is feasible. Toward this end, we have
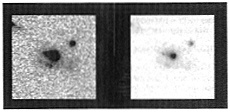
FIG. 5. A HST/Planetary Camera image of a star-forming galaxy at z=2.961. (Left) Picture shows high contrast to illustrate the relatively large extent of the galaxy at lower surface brightness. (Right) Picture shows lower contrast to show the compact core. The full size of the region shown is 3n across, or ~30 kpc for ΩM=0.2, H0= 65 km·s−1·Mpc−1. The compact source to the upper right is an unrelated foreground object.
begun to concentrate our spectroscopic efforts in relatively large (~10 by 20 arc minutes) regions on the sky, using the proven efficiency of the Lyman break color selection technique to isolate a particular volume along the line of sight which corresponds roughly to a Gaussian redshift distribution centered at z~3.08 with a characteristic σ(z)≈0.21 Thus, the effective depth is ∆z~0.5 centered at z=3.1, or a comoving distance along the line of sight of ![]() Mpc (q0=0.1), which is roughly equivalent in depth to a redshift survey reaching to cz~50,000 km·s−1 in the local universe. Of course, transverse to the line of sight the dimensions will be much smaller, on the order of 20 by 10 Mpc (comoving) for the same cosmology. One nice aspect of focusing on a particular redshift range at high redshift, aside from the high efficiency, is that a given angular scale at the telescope gains you a correspondingly larger transverse comoving scale (i.e, our survey areas are equivalent to fields of ~50 by 25 arc minutes at z=0.5). Because predictions of various flavors of structure formation scenarios and cosmologies differ most markedly at the highest redshifts, it is hoped that significant constraints on models will result from a well-controlled survey at the highest (currently) practical redshifts; at the very least, there will be a lot of data!
Mpc (q0=0.1), which is roughly equivalent in depth to a redshift survey reaching to cz~50,000 km·s−1 in the local universe. Of course, transverse to the line of sight the dimensions will be much smaller, on the order of 20 by 10 Mpc (comoving) for the same cosmology. One nice aspect of focusing on a particular redshift range at high redshift, aside from the high efficiency, is that a given angular scale at the telescope gains you a correspondingly larger transverse comoving scale (i.e, our survey areas are equivalent to fields of ~50 by 25 arc minutes at z=0.5). Because predictions of various flavors of structure formation scenarios and cosmologies differ most markedly at the highest redshifts, it is hoped that significant constraints on models will result from a well-controlled survey at the highest (currently) practical redshifts; at the very least, there will be a lot of data!
We have only recently entered full “production mode” in this survey, but the first field in which we accumulated a significant number of redshifts over the full survey area has already yielded some interesting results. As shown in the Fig. 6, the redshift histogram from the SSA22 field has conspicuous “spikes,” the most prominent of which, at z=3.09, is highly significant statistically and has an apparent velocity “dispersion” of σ(z)=700 km·s−1. A map of the field is also shown in Fig. 6, where the distribution of objects comprising the two most prominent features in the redshift histogram are indicated with circles and squares. Evidently, the z=3.09 structure is at least ~15 by 10 Mpc (comoving) on a side (ΩM=0.2, H0 =65). It is of course difficult to reach firm conclusions on the nature of such structures given relatively sparse statistics in a single field; however, preliminary indications, from both fluctuations in overall surface density of Lyman break candidates, and from other fields in which we are accumulating spectroscopic redshifts, are that these features are generic to the high redshift galaxy distribution, just as they seem to be at all other redshifts probed (35). If this is the case, then the large transverse scale of the structures suggests the presence of “walls” and voids, rather than overdensities that would become, for example, present day clusters of galaxies. We are in the process of converting our redshifts into a galaxy correlation function; even more straightforward is to use the photometrically selected galaxies and the known (relatively narrow) range of redshifts to calculate w(θ), the angular correlation function, for a much larger sample, which is also in the works. All of these results will be forthcoming as we catch up with the rather intensive data collection process. It is our hope to complete ~6 fields, each of approximately 200 square arc minutes, with ~100 redshifts within our sampled volume per field, within the next year.
The HDF and the Global History of Star Formation
The HDF (36) has provided a small, but incredibly deep, glimpse of what is out there at the faintest flux levels, as well as high quality morphologies and accurate colors for what would previously have been considered extremely faint galaxies. By design, the HDF data included a suite of filters that spanned nearly the full range of sensitivity of the charge-coupled device (CCD) detectors, and could be used, for example, to explore “Lyman break” galaxies to much fainter flux levels than is practical from the ground. Moreover, the F300W filter, whose passband extends well below what would be limited by the UV atmospheric cutoff from the ground, allows identification of Lyman break objects to significantly
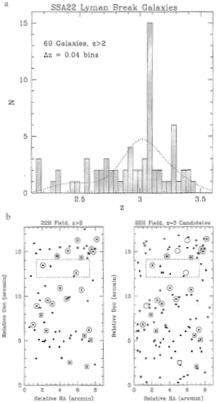
FIG. 6. (a) The redshift histogram of the 69 color-selected and spectroscopically confirmed objects in the SSA22 field from a region ~9′ by 18′ on the plane of the sky. The dotted curve represents the overall selection function of the color selection method, normalized to the same number of galaxies as observed, (b) Maps of the sky in the SSA22 field. (Left) Shown are the positions of the objects that have been spectroscopically confirmed. (Right) Shown are all the positions of the photometrically selected candidates. Circled objects are objects within the “spike” at z=3.09, whereas squares indicate objects in the secondary spike at z=3.29. The objects indicated with stars are two newly discovered QSOs found with the same selection method.
smaller redshifts (down to z~2), thereby providing coarse redshifts in some of the redshift range that is the most difficult spectroscopically. The Lyman break galaxies in the HDF have already been exploited as spectroscopic targets with the Keck telescope (26, 27) when they have been brighter than IAB~25, and to extend the technique to much fainter flux limits photometrically (37, 38). We have continued to follow up the HDF region, with ground based images in the UnG![]() photometric system, to complement at shallower depth the searches for high redshift galaxies. Fig. 7 shows the current redshift histogram for spectroscopically confirmed Lyman break objects in the HDF region, which consists of a 9′ by 9′ field centered on the region imaged by HST. As can be seen, there are clear signs of the same kind of “wall/void” structure as seen in the SSA22 field above.
photometric system, to complement at shallower depth the searches for high redshift galaxies. Fig. 7 shows the current redshift histogram for spectroscopically confirmed Lyman break objects in the HDF region, which consists of a 9′ by 9′ field centered on the region imaged by HST. As can be seen, there are clear signs of the same kind of “wall/void” structure as seen in the SSA22 field above.
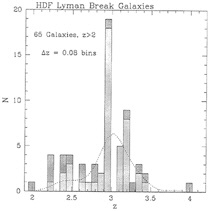
FIG. 7. The redshift histogram for z>2 galaxies in the HDF region. The light histogram includes all galaxies from a 9′ square field centered on the HDF that were found using the ground-based color selection, whereas the darker histogram indicates objects selected in the central HDF using the HST filter system; the latter includes 11 redshifts presented in ref. 27. The dotted curve is the selection function for the ground-based color selection, normalized to the light histogram.
The depth of the HDF images and the wide color baseline has provided license for taking the Lyman break technique one step farther. It is possible to search for objects whose colors exhibit discontinuities in successively redder passbands, so that a crude census of the total star formation per unit volume vs. redshift may be obtained, assuming that the efficiency of the color technique remains as successful beyond z~3. As pointed out by Madau et al. (37), the far-UV flux is a fairly direct means of measuring the massive star formation rate, and therefore is closely related to the rate at which metals are being produced; by assuming an initial mass function, the observations can be turned into a total star formation rate per unit volume as a function of cosmic epoch. To the high redshift points from the HDF, one splices on lower redshift UV luminosity density measurements from deep redshift surveys (39) and a local survey of global star formation (29). The result is a “cartoon” history of star formation in the universe (37, 40). There are a number of potential worries in taking this kind of curve too literally; first, the points at different redshifts have been obtained using quite different methods: H-α emission at z~ 0. flux density near rest-frame 2,500 Å in the z=0.3–1 range, and flux density near rest-frame 1,500 Å in the z>2 regime. Extinction corrections, which have not been applied to any of the data sets, will be most severe for the high redshift points for a given amount of “reddening.” Cosmology will also clearly matter, because both luminosity and volume as a function of z are extremely sensitive to ΩM (and to a lesser degree ΩΛ) at the higher redshifts. [It is worth pointing out, however, that the points at z>2 have been obtained in a consistent manner, so that unless the effects of dust are more important at z≳4 than at z~3 (which seems unlikely), the rapid decline in the global massive star formation rate at z>3 is very unlikely to be spurious; nevertheless, it needs to be confirmed with a larger sample of objects.] For the purposes of illustration, I have taken the curve from ref. 40 and made adjustments that reflect (at all redshifts) the degree of reddening inferred to be present in the high redshift galaxy population, made small corrections that make the star formation rate (SFR) calculations more consistent between the z<1 and z>2 samples, and converted
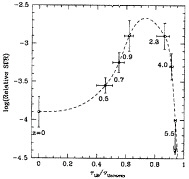
FIG. 8. A schematic diagram showing the relative star formation as a function of the cosmic epoch, adapted and modified from ref. 40. The abscissa is the lookback time in units of the age of the universe τUniverse. The redshift for the center of each bin in given below each data point—the z=0 point is from ref. 29, the z=0.5–0.9 points are from ref. 39. and the high redshift points are from Lyman break galaxies in the HDF (40). The dotted curve is a spline fit to the data points.
the redshift axis into a “lookback time” to emphasize how rapid the onset of luminous star forming galaxies really is (Fig. 8). The resulting curve, if taken literally (clearly dangerous), implies that ~75% of the total star formation (or, more precisely, the massive star formation or metal production) occurred prior to z~1, and that ~60–70% occurred in the redshift range z~1–3.5.
Again, it cannot really be claimed that a measurement has been made here, but the important point is that, apparently, the entire redshift range over which most of the “galaxy formation activity” took place is now observationally accessible. What is really encouraging is that the qualitative behavior of the “star formation luminosity density” with epoch mimics the behavior of the space density of luminous QSOs (23), and is consistent with the timescales seen for the chemical enrichment in QSO absorption line systems (1, 34, 41–44). The upshot is that, if one were asked to pinpoint the “Epoch of Galaxy Formation,” one could arguably say that it is now seen directly, in the redshift range 3.5≥z≥1, and that the “onset” of massive galaxy formation appears to be in the range z~3.5–4.
Concluding Remarks
It is likely that the last “Big Problem” to be solved in cosmology will be galaxy formation; that is, it is one thing to understand precisely the power spectrum of density fluctuations at decoupling and to have measured an accurate value of H0 and ΩM (and possibly ΩΛ), but it will be far more complicated to understand how those fluctuations actually turn into galaxies and structures on larger scales. There is a great deal of theoretical work at the moment to actually model the process of galaxy and structure formation, and there is reason to hope that the wealth of new data on the early evolution of the universe of galaxies will allow these models to be constrained. It is very helpful that many of these models now include, at some level, hydrodynamics of gas and star formation in addition to gravity; after all, this is what the observations tell us about most directly. Observers can go a long way toward meeting the theorists half-way by improving measurements of mass. Both are (or will be) very challenging.
Despite the fact that finding and observing very high redshift galaxies is now becoming relatively routine, we still have the
age-old problem that the “mapping” of these early galaxies to galaxies observed at subsequent cosmic epochs is not at all straightforward, and hence there is an unsatisfying amount of uncertainty in how to interpret what is finally being seen. Given the space densities, star-formation rates, luminosities, clustering properties, and morphologies at high redshift, coupled with what seems like overwhelming evidence of a population of mature galaxies by z~1, we have suggested that the “Lyman break” galaxies are in fact the massive galaxies of the present epoch caught in the act of forming their bulges and spheroids (7.31). This would be quite natural in the more classical picture of galaxy formation, but it is unclear (to me, at least) if the observations are still consistent with purely bottom-up hierarchical formation scenarios such as Cold Dark Matter. With the data floodgate now very much opened, it should only be a matter of time before the “truth” will be known, or, at least, we may know what is not the truth.
It is a pleasure to thank my collaborators and colleagues, Kurt Adelberger, Mark Dickinson, Mauro Giavalisco, Mindy Kellogg, and Max Pettini, for allowing me to present the results of our joint work. I would like also to acknowledge financial support from the National Science Foundation through the Young Investigator Program, as well as the Alfred P.Sloan Foundation. The Keck Observatory, without which much of the work described above would not have been possible, is operated jointly by the California Institute of Technology and the University of California, and was made possible by a generous gift from the W.M.Keck Foundation.
1. Lu, L., Sargent, W., Barlow, T., Churchill, C. & Vogt, S. (1996) Astrophys. J. Suppl. 107, 475–519.
2. Prochaska, J. & Wolfe, A. (1997) Astrophys. J. 487, 73–90.
3. Steidel C. & Hamilton, D. (1992) Astron. J. 104, 941–949.
4. Steidel, C. & Hamilton, D. (1993) Astron. J. 105, 2017–2030.
5. Steidel, C., Pettini, M. & Hamilton. D. (1995) Astron. J. 110, 2519–2536.
6. Madau, P. (1995) Astrophys. J. 441, 18–27.
7. Steidel. C., Giavalisco. M., Pettini, M., Dickinson, M. & Adelberger, K. (1996) Astrophys. J. 462, L17–L21.
8. Leitherer, C., Ferguson, H., Heckman, T. & Lowenthal, J. (1995) Astrophys. J. 454, L9–L12.
9. Guhathakurta, P., Tyson, A. & Majewski. S. (1990) Astrophys. J. 357, L9–L12.
10. Eggen, O., Lynden-bell, D. & Sandage, A. (1962) Astrophys. J. 136, 748–759.
11. Partridge, B. & Peebles. P. (1967) Astrophys. J. 147, 868–879.
12. Pritchet, C. (1994) Publ. Astron. Soc. Pac. 106, 1052–1057.
13. Djorgovski, S. (1996) in New Light on Galaxy Evolution, eds. Bender, R. & Davies. R. (Kluwer, Dordrecht, The Netherlands), pp. 277–286.
14. Charlot, S. & Fall, S. (1993) Astrophys. J. 415, 580–588.
15. Lilly, S., Tresse, L., Crampton, D. & Le Févre, O. (1995) Astrophys. J. 455, 108–124.
16. Cowie, L., Songaila, A., Hu, E. & Cohen, J. (1996) Astron. J. 112, 839–864.
17. Ellis, R., Colless, M., Broadhurst, T., Heyl, J. & Glazebrook, K. (1996) Mon. Not. R. Astron. Soc. 280, 235–251.
18. Steidel, C., Dickinson, M. & Persson, S. (1994) Astrophys. J. 437, L75–L78.
19. Driver, S., Windhorst, R. & Griffiths, R. (1995) Astrophys. J. 453, 48–64.
20. Glazebrook, K., Ellis, R., Santiago, B. & Griffiths, R. (1995) Mon. Not. R. Astron, Soc. 275, L19–L22.
21. Vogt, N., Forbes, D., Phillips, A., Gronwall, C., Faber, S., Koo, D. & Illingworth, G. (1996) Astrophys. J. 465, L15–L18.
22. McCarthy, P. (1993) Annu. Rev. Astron. Astrophys. 31, 639–688.
23. Schmidt, M., Schneider, D. & Gunn, J. (1995) Astron. J. 110, 68–77.
24. Kennefick, J., Djorgovski, S. & de Carvalho, R. (1995) Astron. J. 110, 2553–2565.
25. Cowie, L., Hu, E., Songaila, A. & Egami, I. (1996) Astrophys. J. 481, 9–15.
26. Steidel, C.Giavalisco, M., Dickinson, M. & Adelberger, K. (1996) Astron. J. 112, 352–360.
27. Lowenthal. J., Koo, D., Guzman, R., Gallego. J., Phillips. A., Faber, S., Vogt, N., Illingworth, G. & Gronwall, C. (1997) Astrophys. J. 481, 673–686.
28. Leitherer, C. & Heckman, T. (1995) Astrophys. J. Suppl. 96, 9–38.
29. Gallego. J., Zamorano, J. & Aragon-Salamanca, A. (1995) Astrophys. J. 455, L1–L4.
30. Bruzual G. & Charlot, S. (1997) Astrophys. J., in press.
31. Giavalisco, M., Steidel, C. & Machetto, F. (1996) Astrophys. J. 470, 189–199.
32. Meurer, G., Heckman, T., Lehnert, M., Leitherer, C. & Lowenthal, J. (1997) Astron. J. 114, 54–64.
33. Shectman, S., Landy. S., Oemler. A., Tucker, D., Lin, H. & Schechter, P. (1996) Astrophys. J. 470, 172–188.
34. Fall, M., Charlot, S. & Pei, Y. (1996) Astrophys. J. 464, L43–L46.
35. Cohen, J., Hogg, D., Pahre, M. & Blandford, R. (1996) Astrophys. J. 462, L9–L12.
36. Williams. R., Blacker, B., Dickinson, M., Dixon, W., Ferguson, H., Fruchter, A., Giavalisco, M., Gilliland, R., Heyer, R., Katsanis, R., Levay, Z., Lucas, R., McElroy, D., Petro, L. & Postman, M. (1996) Astron. J. 112, 1335–1374.
37. Madau, P., Ferguson, H., Dickinson, M., Giavalisco, M., Steidel, C. & Fruchter, A. (1996) Mon. Not. R. Astron. Soc. 283, 1388– 1404.
38. Lanzetta, K., Yahil, A. & Fernandez-Soto, A. (1996) Nature (London) 381, 759–763.
39. Lilly, S., Le Févre, O., Hammer, F. & Crampton, D. (1996) Astrophys. J. 460, L1–L4.
40. Madau, P. (1997) Am. Inst. Phys., in press.
41. Steidel, C., Sargent, W. & Boksenberg, A. (1988) Astrophys. J. 33, L5–L8.
42. Steidel, C. (1992) Publ. Astron. Soc. Pac. 104, 843–850.
43. Pettini, M., Hunstead, R., Smith, L. & King, D. (1997) Astrophys. J. 486, 665–680.
44. Storrie-Lombardi, L., Irwin. M. & McMahon, R. (1996) Mon. Not. R. Astron. Soc. 283, L79–L83.


