
Proc. Natl. Acad. Sci. USA
Vol. 95, pp. 72–77, January 1998
Colloquium Paper
This paper was presented at a colloquium entitled “The Age of the Universe, Dark Matter, and Structure Formation,” organized by David N.Schramm, held March 21–23, 1997, sponsored by the National Academy of Sciences at the Beckman Center in Irvine, CA
X-ray emission from clusters and groups of galaxies
RICHARD MUSHOTZKY
Laboratory for High Energy Astrophysics, Goddard Space Flight Center, Greenbelt, MD 20771
ABSTRACT Recent major advances in x-ray imaging and spectroscopy of clusters have allowed the determination of their mass and mass profile out to ≈1/2 the virial radius. In rich clusters, most of the baryonic mass is in the gas phase, and the ratio of mass in gas/stars varies by a factor of 2–4. The baryonic fractions vary by a factor of ≈3 from cluster to cluster and almost always exceed 0.09 h50−[3/2]and thus are in fundamental conflict with the assumption of Ω=1 and the results of big bang nucleosynthesis. The derived Fe abundances are 0.2–0.45 solar, and the abundances of O and Si for low redshift systems are 0.6–1.0 solar. This distribution is consistent with an origin in pure type II supernova. The amount of light and energy produced by these supernovae is very large, indicating their importance in influencing the formation of clusters and galaxies. The lack of evolution of Fe to a redshift of z≈0.4 argues for very early enrichment of the cluster gas. Groups show a wide range of abundances, 0.1–0.5 solar. The results of an x-ray survey indicate that the contribution of groups to the mass density of the universe is likely to be larger than 0.1 h50−2. Many of the very poor groups have large x-ray halos and are filled with small galaxies whose velocity dispersion is a good match to the x-ray temperatures.
Observational Status
X-ray observations of groups and clusters of galaxies have matured rapidly in the last 6 years with the advent of good quality imaging with Rosat and moderate quality spectra with ASCA, the Japanese-U.S. x-ray spectroscopy mission launched in February, 1993. We now have 100s of high quality x-ray images and ≈150 high signal to noise x-ray spectra.
With the present level of data, one can reliably determine the abundances of O, Ne, Si, S, and Fe in ≈20–30 clusters and a few groups, the temperature structure in ≈20–30 clusters and a few groups, and the average temperature and Fe abundances for ≫100 clusters and 10s of groups.
“Large” samples (≈20–30) of z>0.2 clusters are now available with images, temperatures, and Fe abundances. Groups at z≈0.2 are being found in deep Rosat fields. Large solid angle surveys, based on Rosat serendipitous surveys, are finding numerous cluster candidates in a reliable uniform fashion (1) out to redshifts >0.6.
The luminosity function of rich clusters has been determined at z<0.3 (2), and limits on it at z<0.8 exist (3). The first estimate of the luminosity function of groups at z=0 also has been made (4. 5). Progress in the next few years will be rapid as the large ASCA and Rosat archives are analyzed and AXAF (Advanced X-Ray Astromical Facility), XMM (X-Ray Multi-Mirror Mission), and Astro-E, which have considerably larger collecting area, better angular resolution, and improved energy resolution, are launched.
Clusters as Cosmological Probes
Clusters are thought to be “fair samples” of the universe, i.e., they represent such a large perturbation (≈10 Mpc comoving volume) that their content should be representative of the universe as a whole. Under this assumption, studies of their mass and their baryon fraction should reveal the “gross” properties of the universe as a whole, such as its baryonic fraction and total mass density. Because their dynamical time scales are not much shorter than the age of the universe, clusters should retain an imprint of how they were formed, and thus studies of their evolution, temperature, and luminosity function should place strong constraints on all theories of large scale structure. Unlike galaxies, which are certainly open systems, rich clusters probably retain all of the enriched material that was created in their precollapse, comoving volume. Thus, studies of their chemical abundances and its evolution should provide fundamental data for the study of the formation of the elements and provide a history of nucleosynthesis in the universe.
MASS DISTRIBUTION AND DARK MATTER
It has long been known (6) that x-ray imaging spectroscopy of relaxed systems can allow a determination of their total mass. To use the data in a straightforward fashion, we make the fundamental assumptions that hydrostatic equilibrium holds and that the only significant source of pressure in the gas is thermal pressure. Although this is clearly simplistic, it seems to hold well at roughly the 10–20% level in detailed numerical hydrodynamic simulations. To minimize the possible nonequilibrium effects, one must consider the dynamic state of the cluster. A fairly large fraction of clusters, 30–70%, appears to be involved in a merger at the present epoch. The indications of this are a highly structured x-ray image, and/or nonazimuthal temperature variations, and/or a highly non-Gaussian galaxy velocity field. After rejecting these objects from our sample, we have excluded, at least in projection, those objects for which our simple assumptions may not hold.
Then, for a spherical system, the enclosed mass is:
M(<r)=kT(r)R/GμmH {(d log ρ/d log r)+(d log T/d log r)}
The detailed analysis of cluster mass using the equation of hydrostatic equilibrium has been done for ≈10 objects out to ≈1/2 of the “virial” radius by several groups with rather similar results. Theoretical analysis of this method (7) indicates that the mass derived is unbiased and that the intrinsic spread of the x-ray derived mass to the true mass is <30% (cf. refs. 8 and 9).
© 1998 by The National Academy of Sciences 0027–8424/98/9572–6$2.00/0
PNAS is available online at http://www.pnas.org.
General Results
The derived masses are independent of the assumed form of the potential. That is, the measured temperature profile has such small statistical errors that all potentials that give the observed temperature profile have the same enclosed mass (10). Of course, these models can disagree in the regime in which there are no data. For ASCA, with its angular resolution of ≈2′ and 18′ effective field of view, there are very few systems in which the mass within 100 h50 kpc or beyond 1.5 h50 Mpc are well constrained. The fraction of the mass that is baryonic, fb (that is, the sum of the gas mass and the galaxy mass with an assumed M/Lv≈5), ranges from 0.09 to 0.25 and may be a weak function of the total mass (11), in the sense that most of the low baryonic fraction clusters have relatively low (<4×10¹⁴ M0) total masses. In an encouraging agreement of theory with observation, the derived x-ray masses are in excellent agreement with the scaling relation of Evrard, Metzler, and Navarro (7), with a mean ratio of data/theory of 0.87±0.14.
Clearly, this high baryonic fraction disagrees with big bang nucleosynthesis and Ω=1 and with many simulations of cluster formation and evolution. Analysis of the x-ray-derived ratio of baryonic mass to dark matter inside a cluster allows an increase in fb with radius, but at radii <1 Mpc, this is not required. Recent studies of clusters at larger scales (12) show that most clusters have a decreasing temperature at radii >1/4 of the virial radius. Although this is not fully understood, it arises naturally in low Ω simulations and in simulations with large initial injections of thermal energy (see figure 5 in ref. 7).
As first shown by David, Jones, and Forman in 1994 (11), the “average” M/L derived from x-ray imaging mass estimates is M/L≈150 h50 with a fairly wide range. There is a wide range in the ratio of gas mass to stellar mass, as can be seen clearly in Forman and Jones (13). It is not clear how much of the apparent factor of ≈6 range in gas to stellar mass is due to a lack of published accurate optical photometry for low redshift clusters. Whether this ratio is a monotonic function of mass or has an intrinsic wide scatter is not yet clear, but it seems as if more massive clusters tend to have a higher ratio of gas to stellar mass (11). However, there are some objects, such as Abell 1060 and Abell 1204, that have the same optical richness and x-ray temperature but a factor 30 difference in x-ray luminosity. This may indicate that much of the observed range in gas to stellar mass is due to “cosmic” scatter rather than to a trend.
Comparison of Results with Other Methods
Optical Velocity Dispersion. The x-ray temperature agrees extremely well (on average) with the optical velocity dispersion (β=μmρσ2/kT≈1) (14); however, there is a real variance in the distribution (Fig. 1 a and b). This excellent correlation indicates that, to first order, both the gas and the galaxies are in the same potential, that there are not large radial gradients or anisotropies in the galaxies velocity tensor, and that the virial theorem is not a strongly biased estimator of the mass (15). However, detailed comparison of viral mass estimates (16) and x-ray mass estimates shows a range of ≈2 as expected from the use of the viral theorem (15). In a few clusters with published optical velocity dispersion profiles, it is possible to perform a comparison of the predicted velocity dispersion profile with the x-ray-determined mass profile, under the assumption of isotropic orbits and that agreement between the predicted and observed velocity fields is good.
The <M/L> from the x-ray technique agrees on average with that from virial analysis (12, 16). This is essentially a restatement of the agreement of x-ray temperature and optical velocity dispersion, combined with the roughly isothermal nature of the temperature and velocity dispersion profiles. However, there are clearly outliers (e.g., Abell 1689) in which the virial theorem mass is much larger than the x-ray value. This is presumably due to the effects of mergers that can result in “nonvirial” galaxy velocities and deviations from hydrostatic equilibrium in the gas.
Comparison with Gravitational Lensing Results. There is good agreement (better than 30%) in the derived mass from x-ray and strong and weak lensing measurements for ≈1/2 of the sample [e.g., PKS 0745 (17) and A2390, H.Bohringer, Y. Tanaka, R.M., Y.Ikebe, and M.Hahori, unpublished work], but for ≈1/2 of the sample, the lens mass is significantly greater than the x-ray mass. The sign of the disagreement is consistent with simulations (8, 9) that show that the lensing mass is biased high compared with the true mass because of the spatial correlation of mass and that the x-ray estimate is biased slightly low because of incomplete thermalization of shocks and the
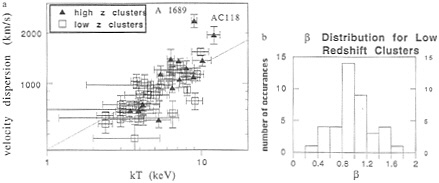
FIG. 1. (a) Optical velocity dispersion compared with emission weighted average x-ray temperature for a large sample of low and high (z> 0.14) redshift clusters. The solid line is not a fit to the data but the expectation if the x-ray temperature and the cluster galaxy velocity dispersion were equal. Note the scatter and the appearance of a few objects with much higher velocity dispersion than expected from the x-ray temperature. These two clusters are also objects with strong gravitational arcs, (b) The distribution of β=μmρσ2/kT for a large sample of well measured clusters. The mean value=1, and the variance is real. This indicates that, although on average the cluster gas and galaxies have the same “temperature,” there is a real variation presumably due to cluster mergers, nonvirialization temperature, and velocity dispersion gradients and foreground/ background projection effects.
neglect of turbulence. Specifically, because the lens mass is a measure of the total surface mass density in the line of sight, it necessarily includes the mass of the smaller clusters and groups which lie in the foreground and background of the cluster whereas the x-ray mass estimate is strongly biased to just the cluster itself. As one goes to smaller mass scales than that of rich clusters, the gravitational lens mass is more biased.
Sunyaev-Zeldovich Effect. As shown in detail by Carlstrom* and by Myers et al. (19), the Sunyaev-Zeldovich effect measurements derive the same gas surface density (if H0<70 km/s/Mpc) as do the x-ray measurements. Because the Sunyaev-Zeldovich data measure, primarily, the path integral of the pressure whereas the x-rays measure the projected emission integral and temperature, this consistency indicates that the gas neither is highly clumped nor has an “odd” geometry and that the x-ray gas mass estimates are robust. Although these data do not confirm the x-ray total mass estimates, they strongly support the assumptions involved in the analysis.
Possible Problems: Other Sources of Pressure. Although cosmic rays, magnetic fields, and turbulence potentially could make a major additional contribution to the total pressure, they have not been directly measured. The effects of magnetic fields have been considered in detail by Steigman and Felten (20) and are thought to be rather small. However, it is well known (21) that, in the centers of “cooling flow” clusters, magnetic fields are important contributors to the total pressure. Turbulence has not been measured in the outer regions of rich clusters, but in the central regions, measurements of the velocity field of the optical filaments in cooling flow clusters indicate that turbulence contributes <30% of the total pressure. Theoretical high resolution models of cluster collisions show that, after several gigayears, the contribution of turbulence to the total pressure should be small (22). Future high resolution x-ray spectroscopy with Astro-E will be able to directly measure the velocity field of the gas and thus determine whether turbulence is a major contributor to the total pressure.
Conclusions
Our data are in agreement with the Carlberg et al. (16) scenario in which a low O cosmology can describe the overall cluster data. That is, the cluster-determined baryonic fraction is not consistent with a closed universe and the big bang nucleosynthesis-determined baryonic fraction, nor is the cluster M/L consistent with closure density. However, the variation in baryonic fraction in moderate mass clusters argues that additional physics other than pure gravity should be included in our modeling of cluster formation and evolution. One strong candidate for this additional physics is heating caused by cluster winds at an early epoch (23). It is also possible that the variation in baryonic fraction could be due to cluster mergers at high mach number (24); however, the occurrence rate for this is a strong function of the cosmological model.
ABUNDANCES AND IMPLICATIONS FOR ORIGIN OF STRUCTURE
The ASCA spectra for most rich clusters are consistent with a nonsolar abundance ratio for O, Ne, and Si to Fe (25–27). The median ratio of Si/Fe is 2.2+/-0.25 solar, and the mean Fe abundance is 0.28 solar. These data are consistent with a “pure” type II supernova origin for all of the heavy elements (23). However, this conclusion is sensitive to stellar models, and it is possible that ˜1/2 of the Fe was made in type I supernovae (28, 29). What is robust is that most of metals are created in type II supernovae even if 50% of the Fe is due to type Is.
The mass in metals is correlated with the light in elliptical galaxies (30). However, there is a factor of 4 range in the ratio of light to metal mass, as is seen most clearly in the detailed studies of Abell 1060 and AWM 7 (10). There is also true variation in the metallicity from cluster to cluster of about a factor of 2 (31). Although some clusters have abundance gradients or structure (26), they occur in <1/3 of rich low redshift clusters and are often confined to the central regions. Fig. 3 shows the extremely strong correlation of x-ray luminosity and temperature (32). The highest metallicity is correlated with the “excess” luminosity in the L(x) vs. kT correlation (33). In standard theory, the temperature determines the mass of the system; this means that the clusters that are the most x-ray luminous for a given total mass have the highest abundances.
With ASCA, one can reasonably sample the evolution of the cluster Fe abundance out to z˜0.5 (ref. 32; Fig. 2). There has been no discernible change in either the mean cluster metallicity or its variance out to z˜0.4. Recently there has been a detection (34) of a cluster at z=0.94 with “normal” Fe metallicity, perhaps extending this result to higher redshift. The lack of evolution of cluster metallicity out to z˜0.4 combined with the apparent passive evolution of elliptical galaxies in clusters indicates that the cluster metals are created at z>1.2 (however, the exact epoch depends on the cosmological model).
The x-ray spectroscopic data essentially count the total grams of silicon in the cluster so that one can easily calculate the total energy in metal creation due to type II supernovae (23). The number derived is very large and is typically ˜1/4 of the binding energy of the present day clusters (at T˜4 keV mass scale). In any hierarchical universe, the effective potential of a cluster was smaller at larger redshifts, so if even a small fraction of this energy is thermalized, it will have a profound effect on the formation of large scale structure and galaxies. The additional heat will delay the infall of gas and change the final configuration of the system by creating a higher entropy core. In fact, recent work on semi-analytic models of galaxy formation (35, 36) have found that they must have a high feedback efficiency of supernova energy into the gas phase to account for the observed metallicity and luminosity of early type galaxies.
The implied luminosity of the early generation of galaxies was also very large (1048/t8 ergs/s/galaxy where t8 is the lifetime of the starburst in units of 108 years). This is a rather robust calculation because it depends only on the total number of massive stars, which is fixed by the total cluster metallicity (23). Because these high luminosity z>1 objects are not seen, in general, in the optical or UV band (37), they must either be “hidden” by dust, and/or be at very high z, and/or exist as galaxy fragments, each one of which must have <1/100 of the mass of a giant elliptical during the phase in which massive stars are forming. Based on low redshift galaxy samples, in which >50% of the luminosity of rapidly starforming galaxies appears in the infra-red, it seems as if the effects of dust could be important, whereas the Hubble Deep field data, indicating that high redshift galaxies are rather small, suggest that the galaxy fragment scenario is also important.
The x-ray spectroscopic data indicate that most of the visible metals in clusters (˜50–80%) are in the hot gas. Because there seems to be little, if any, difference between the fundamental plane of field and cluster galaxies out to z˜0.4 (38), the relative amount of metals retained in stars vs. those “expelled” into the gas derived from the cluster data should also apply to “field” galaxies. This indicates that the mean metallicity of the universe has been underestimated by 2–4 based on galaxy data alone [a point first noted by Songaila, Cowie, and Lilly (40)] and implies much more star formation than estimated by
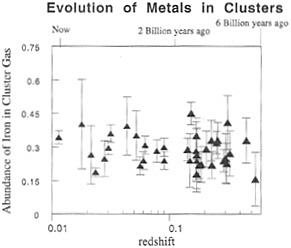
FIG. 2. Average iron abundance vs. redshift for the entire sample of published objects in the literature. There is no evidence for variation in the Fe abundance with redshift, but there is real variation from object to object. The errors bars are 90% confidence. The low redshift data were obtained by the Ginga satellites nonimaging proportional counters, and the high redshift data were obtained by ASCA (32).
Madau et al. (39) from optical/UV galaxy data. It is amusing to note that the latest calculation of galaxy formation in a hierarchical scenario (35) uses the x-ray cluster metallicity as a fiducial value for the total production of metals and that this produces, in a “natural way,” the observed properties of elliptical galaxies with redshift. Given the above scenario, the intergalactic medium should be metal enriched at z<3 because the enriched gas expelled from galaxies in a noncluster environment will not be bound to the system and will enter the intergalactic medium.
CLUSTER EVOLUTION
As pointed out by Bahcall†, measurement of cluster evolution is a strong test of cosmological models. Recent data from the Rosat all-sky survey (2) shows that, contrary to previous reports, there is little or no evolution in the x-ray cluster luminosity function at z<0.3. Recent samples based on deeper Rosat pointed data (1, 3) have found little indication of strong cluster luminosity function evolution at z<0.6. Recent analysis of ASCA spectra of high redshift clusters (ref. 42; Figs. 1 and 2) shows no evidence for evolution in the relationship between x-ray temperature and luminosity or between x-ray temperature and velocity dispersion. The almost total lack of evidence for x-ray cluster evolution argues either for a low O universe and/or a physical situation in which much of the gas in the cluster core is preheated at moderate to high redshifts (43, 44).
The overabundance of metals in “over”-luminous clusters (which are also high cooling flow rate objects) can be accounted for in a scenario (33) in which “over”-luminous clusters (the objects to the far right in Fig. 3) represent high density perturbations, which collapse early. The high density manifests itself in a high x-ray luminosity and high cooling rate. The lower density perturbations form later and lose metals via winds and thus form clusters that have lower metallicity and low cooling rates. Thus, in some sense, cluster metallicity might be a signature of relative age.
GROUPS
It is a major surprise that many poor groups with only 2–4 optically bright members are fairly luminous, L(x)˜1042-1043 ergs/s, extended x-ray sources. (45). The temperature structure and metallicity of ˜10 groups have been determined from ASCA and Rosat data, and, to first order, the x-ray bright groups are isothermal out to ˜15', which corresponds to 0.1–0.3 of the virial radius. The temperature of these systems clusters around 107 °K with a rather small dispersion. The abundances vary widely from <0.1 to >0.5 solar, and some groups show steep abundance gradients. The existence of groups with low total metallicity combined with a low ratio of total metals to optical light argues for the expulsion of metals from the group potential via a wind or some other mechanism. There is a strong tendency for the less luminous systems to have low metallicity. The x-ray luminous groups tend to be dominated by luminous (Mv>-21.5) elliptical galaxies (18), and very few, if any, spiral dominated groups have luminous x-ray halos.
In a sample of 12 groups, all of the x-ray luminous (L(x)> 4×1041 ergs/s) systems possess numerous small (Mv˜-17) galaxies whereas the x-ray dim systems do not have such a population (41). The small galaxies have a very extended distribution, and often they can be traced out beyond 200 h-1 kpc.
For these 12 well measured groups, the relationship between x-ray temperature and optical velocity dispersion is similar to that of clusters, and thus it is likely that these are relaxed systems.
The x-ray emission from the luminous objects is truly diffuse and is not dominated by emission from individual galaxies; however, in some lower luminosity systems, emission from individual galaxies is important (18).
The temperature, optical velocity dispersion, and x-ray image data from this limited sample, combined with the much
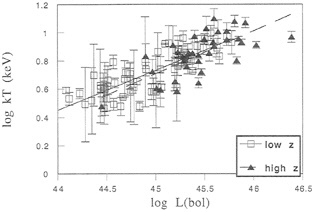
FIG. 3. Correlation of the x-ray bolometric luminosity and x-ray temperature. The very strong correlation, of the form kT˜L0.3, does not evolve with redshift but has an intrinsic dispersion of ˜3 in luminosity at a fixed temperature.
larger number of studied objects (18, 45), indicate that many of the groups are relaxed and that the dark matter distribution for many of the groups is extended over R>200 kpc. This is confirmed by the dwarf galaxy distribution in the Zadludoff and Mulchaey sample (41).
X-ray luminous groups are very common (˜10-2 h5/Mpc3 at L(x)˜1042) in a high surface brightness limited survey (4). Using the scaling relations from numerical work (7) and the independent confirmation of this law from the x-ray data itself, the typical mass inside ˜200 kpc is ˜2×10¹³ M0h50-2. Using the Burns et al. luminosity function (4), a conversion from luminosity to temperature using the L(x) vs. kT relation gives a trivial estimate of the minimum mass in these systems relative to the closure density of Ogroups˜0.06 Ah2 where A is the correction for mass inside 200 kpc to the total mass (A˜5). The preliminary all sky survey results, upon which the Burns et al. paper is based, certainly miss many massive systems (45), and thus these limits on the mass density of the universe contributed by x-ray emitting groups are conservative.
The mean baryonic fraction in groups is not yet accurately known, but for many of them it is ˜10%, with a wide range of M(gas)/M(star). Thus the x-ray luminous groups may contain most of the visible mass in the universe.
CONCLUSION
The lack of evolution in cluster properties (abundance, luminosity function, L vs. T) combined with the type II SN origin of the metals argues for the very strong influence of nongravitational processes in structure formation and/or a low value of O. The high baryon fraction in clusters alone is the strongest argument for a low O. The “low” M/L for clusters (˜150) and the observed number density of clusters also indicate a low O. However, the evidence for the importance of heat in the early universe indicates that most simulations have not included important physics for cluster and galaxy formation.
The quality of the x-ray data will improve markedly in the next few years with the next generation of instruments on AXAF, XMM, and ASTRO-E. I anticipate that the next National Academy of Sciences meeting on this subject will be equally exciting.
I thank my collaborators at Goddard Space Flight Center and on the ASCA team, especially Michael Loewenstein, Caleb Scharf, Keith Arnaud, John Mulchaey, Dave Davis, Yasuo Tanaka, and Una Hwang, whose hard work have contributed to the results presented in this paper.
1. Scharf, C., Jones, L., Ebeling, H., Perlman, E., Malkan, M. & Wegner, G. (1997) Ap. J. 477, 79–92.
2. Ebeling, H., Edge, A., Fabian, A., Allen, S., Crawford, C. & Boehringer, H. (1997) Ap. J. Lett. 479, 101–104.
3. Collins, C., Burke, D., Romer, A.K., Sharples, R. & Nichol, R. (1997) Ap. J. Lett. 479, L117.
4. Burns, J., Ledlow, M., Loken, C., Klypin, A., Voges, W., Bryan. G., Norman, N. & White, R. (1997) Ap. J. Lett. 467, 49–52.
5. Henry, J.P., Gioia, I., Huchra, J., Burg, R., McLean, B., Bohringer, H., Bower, R., Briel, U., Voges, W., MacGillivray, H. & Cruddace, R. (1995) Ap. J. 449, 422–430.
6. Fabricant, D., Lecar, M. & Gorenstein, P. (1980) Ap. J. 241, 552–560.
7. Evrard, G., Metzler, C. & Navarro, J. (1996) Ap. J. 469, 494–507.
8. Bartelmann, M. & Steinmetz, M. (1996) MNRAS 283, 431–446.
9. Cen, R. (1997) Ap. J. 485, 39.
10. Loewenstein, M. & Mushotzky, R. (1996) Ap. J. Lett. 471, 83–86.
11. David, L., Jones, C. & Forman, W. (1995) Ap. J. 473, 692–706.
12. Markevitch, M. (1996) Ap. J. Lett. 465, 1–4.
13. Forman, W. & Jones, C. (1994) in Cosmological Aspect of X-ray Clusters of Galaxies, ed. Seitter, W.C., p. 38.
14. Bahcall, N. & Lubin, L. (1994) Ap. J. 426, 513–515.
15. Heiseler, J., Tremaine, S. & Bahcall, J. (1985) Ap. J. 298, 8–17.
16. Carlberg, R., Yee, H., Ellingson, E., Abraham, R., Gravel, P. Morris, S. & Pritchet, C. (1996) Ap. J. 462, 32–49.
17. Allen, S., Fabian, A. & Kneib, J (1996) MNRAS 279, 615–635.
18. Ponman, T., Bourner, P., Ebeling, H. & Bohringer, H. (1996) MNRAS 283, 690–708.
19. Myers, S., Baker, J., Readhead, A., Leithch, E. & Herbig, T. (1997) Ap. J. 485, 1.
20. Steigman, G. & Felten, J. (1995) Space Sci. Rev. 74, 245–258.
21. Ge, J. & Owen, F. (1994) Ap. J. 108, 1523–1533.
22. Roettiger, K., Stone, J. & Mushotzky, R. (1997) Ap. J., in press.
23. Loewenstein, M. & Mushotzky, R. (1996) Ap. J. 466, 695–703.
24. Cen. R. & Ostriker, J. (1994) Ap. J. 429, 4–21.
25. Mushotzky, R., Loewenstein, M., Arnaud, K., Tamura, T., Fukazawa, Y., Matsushita, K., Kikuchi, K. & Hatsukade, I. (1996) Ap. J. 466, 686–694.
26. Fukazawa, Y., Tamura, T., Ezawa, H., Makishima, K., Kikuchi, K., Ohashi, T., Ikebe, Y. & Tsuru, T. (1997) in X-Ray Imaging and Spectroscopy of Cosmic Hot Plasmas, eds. Makino, F., Mitsuda, K. (Universal Academy Press, Tokyo), pp. 101–102.
27. Hatsukade, I., Kawabata, K., Takenaka, K. & Ishisaka, J. (1997) in X-Ray Imaging and Spectroscopy of Cosmic Hot Plasmas, eds. Makino, F., Mitsuda, K. (Universal Academy Press, Tokyo), pp. 105–106.
28. Gibson, B., Loewenstein, M. & Mushotzky, R. (1997) MNRAS, in press.
29. Ishimaru, Y. & Arimoto, N (1997) Pub. Astrom. Soc. Japan 49, 1–8.
30. Arnaud, M., Rothenflug, R., Boulade, O., Vigroux, L. & Bangioni-Flan, E. Astrom. Astrophys, 254, 49–64.
31. Fabian, A., Crawford, C., Edge, A. & Mushotzky, R. (1994) MNRAS 267, 779–784.
32. Mushotzky, R. & Loewenstein, M. (1997) Ap. J. Lett. 481, L63.
33. Scharf, C. & Mushotzky, R. (1997) Ap. J. 485, L65.
34. Hattori, M., Ikebe, Y., Asaoi, A.I., Takeshima, T., Bohringer, H., Mihara, T., Neumann, D., Schindler, S., Tsuru, T. & Tamura, T. (1997) Nature (London), submitted for publication.
35. Kauffmann, G. & Chariot, S. (1997) MNRAS 388, 146.
36. Baugh, C.M., Cole, S. & Frenk, C. (1996) MNRAS, 283, 1361–1378.
37. Steidel, C. (1998) Proc. Natl. Acad. Sci. USA 95, 22–28.
38. Schade, D., Carlberg, R., Yee, H., Lopez-Cruz, O. & Ellingson. E. (1996) Ap. J. Lett. 464, 63–66.
39. Madau, P., Ferguson, H., Dickinson, M., Giavalisco, M., Steidel, C. & Fruchter, A. (1997) MNRAS 283, 1388–1404.
40. Songaila, A., Cowie, L. & Lilly, S. (1990) Ap. J. 348, 371–377.
41. Zabludoff, A. & Mulchaey, J. (1997) Ap. J., in press.
42. Mushotzky, R. & Scharf, C. (1997) Ap. J. Lett., in press.
43. Kaiser, N. (1991) Ap. J. 383, 104–111.
44. Bower, R. (1997) MNRAS 288, 355.
45. Mulchaey, J., Davis, D., Mushotzky, R. & Burstein, D. (1996) Ap. J. 456, 80–97.


