
Proc. Natl. Acad. Sci. USA
Vol. 94, pp. 8329–8334, August 1997
Colloquium Paper
This paper was presented at a colloquium entitled “Carbon Dioxide and Climate Change,” organized by Charles D. Keeling, held November 13–15, 1995, at the National Academy of Sciences, Ivine, CA.
Spectrum of l00-kyr glacial cycle: Orbital inclination, not eccentricity
RICHARD A. MULLER * AND GORDON J. MAC DONALD †
*Department of Physics and Lawrence Berkeley Laboratory, University of California, Berkeley CA 94720; and †Iternational Institute for Applied Systems Analysis, A-2361 Laxenburg, Austria
ABSTRACT Spectral analysis of climate data shows a strong narrow peak with period ˜100 kyr, attributed by the Milankovitch theory to changes in the eccentricity of the earth’s orbit. The narrowness of the peak does suggest an astronomical origin; however the shape of the peak is incompatible with both linear and nonlinear models that attribute the cycle to eccentricity or (equivalently) to the envelope of the precession. In contrast, the orbital inclination parameter gives a good match to both the spectrum and bispectrum of the climate data. Extraterrestrial accretion from meteoroids or interplanetary dust is proposed as a mechanism that could link inclination to climate, and experimental tests are described that could prove or disprove this hypothesis.
Using much improved dating techniques, Broecker and van Donk ( 1 ) in 1970 conclusively established that the dominant cycle in proxy climate records is 100 kyr. Broecker and van Donk did not commit themselves as to the origin of the 100-kyr cycle. In the years after 1970, it became customary to attribute the 100,000-year cycle to variations in the orbital eccentricity of the earth ( 2 ). Calculated variation of eccentricity shows a quasi-periodic behavior, with a period of about 100 kyr. Milankovitch ( 3 , 4 ) proposed that eccentricity affected the climate through its effect on insolation: the average solar energy reaching the earth. In this paper we note five sets of observations which conflict with the suggestion that insolation variations associated with eccentricity are responsible for the dominant 100,000-year cycle.
First, the eccentricity changes are small, between 0.01 and 0.05. The resulting changes in insolation are far too small to account for the dominant 100,000-year cycle observed in proxy climate records. Second, the orbital calculations which can be carried out with great accuracy back to several million years ( 5 ) show that the major cycle in eccentricity is 400,000 (400 kyr), rather than 100 kyr. A 400-kyr fluctuation is absent in most climate records, leading to specific disagreement between eccentricity and glacial data at both 400 ka and the present (the “stage 1” and “stage 11” problems). Many proposed explanations for the discrepancies have been advanced; in a recent review, Imbrie et al. ( 6 ) give a short list consisting of seven groups of models. Many of the models involve resonant or nonlinear behavior of the ice–ocean–atmosphere system; some derive the 100-kyr period from the envelope of the variation in the precession parameter.
Well-dated climate proxy records show the 100,000-year cycle only over the last million years ( 7 ). Prior to this transition, the 100-kyr period is either absent or very weak. Calculated variation of eccentricity does not show any discontinuity a million years ago. If the eccentricity drove changes in insolation, it would be anticipated that variations in insolation due to changes in eccentricity would affect climate in earlier periods, as well as over the past million years.
Since methods of dating have improved, a fourth possible problem with the Milankovitch insolation has developed: several recent observations suggest that the abrupt termination of the ice ages preceded warming from insolation ( 8 ), an effect we refer to as “causality problem.” The interpretation of these results is still controversial ( 9 , 10 , 11 , 12 and 13 ). Furthermore, Imbrie et al. ( 9 ) argue that a true test of the Milankovitch theory must be performed in the frequency domain, not the time domain.
The fifth problem with the Milankovitch insolation theory is found in the frequency domain. In this paper, we present a full resolution spectral analysis of d18O proxy climate records. The analysis shows that the 100-kyr period is a single, narrow peak, a simple pattern that strongly confirms an astronomical origin, but which cannot be reconciled with any of the models presented in the review by Imbrie et al. ( 6 ) In contrast, an alternative model that we have proposed, which attributes the 100-kyr cycle to orbital inclination, passes all the spectral tests that the Milankovitch model fails ( 14 ).
Climate Proxy Records
The isotopic composition of the oxygen isotopes in sediment is believed to reflect the percentage of earth’s water frozen in ice, and thus changes in the oxygen–isotope ratio d18O are measures of the earth’s climate. While we have examined a large number of records to test our conclusions, we use two primary records in this analysis: from ocean drilling project site 607 ( 15 ) and the Specmap ( 16 ) compilation. We chose these records because both had time scales that had not been tuned to match a presumed 100-kyr eccentricity cycle. Such tuning, had it been done, could have artificially narrowed the width of the 100 kyr spectral peak. The d18O signals for these data for the past 600 kyr are shown in Fig. 1 a and Fig.1 b . The similarity between the two records is evident; the dominant feature is the 100-kyr cycle. The spectra for these data are shown in Fig. 1 c and Fig. 1 d . For site 607, which has unevenly spaced data, the spectrum is calculated using the methods of Lomb ( 17 ) and MacDonald ( 18 ); however, we obtained essentially identical results using interpolation and data taper followed by standard Fourier transform or by the Blackman–Tukey method (provided full lags were used).
The Milankovitch model attributes the peak near 0.01 cycles per kyr (100-kyr period) to variations in the earth’s eccentricity. The 0.024 cycles per kyr peak (41-kyr period) to changes in the obliquity (tilt of the earth’s axis with respect to the ecliptic), and the 0.04 cycles per kyr peak (23-kyr period) to changes in the precession parameter (delay between perihelion and summer solstice). Note that the full width at half maximum (FWHM) of the 0.01 cycles per kyr peak (100-kyr period) is 0.0016 cycles per kyr, near the theoretic minimum width (0.0015 cycles per kyr) that can be obtained with a record of
|
|
© 1997 by The National Academy of Sciences 0027-8424/97/948329-6$2.00/0 PNAS is available online at http://www.pnas.org. |
600-kyr length. A re-analysis of the original pacemaker core stack with full resolution also produces a single narrow peak (FWHM = 0.0019), which is the theoretically minimum width for a record of 464 kyr length. Likewise, the spectral analysis of data from site 806 (19) shows a single narrow peak.
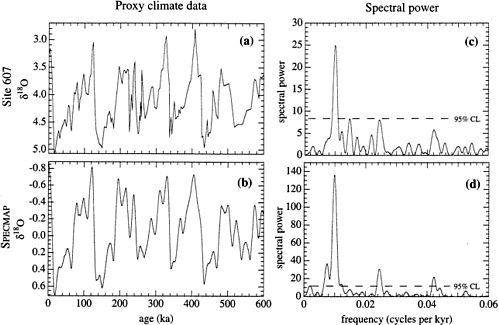
FIG. 1. d18O for past 800 kyr. (a) Data of site 607 from Ruddiman et al. (15 ). (b) Specmap stack of Imbrie et al. (16). (c) Spectral power of site 607. (d) Spectral power of Specmap. In the Milankovitch theory, the peak near 0.01 (100-kyr period) is attributed to eccentricity, the peak near 0.024 (41-kyr period) to obliquity, and the peak near 0.043 (23-kyr period) to precession.
The narrow width of the 100-kyr peak strongly suggests a driven oscillation of astronomical origin. In contrast to dynamical astronomy, where dissipative processes are almost nonexistent, all known resonances within the earth– atmosphere system have energy transfer mechanisms that cause loss of phase stability. Narrowness of the 41-kyr and 23-kyr cycles is not necessarily significant, since the time scale of the data was tuned by adjusting the sedimentation rate to match the expected orbital cycles. The 100-kyr peak is incoherent with these other two cycles, there is no phase relationship. The fact that an unrelated peak is sharp can be considered as an a posteriori evidence that the tuning procedure yielded a basically correct time scale, although it could be incorrect by an overall stretch factor and delay. We did not anticipate the narrowness of the 100-kyr peak, assuming, as others have done, that it was due to forcing by variations in eccentricity. However, it is not easily reconciled with any published theory. The narrowness of the peak was missed in previous spectral analysis of isotopic data because of the common use of the Blackman–Tukey algorithm ( 20 ), which, as usually applied (lag parameter = 1/3), artificially broadens narrow peaks by a factor of 3. The Blackman–Tukey algorithm gained wide use in the 1950s because of Tukey’s admonition that analysts could be misled by using classical periodograms in analyzing spectra having a continuous spectrum. For analysis of glacial cycles, these considerations did not arise, because the spectra are mixed spectra with very strong quasi-periodic peaks. Spectra of glacial cycles, as Tukey recognized, lend themselves to the use of conventional Fourier transforms.
The region of the 100-kyr peak for the d18O data is replotted in Fig. 2 a and Fig. 2 b with an expanded frequency scale. These plots can be compared with the spectral power of the eccentricity variations, shown in Fig. 2c , calculated from the detailed computations of Quinn et al. ( 5 ). Three strong peaks are present in the eccentricity spectrum: near 0.0025 cycles per kyr (400-kyr period), near 0.08 cycles per kyr (125-kyr period), and near 0.0105 cycles per kyr (95-kyr period). The disagreement between the spectrum of climate and that of eccentricity is evident. The absence of the 400-kyr peak in the climate data has long been recognized (for a review, see Imbrie et al. ( 6 ), and numerous models have been devised that attempt to suppress that peak.
We note that the 100-kyr peak is split into 95- and 125-kyr components, in serious conflict with the single narrow line seen in the climate data. The splitting of this peak into a doublet is well known theoretically ( 22 ), and results from the phase-coherent modulation by the 400-kyr peak. But in comparisons with data, the two peaks in eccentricity were made into a single broad peak by the enforced poor resolution of the Blackman–Tukey algorithm. The single narrow peak in the climate data was likewise broadened and the resulting comparisons led to the belief that the theoretical eccentricity and the observed climate data were very much alike.
The disagreement between the data ( Fig. 2 a and Fig. 2 b ) and the theory ( Fig. 2 c and Fig. 2 d ), cannot be accounted for by experimental error uncertainty. Tuning of the time scale to a specific peak (by adjusting the unknown sedimentation rates) can artificially narrow that peak as other peaks that are coherent with it [see, for example, Neeman ( 23 )]. However, the data in Fig. 2 a and Fig 2 b were tuned only to peaks obliquity and precession that are incoherent with the 100-kyr eccentricity cycle, so that tuning cannot account for the narrow width. Likewise, chatter (errors in the time scale from mis-estimated sedimentation
rates) cannot reconcile the disagreement, since although chatter can smear a doublet into a single broad peak, it will not turn a doublet into a single narrow peak. Could a physical mechanism convert a 95- to 125-kyr doublet into a single narrow peak? Dissipative mechanisms could obscure the doublet, but (like chatter) they yield a single broad peak or a cluster of doublets. Resonances used to suppress the 400-kyr peak are not sharp enough to suppress one element of the narrow doublet. In principle, a strong nonlinear process could turn a doublet into a single peak, as it does (for example) in a laser; however, no such mechanism has been identified in the lossy, friction-filled environment of the earth and its atmosphere.
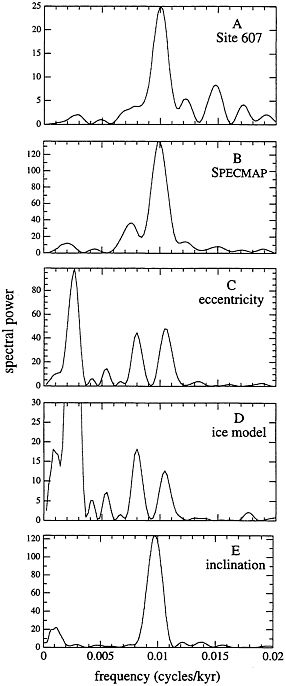
FIG. 2. Spectral fingerprints in the vicinity of the 100-kyr peak for data from site 607 (a); for data of the Specmap stack (b); for a model with linear response to eccentricity, calculated from the results of Quinn et al. (5) (c); for the nonlinear ice-sheet model of Imbrie and Imbrie (21) (d); and for a model with linear response to the inclination of the Earth’s orbit (measured with respect to the invariable plane) (e). All calculations are for the period 0–600 ka. The 100-kyr peak in the data in a and b do not fit the fingerprints from the theories c and d, but are a good match to the prediction from inclination in e.
Several nonlinear models reviewed by Imbrie et al. ( 6 ) derive the 100 kyr cycle from the envelope of the precession cycle. However, this envelope also has a split peak, since it derives ultimately from eccentricity (the envelope of the precession is the eccentricity). As an example, we show the spectrum of the ice sheet model of Imbrie and Imbrie ( 21 ) in Fig. 2d. As expected, it too shows the 95- to 125-kyr doublet, in disagreement with the data. None of the nonlinear models in the recent comprehensive review by Imbrie et al. ( 6 ) have the required laser-like mechanism, and they all predict a split peak. This is a fundamental disagreement, not fixed by adjusting parameters. Unlike the 400-kyr cycle, which is far enough mismatched from the 100 kyr to be suppressed (at least in principle) by the models, the lines in the 95–125 doublet are too close. We draw a remarkably strong conclusion that variations in the earth’s eccentricity cannot be responsible for the 100-kyr cycle.
Orbital Inclination: An Alternative 100-kyr Cycle
We recently proposed that a different orbital parameter, the inclination of the earth’s orbit to the invariable plane of the solar system, should be associated with the 100-kyr glacial cycle ( 14 , 24 ). The invariable plane of the solar system is that plane perpendicular to the angular momentum vector of the solar system, and is approximately equal to the orbital plane of Jupiter. The dominant peak in the spectrum of the inclination is at 0.01 cycles per kyr (100-kyr period) in a remarkably close match to the 100-kyr peak observed in the climate spectra. According to theory, this 100-kyr peak is also split, but only by 10-3 cycles per kyr, and this cannot be resolved with the 600-kyr record length. The variation of inclination i with time is calculated using the long-term integrations of Quinn et al. ( 5 ) and projecting the variation of inclination to the invariable plane.
The existence of the 100-kyr cycle of orbital inclination does not seem to have been previously noted by climatologists. It may have been missed for two reasons. Ever since the work of Milankovitch, the implicit assumption has been that insolation is the driving force for climate cycles, and the insolation is not directly affected by orbital inclination. In addition, the 100-kyr cycle is not evident until the orbital elements are transferred to the natural reference plane of the solar system, the invariable plane.
The fit of orbital inclination to the d18O data from Specmap is shown in Fig. 3. Only two parameters were adjusted in the fit: one to set the relative scale between inclination and d18O and a lag representing the delayed ice response to inclination. The best fit had a lag of 33 ± 3 kyr, with inclination accounting for 43% of the variation in the d18O signal (for a record extending back 900 kyr the fit is even better, with inclination accounting for 48% of the variation) ( 25). Note that the inclination cycle has no 400-kyr component: the 100-kyr cycle remains strong for the last 600 kyr. Thus attribution of the cycle to inclination provides a natural (no-parameter) solution to the stage 1 and stage 11 problems as well as to the causality problems.
Bispectra
Bispectral analysis can be used to give an independent test of the causal link between a theoretical driving mechanism and a response. A peak appears in the bispectrum only if three frequencies are present in the data, and the third is not only the sum or difference of the other two, but in phase lock with the sum or difference of their phases. The bispectrum can strongly suppress noise, and it can yield a completely independent test for proposed forcing mechanisms. In Fig. 4, we show the bispectrum of orbital inclination of d18O (from
Specmap) and eccentricity [Elsewhere ( 26, 27 ) we give a detailed discussion of the calculations and their interpretations.] The strongest peak in inclination ( Fig. 4a ) is at (f1 = 0.009, f2 = 0.001), indicating that for the orbital variations, the signals near 0.001, 0.01, and 0.009 are frequency and phase locked. This same peak appears as the most significant signal in the d18O bispectrum, confirming the hypothesis that the glacial cycles are driven by orbital inclination. In contrast, the bispectrum of eccentricity, Fig. 4c, shows little resemblance to the d18O bispectrum. This bispectrum also supports that climate cycles are related to orbital inclination.
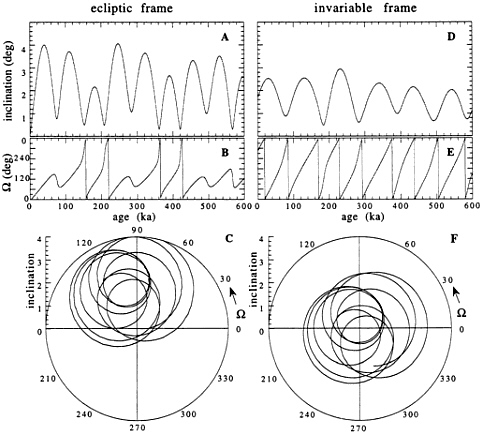
FIG. 3. Variations of the inclination vector of the Earth’s orbit. The inclination i is the angle between this vector and the vector of the reference frame; O is the azimuthal angle = the angle of the ascending node (in astronomical jargon). In A–C, the measurements are made with respect to the zodiacal (or ecliptic) frame–i.e., the frame of the current orbit of the Earth. In D–F, the motion has been transformed to the invariable frame—i.e., the frame of the total angular momentum of the solar system. Note that the primary period of oscillation in the zodiacal frame (A) is 70 kyr, but in the invariable plane (D) it is 100 kyr.
Linking Mechanisms
Since orbital inclination does not affect insolation, we must search for another mechanism relating changes in orbital inclination to changes in global climate. The only plausible one we have found is accretion of interplanetary material: meteoroids and dust. As the orbit of the earth changes, it passes through different parts of the sun’s zodiacal ring and encounters different regions of density of material. Changes in inclination will be reflected in changes of accretion. The meteoroids and dust will, through orbital processes, tend to concentrate in the invariable plane. As the earth passes through the invariable plane, accretion increases, and we speculate that glaciers grow, while recession of glaciers takes place during high inclinations when the earth’s orbit tips out of the invariable plane. We emphasize that this mechanism is speculative, and that there is no known meteoroid or dust band that satisfies all the properties that we require, although it is possible that such a band could exist. We will offer some indirect evidence that accretion does vary with orbital inclination.
Interplanetary dust accreting on the sun has previously been proposed as a driver of the ice ages ( 28 , 29 ). Clube ( 30 ) discussed the possibility of accretion from a single large and unknown meteor stream affecting earth’s climate, but he did not draw any conclusions with respect to the periodicity of glacial cycles. Hoyle and Wickramasinghe ( 31 ) calculated the effect that accreting dust in the atmosphere could have on the greenhouse effect through the seeding of ice crystals, and speculated that such accretion could have been responsible for the Little Ice Age. At a meeting of the Royal Astronomical Society, reported by G. Manley ( 32 ), Hoyle discussed the possibility that accretion could remove enough atmospheric water vapor to reduce the greenhouse effect and cause cooling. Stratospheric dust could also be an effective scavenger of other greenhouse gases, including ozone, and possibly could affect the concentration of components such as chlorine that are thought to be responsible for the destruction of ozone.
The climatic effects of high-altitude dust and aerosols are known primarily from volcanic eruptions; global cooling of 0.5–1°C was estimated from the eruption of Krakatoa, and measurable climate changes have been attributed to El Chichon, Pinatubo, and other recent eruptions that injected several megatons of material into the stratosphere. Large explosive volcanic events occur typically once every century, so the average injection of volcanic material is approximately 100 kton/yr ( 33 ). Measurements by Kyte and Wasson ( 34 ) of iridium in oceanic sediments show that the long-term global
average flux from extraterrestrial materials for the period 35–70 Ma is 60–120 kton/yr, about the same as the long-term average from present-day volcanic eruptions.
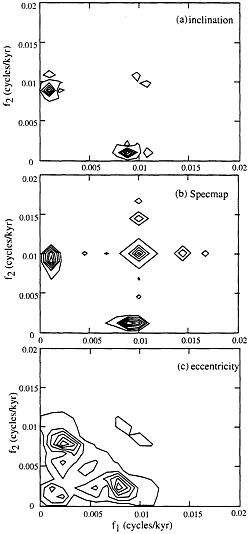
FIG. 4. Bispectra of (a) inclination of the earth’s orbit, (b) d18O data from Specmap, and (c) the eccentricity of the earth’s orbit. The inclination and eccentricity were taken from Quinn et al. ( 5 ) transformed to the invariable plane. Note the close match between the most significant peaks in the inclination bispectrum and d18O bispectrum. The scale is linear, and the units arbitrary; for details of the bispectral method see MacDonald and Muller ( 26 ).
Accretion could cause cooling (as volcanic eruption suggests) or warming (if cometary particles inject water). Large particles (10 µm) take a few hours to reach the ground: smaller particles (0.5 µm) take a few months. Gases can reside for much longer. Extraterrestrial accretion occurs at the top of the atmosphere, so the climate effects could be significantly different from those resulting from volcanic eruptions. In addition, the global distribution of dust from the two mechanisms is different; for example, stratospheric circulation patterns rarely carry volcanic material to the poles.
Data on noctilucent clouds (mesospheric clouds strongly associated with the effects of high meteors and high altitude dust) supports the hypothesis that accretion increases significantly when the Earth passes through the invariable plane. A strong peak in the number of observed noctilucent clouds occurs on about July 9 in the northern hemisphere ( 35 , 36 ) within about a day of the date when the Earth passes through the invariable plane. In the southern hemisphere the peak is approximately on January 9, also consistent with the invariable plane passage, but the data are sparse. This coincidence has not been previously noted, and it supports the contention that there is a peak in accretion at these times. On about the same date there is a similarly narrow peak in the number of polar mesospheric clouds ( 37 ) and there is a broad peak in total meteoric flux ( 38 ). It is therefore possible that it is a trail of meteors in the upper atmosphere, rather than dust, that is responsible for the climate effects.
Discussion
The hypothesis that variations in inclination are responsible for the 100-kyr fluctuations cleanly solves three of the difficulties associated with the hypothesis that variations in eccentricity are responsible. First, the inclination shows a single narrow peak, in agreement with the spectrum of climate proxy records. Second, the variation in inclination does not show any peak at 400 kyr, again in agreement with observations. Third, the inclination hypothesis satisfactorily deals with the causality issue.
The linkage of variations in inclination with climate suffers from the requirement that one must assume the dust concentrations to be sufficient to bring about significant changes in climate. Evidence that extraterrestrial accretion has varied with 100-kyr period is evident in the observations by Farley and Patterson ( 39 ). The spectrum of the observed accretion, as determined from fluctuations in helium-3, is plotted in Fig. 5 . The only statistically significant peak is the predicted one with a period of 100 kyr. This association is suggestive, but we have not yet been able to calculate quantitatively the effect of various mechanisms of accretion on climate.
The sudden onset of the 100-kyr peak about 1 million years ago can also be dealt with by the accretion hypothesis. We are required, however, to assume that the dustiness of the solar system underwent a discontinuous change at about a million years. This would require, for example, the breakup of a large comet. Again, Farley ( 40 ) has shown that indeed there appears to be discontinuity in the rate of accretion about 1 million years ago.
We believe the inclination hypothesis is one that should be further investigated, both in terms of theory and in terms of observations of past rates of extraterrestrial accretion.
Discussions with Walter Alvarez and the Renaissance Geology Group were very helpful. This work was supported in part by the Division of Environmental Sciences, U.S. Department of Energy, under contract DE-AC03-76SF00098.
1. Broecker, W. S. & van Donk, J. ( 1970 ) Rev. Geophys. Space Phys. 8 , 169–197 .
2. Imbrie, J. & Imbrie, K.P. ( 1979 ) Ice Ages, Solving the Mystery ( Harvard Univ. Press , Cambridge, MA ).
3. Milankovitch, M. ( 1941 ) Canon of Insolation and the Ice-Age Problem ( Royal Serbian Academy , Belgrade, Yugoslavia ).
4. Milankovitch, M. ( 1920 ) Théorie Mathématique des Phénomènes Produits par la Radiation Solaire ( Gauthier-Villars , Paris ).
5. Quinn, T. R. , Tremaine, S. & Duncan, M. ( 1991 ) Astron. J. 101 , 2287–2305 .
6. Imbrie, J. , Berger, A. , Boyle, E. , Clemens, S. , Duffy, A. , Howard, W. , Kukla, G. , Kutzbach, J. , Martinson, D. , McIntyre, A. , Mir, A. , Molfino, B. , Morley, J. , Peterson, L. , Pisias, N. , Prell, W. , Raymo, M. , Shackleton, N. & Toggweiller, J. ( 1993 ) Paleoceanography 8 , 699–735 .
7. Ruddiman, W.F. , Raymo, M. & McIntyre, A. ( 1986 ) Earth Planet. Sci. Lett. 80 , 117–129 .
8. Winograd, I. J. , Coplen, T. B. , Landwehr, J. M. , Riggs, A. C. , Ludwig, K. R. , Szabo, B. J. , Kolesar, P. T. & Revesz, K. M. ( 1992 ) Science 258 , 255–260 .
9. Imbrie, J. , Mix, A. C. & Martinson, D. G. ( 1993 ) Nature (London) 363 , 531–533 .
10. Winograd, I. J. & Landwehr, J. M. ( 1993 ) U.S. Geological Survey Open-File ( U.S. Geological Survey , Reston, VA ), Rep. USGS 93–357 .
11. Ludwig, K. R. , Simmons, K. R. , Winograd, I. J. , Szabo, B. J. & Riggs, A. C. ( 1993 ) Science 259 , 1626–1627 .
12. Emiliani, C. ( 1993 ) Nature (London) 364 , 583–584 .
13. Landwehr, J. M. , Winograd, I. J. & Coplen, T. B. ( 1994 ) Nature (London) 368 , 594 .
14. Muller, R. A. & MacDonald, G. J. ( 1995 ) Nature (London) 377 , 107–108 .
15. Ruddiman, W. F. , Raymo, M. E. , Martijnson, D. G. , Clement, B. M. & Backman, J. ( 1989 ) Plaeoceanography 4 , 353–412 .
16. Imbrie, J. , Hays, J. , Martinson, D. , McIntyre, A. , Mix, A. , Morley, J. , Pisias, N. , Prell, W. & Shackleton, N. ( 1984 ) in Milankovitch and Climate Part 1 , eds. Berger, A. , Imbrie, J. & Shackleton, N. ( Riedel, Dordrecht , The Netherlands ), pp. 269–305 .
17. Lomb, N. ( 1976 ) Astrophys. Space Sci. 39 , 447–462 .
18. MacDonald, G. J. ( 1989 ) Rev. Geophys. 27 , 449–469 .
19. Berger, W. H. , Yasuda, M. K. , Bickert, T. , Wefer, G. & Takayama, T. ( 1994 ) Geology 22 , 463–467 .
20. Blackman, R. B. & Tukey, J. W. ( 1958 ) The Measurement of Power Spectra ( Dover , New York ).
21. Imbrie, J. & Imbrie, J. Z. ( 1980 ) Science 207 , 943–952 .
22. Berger, A. & Loutre, M. ( 1991 ) Earth Planet. Sci. Lett. 111 , 369–382 .
23. Neeman, B. U. ( 1993 ) Orbital Tuning of Paleoclimatic Records: A Reassessment ( Lawrence Berkeley National Laboratory , Berkeley, CA ), Rep. LBNL-39572 .
24. Muller, R. A. ( 1994 ) Glacial Cycles and Extraterrestrial Accretion ( Lawrence Berkeley Laboratory , Berkeley, CA ), Rep. LBL-35665 .
25. Muller, R. A. & MacDonald, G. J. ( 1994 ) Glacial Cycles: Orbital Mutation Dominated for the Last 900,000 Years ( Lawrence Berkeley Laboratory , Berkeley, CA ), Rep. LBL-35667 .
26. MacDonald, G. J. & Muller, R. A. ( 1994 ) Bispectral Fingerprint Identifies 100 ky Climate Cycle: Orbital Inclination ( Lawrence Berkeley Laboratory , Berkeley, CA ), Rep. LBL-36214 .
27. Muller, R. A. & MacDonald, G. J. ( 1997 ) Geology 25 , 3–6 .
28. Hoyle, F. & Lyttleton, R. A. ( 1939 ) Proc. Cambridge Philos. Soc. 35 , 405–415 .
29. McCrea, W. H. ( 1975 ) Nature (London) 255 , 607–609 .
30. Clube, S. ( 1987 ) Philos. Trans. R. Soc. London 323 , 421–436 .
31. Hoyle, F. & Wickramasinghe, N. C. ( 1991 ) Nature (London) 350 , 467 .
32. Manley, G. ( 1953 ) Nature (London) 173 , 1206–1208 .
33. Kondratyev, K. Y. ( 1988 ) Climate Shocks: Natural and Anthropogenic ( Wiley , New York ).
34. Kyte, F. T. & Wasson, J. T. ( 1986 ) Science 232 , 1225–1229 .
35. Thomas, G. E. ( 1991 ) Rev. Geophys. 29 , 553–575 .
36. Foyle, B. & Haurwitz, B. ( 1966 ) Space Sci. Rev. 6 , 279–340 .
37. Thomas, G. E. & Olivero, J. J. ( 1989 ) J. Geophys. Res. 94 , 14673–14681 .
38. Whipple, F. L. & Hawkins, G. S. ( 1956 ) J. Meteorol. 13 , 236–240 .
39. Farley, K. & Patterson, D. B. ( 1995 ) Nature (London) 378 , 600–603 .
40. Farley, K. ( 1995 ) Nature (London) 378 , 153–156 .


