
3
Early-Career Employment Profiles of Life-Science PHDS
This chapter presents national survey data on the early-career employment of life-science PhDs over a 22-year period. The employment trends discussed here, combined with supply and demand indicators described in other chapters, constitute the basis of the committee's findings regarding the prospects for persons interested in pursuing careers in the life sciences. The survey data help to explain—and put in perspective—much anecdotal information that has come to committee members' attention about an apparent lack of employment opportunities for recent PhD recipients in the life sciences.
The figures in this chapter (and the tables in appendix F) document what fractions of life-science graduates held faculty, industry, and other positions within 10 years of earning their doctorates and how these fractions changed from 1973 to 1995. The committee presents the data with a focus on the fraction of PhDs holding each type of position rather than total numbers because fractions permit more precise comparison of opportunities available to students in various cohorts. Data on total numbers in different positions are presented at the end of the chapter and in the appendixes. The need for data on employment patterns was noted in a 1995 national study (COSEPUP 1995) that examined graduation education in all fields of science and engineering:
Graduate scientists and engineers and their advisers should receive more up-to-date and accurate information to help them make informed decisions about professional careers; broad electronic access to such information should be provided through a concerted nationwide effort.
The importance of such information was also stressed by several speakers at a public meeting that the committee held in April 1996 and by many young scientists who have complained that they were unaware of the declining career prospects in their fields when they entered graduate school. Some of the latter felt that they had been misled by their mentors, who had conveyed an unrealistically optimistic view of the chances of obtaining faculty positions at major research universities. One explanation for the misinformation is that employment prospects in the life sciences have changed substantially over the last 2 decades; opportunities available to PhD recipients and postdoctoral scientists in the 1990s are different from when their mentors completed graduate training. The employment-progression matrices presented at the end of this chapter and the analyses that follow describe early-career profiles, which should be useful to faculty mentors and to the students and postdoctoral scientists whom they counsel.
Most of the data presented in this chapter come from the biennial Survey of Doctorate Recipients, which since 1973 has collected current employment information in a carefully selected sample (8–13%) of all PhD scientists and engineers in the workforce. Because the survey results are based on a relatively small longitudinal sample, reliable estimates are not available for narrow segments of this population. For example, one would like to be able to distinguish among patterns in different fields—construct separate career profiles of biochemists, plant biologists, epidemiologists, and so on. One might also like to examine the employment histories of minority group scientists and foreign students. Although the sample size does not permit such detailed analyses, it does provide comparisons of the
career patterns of women and men and of the graduates of the 26 leading universities and other life-science PhDs.1 In addition, an analysis has been made of the employment histories of graduates in biomedical and nonbiomedical fields. Because it is difficult to obtain reliable data on foreign nationals with temporary visas who receive their PhDs in the United States and say that they will remain in this country, the tables and figures presented in this chapter and appendix F include only US citizens and those holding permanent visas who had received life-science PhDs from US universities. Nevertheless, it should be recognized that a growing number of foreign students have taken postdoctoral appointments at US institutions and that many of them subsequently seek permanent employment here.
Despite the limitations described above, the analyses that follow provide valuable insights into how the employment opportunities have been changing over the last 2 decades. This historical picture is especially important in showing that the career options of today's students are different from the opportunities that their mentors had when they were in graduate school. This information has already proved useful to the committee in formulating its study findings and recommendations, but it might be of greater interest to graduate students, postdoctoral fellows, and faculty. The committee cautions, however, that the national picture of all life-science PhDs presented here does not necessarily apply to students in a particular field or university department. For example, only a small fraction of biostatistics graduates take postdoctoral appointments, whereas most biochemistry PhD recipients.
Faculty Positions
The most important change in the career patterns of life-science PhDs in the 22-year period was a steady decrease in the fraction holding tenure-track faculty positions. The decline, illustrated in figure 3.1, was observed in all PhD cohorts. For the youngest graduates (those 1–2 years after receipt of the PhD), the fraction holding faculty jobs fell from 0.4 in 1973 to 0.14 in 1995. Some of the precipitous drop might be explained by an increase in the fraction of graduates taking postdoctoral appointments during this period. However, a sharp decline was observed in the oldest cohort (9–10 years after PhD) as well. Only 39% of the latter group held faculty positions in 1995, compared with 61% 22 years earlier.2 What might be most remarkable about this trend is the consistency with which it has occurred over the last 22 years.
It is important to recognize that a substantial decline in faculty opportunities was observed in PhD-granting universities, as well as in other academic institutions. In 1995, for example, only 34% of the graduates with 9–10 years of post-PhD experience held tenure-track faculty appointments in doctoral institutions; in 1973, the comparable figure was 47% (see table F.1). If this decline continues, fewer than one-third of the life-science students now completing their graduate training can expect to obtain tenure-track faculty positions in doctorate-granting institutions, which in the past have been the principal employers of PhDs in this field.
|
1 |
In addition to the above limitations, a few caveats pertain. During the 1973–1995 survey period there have been some modifications in the sampling frame and the wording of specific questions asked in the survey. With regard to the former, the survey sample size was substantially reduced in 1991 (from about 13%–8%), and a concerted effort was made to improve the response rate, which rose from 55% in 1989 to more than 75% in later surveys. It is difficult to estimate the effect of this change on the survey results. pursue postdoctoral training. Important differences might also be found among programs within the same field. The committee urges prospective students and postdoctoral fellows to seek detailed career information from the programs that they are considering and to compare this information with the national data presented in this chapter. |
|
2 |
It should be noted, however, that the total number holding faculty positions has substantially increased during the 22-year period (see figure 3.14). |
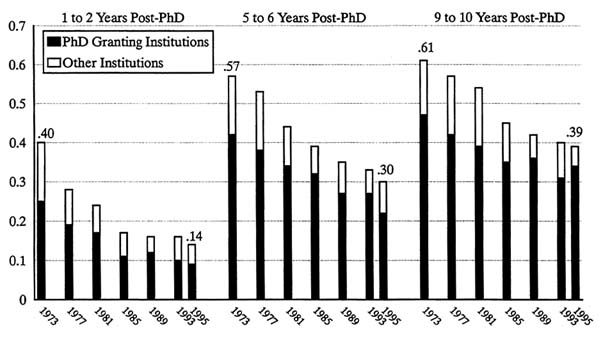
Figure 3.1
Fraction of US life-science PhDs holding faculty positions, 1973–1995.
Data from table F.1.
Employment in Government
A modest decline was also observed in the fraction of life-science PhD recipients employed in national laboratories and other federal, state, and local government positions. In 1995, only 11% of the 9–10 year cohort held government jobs, compared with 14% 22 years earlier (see figure 3.2). The decline might be attributed primarily to downsizing in the major federal laboratories, which in the past had employed large numbers of PhD scientists.
Positions in Industry
The appreciable decline in the fraction of young graduates taking faculty or government positions was accompanied by increased hiring in the industrial sector, especially among the more experienced graduates (see figure 3.2). In 1995, 23% of the life-science graduates with 9–10 years of experience were employed in industry, compared with only 12% in 1973. If that trend continues for the next decade, today's graduate students are more likely to find jobs in industry than on university faculties. However, it should be noted that most of the increase in industrial hiring occurred during the 1980s with only modest growth since 1989. Future employment opportunities in this sector will most likely depend on the national economy and in particular on the health of the biotechnology industry; both are difficult to predict with any confidence.
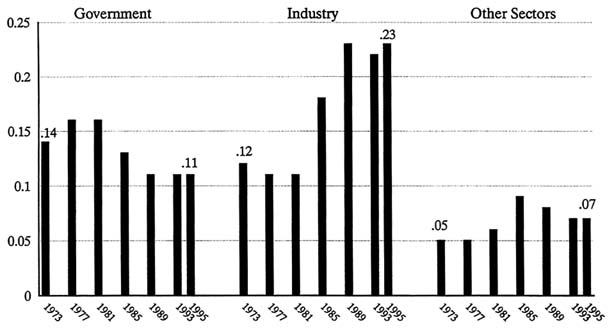
Figure 3.2
Fraction of US life-Science PhDs holding jobs in government, industry, and other sectors, 9–10 years after receipt of degree, 1973–1995.
Data from table F.1.
Other Employment
Considerable attention has recently been given to ''alternative careers" for PhD scientists (such as precollege teaching3, and science journalism), but the fraction employed in such positions remained small. As shown in figure 3.2, only 7% of the life-science PhDs in 1995 held full-time positions outside academe, industry, and government, and—more important—the percentage has declined slightly over the last decade. Various alternative career opportunities (not involving research) might be available, but they are unlikely to be attractive to most young scientists who have just completed 10 years or more of predoctoral and postdoctoral training.
Postdoctoral Appointments
In addition to the growth in industrial employment, we observed a substantial increase in the number of graduates taking postdoctoral appointments in universities and in federal and industrial laboratories. As illustrated in figure 3.3, the fraction of life-science PhDs holding postdoctoral appointments 1–2 years after receipt of their doctorates more than doubled from 1973 to 1995, from 21% to 53%. Perhaps even more important is the increase in postdoctoral fellows in the older cohorts. In 1995, 29% of the graduates with 3–4 years of post-PhD experience
|
3 |
For a discussion of the employment opportunities for PhDs in precollege teaching, see chapter 4 and COSEPUP 1995, p. 33–4. |
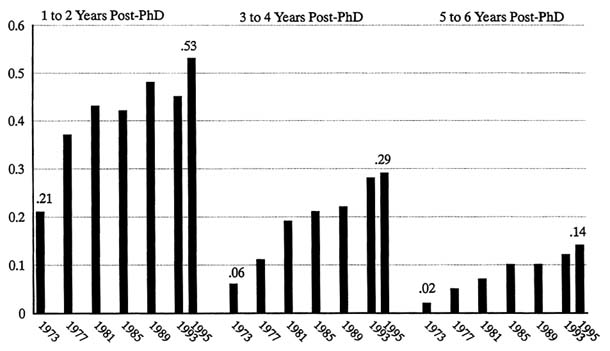
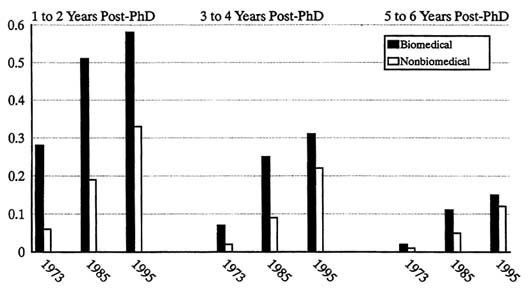
Figure 3.3
Fraction of US life-science PhDs holding postdoctoral appointments in academe, government, and industry, 1973–1995.
Data from table F.1.
and 14% of those with 5–6 years of post-PhD experience still held postdoctoral appointments, compared with only 6% and 2%, respectively, 22 years earlier. The availability of postdoctoral appointments has allowed young scientists to use their research training, even during periods when their immediate employment prospects were not very promising; that is, this apprenticeship has served as an "employment buffer". Nevertheless, the uncertainty (lack of job security) and low salary associated with these temporary positions might well explain the discontent and frustration that the committee has observed in young scientists who after 10 years or more of research training have not yet found permanent jobs. By "permanent" we mean positions in which young scientists can independently apply their education and training in positions that are not transitional, as postdoctoral fellowships, research assistantship, and associate positions generally are.
Involvement in Research
The fraction of young life-science PhDs who designated basic or applied research as their primary work activity grew substantially from 1973 to 1995. For the youngest cohort, the trend might be partly explained by the rapid rise in postdoctoral scientists, who devoted their full energies to research. However, even those with 9–10 years of post-PhD experience exhibited an increasing involvement in research—58% designating it as their primary activity in 1995 compared with 41% in 1973 (see figure 3.4). One may conclude from this finding that, despite a decline in the fraction employed on university faculties and in government, a growing majority of life-science PhDs have been fully using their research training—Although many might be postdoctoral fellows who are not independent researchers.
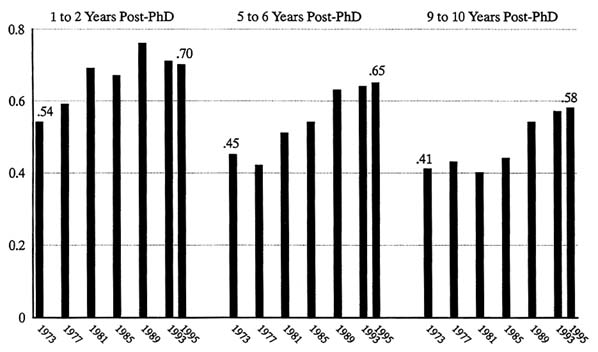
Figure 3.4
Fraction of US life-science PhDs involved primarily in basic or applied research, 1973–1995
Data from table F.1.
Unemployment and Under Use
Most life-science PhDs have been employed full-time in science and engineering endeavors. Data in figure 3.5 confirm that the unemployment rates for these young graduates averaged 1–2% during the 22-year period, and the fraction working part-time remained almost as low. Furthermore, no convincing evidence was found that an increasing fraction of young life-science PhDs are leaving the field.4 The findings, when considered with the growing research involvement described above, suggest that employment prospects have been better for young PhDs in the life science than for graduates in many other sciences, such as mathematics, physics, and chemistry (COSEPUP 1995).
Career Patterns of Women and Men
Differences in the employment patterns of women and men narrowed during the 22-year period. As shown in figure 3.6, women with 9–10 years of post-PhD experience in 1973 were much less likely than their male colleagues to hold faculty appointments in doctorate-granting universities or to be employed in industry or government; but women were more likely than
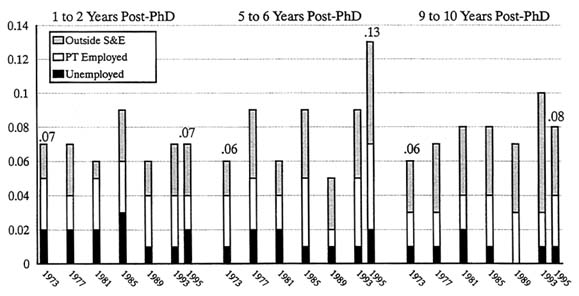
Figure 3.5
Fraction of US life-science PhDs unemployed, employed part-time, or employed outside science and engineering, 1973–1995.
Data from table F.1.
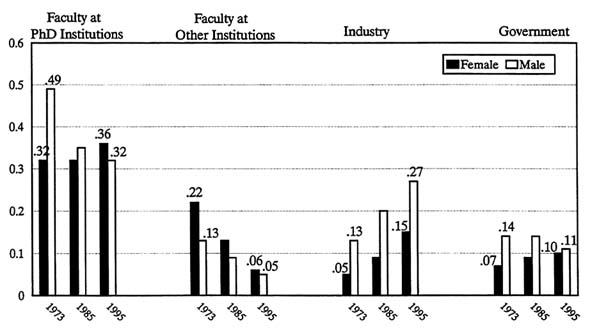
men to hold faculty positions in 4-year and 2-year colleges. By 1995, however, most of those differences in employment situations had greatly diminished. Perhaps most striking is the finding that during the 22-year period the fraction of women with faculty appointments in PhD institutions actually increased slightly (from 32% to 36%) while the comparable fraction for men plummeted (from 49% to 32%). One important difference persisted: in 1995, men were nearly twice as likely as women to hold jobs in industry—27% and 15%, respectively.
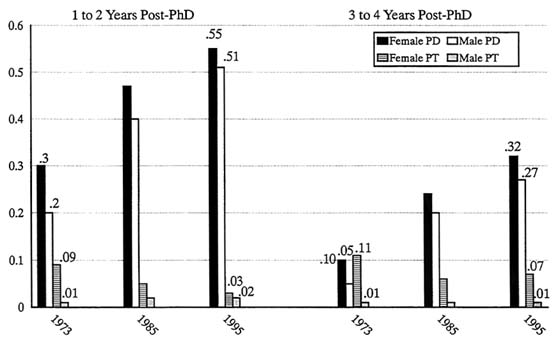
In 1973, women were much more likely than men to hold postdoctoral appointments (see figure 3.7). By 1995, the difference had greatly diminished. Nevertheless, it is important to recognize that the fraction involved in postdoctoral training increased substantially among both women and men during the 2 decades and that both sexes were spending, on the average, much longer periods as postdoctoral fellows. One large difference in employment status did not change much: women were still much more likely than men to be employed part-time. In 1995, for example, 7% of the women who had earned doctorates 3–4 years earlier worked part-time, compared with only 1% of the men.
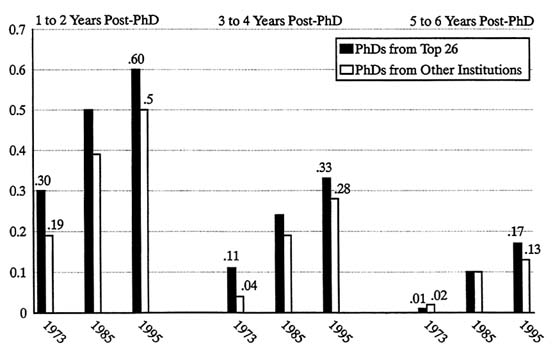
Graduates of Top-Rated Institutions
To compare the career patterns of life-science PhD recipients from the most prestigious programs with those from other schools, the survey sample was divided into two groups based on the reputational ratings (see footnote 2 in chapter 2) of the doctoral institutions. As shown in figure 3.8, graduates of the 26 top-rated schools were less likely than their colleagues—9–10 years after receipt of their PhDs—to hold positions in industry and government. What might be most important, however, are the 1973–1995 changes in the fraction with faculty appointments in doctorate-granting universities. The diminishing opportunities for such positions affected both groups of graduates, but those of the highest-rated institutions appear to have faired much better. In 1995, 45% of the latter graduates held faculty positions at PhD-granting universities, compared with 29% of the PhD recipients from other schools. In 1973, the differences between the too groups were negligible.

Those from the highest-rated schools were also more likely to take postdoctoral appointments (see figure 3.9). In 1995, for example, 60% of the most recent graduates from the top-26 institutions held postdoctoral appointments, compared with 50% of the PhD recipients from other schools. That finding is not surprising inasmuch as graduates of the most prestigious programs were more likely than their colleagues to obtain university faculty positions, which usually require postdoctoral experience. Nevertheless, it should be noted that in 1995 17% of the PhDs from the top-26 schools still held postdoctoral appointments 5–6 years after graduation—an indication that many were having difficulty in finding permanent positions.
Field Differences
As already indicated, the size of the survey sample did not permit an analysis of employment patterns in individual disciplines. However, it was possible to divide the survey responses into two broad categories of fields: biomedical and nonbiomedical, as listed in appendix D. Although the general trends in employment were similar, the employment profiles of the two groups reveal some important differences (see figure 3.10). Biomedical PhDs were somewhat more likely than their nonbiomedical counterparts to hold faculty positions at PhD-granting institutions; those in the nonbiomedical fields were somewhat
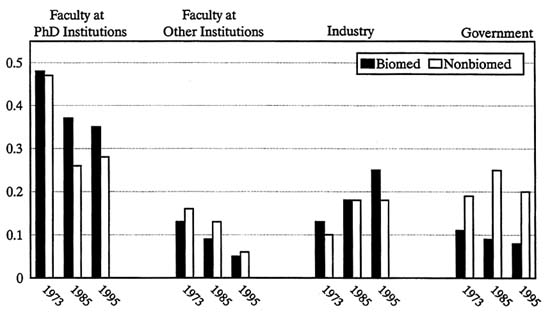
more likely to hold faculty positions at other than PhD-granting institutions, Nonbiomedical PhDs were far more likely to find work in government than biomedical PhDs. There are temporal differences as well. For example, the fraction of nonbiomedical PhDs on the faculty of PhD-granting institutions increased slightly between the 1985 and 1995 surveys, whereas the fraction of biomedical PhDs in such positions continued the steady decrease begun in 1975. However, the number of nonbiomedical PhDs in the sample was only one-fifth the number of biomedical PhDs, and the differences might be more apparent than real. A high percentage of biomedical PhDs took postdoctoral positions in every year examined in this report. However, graduates in the nonbiomedical group increasingly also took postdoctoral positions: in 1995, 33% of those with 1–2 years of post-PhD experience held postdoctoral fellowships, compared with only 6% in 1973 (see figure 3.11). It appears that the trend toward more frequent and longer postdoctoral appointments affected all graduates—not just those in the biomedical sciences.
Discussion
The foregoing analysis helps to interpret an important paradox that the committee has encountered. Young graduates in the life sciences have expressed frustration and anguish over the dearth of career opportunities available to them—especially in the academic sector, where often more than 100 candidates have applied for a single faculty opening—but there is no evidence of appreciable unemployment or underemployment.
The data presented in this chapter confirm that the unemployment rate among recent PhD recipients in the life sciences has remained low (between 1% and 2%), and there is no indication that large numbers of them have left the field. Moreover, a majority of the graduates have been primarily engaged in basic and applied research—an indication that they have been fully using their research training—and this fraction has been rising. The intensive research involvement might be at least partly attributed to an expansion in industrial hiring, which began in the early 1980s, as well as to a large increase in the number of postdoctoral fellows.
So what is the problem? Over the last 2 decades, there has been a substantial decline in the fraction of young PhDs in the life sciences who have obtained tenure-track positions on university and college faculties—the positions considered most desirable by many life scientists. If the decline continues at its current rate, fewer than one-third of today's graduates can be expected to obtain faculty appointments, to which a majority of students have aspired. The apparent mismatch between career expectations and opportunities for faculty positions might be ameliorated, at least in part, by a growing awareness among students, postdoctoral fellows, and faculty of the career options available to today's graduates. It is the committee's hope that the career-progression matrices and accompanying analysis presented here will enhance their awareness of the changing employment prospects in the life sciences.
A second problem, perhaps more difficult to solve, is the increase in the fraction of young scientists who, after extensive postdoctoral apprenticeships, still have not obtained "permanent" full-time positions in academe, industry, government, or private research organization. As illustrated in figure 3.12, in 1995, 39% of life-science PhDs 5–6 years after receipt of their doctorates held postdoctoral fellowships or other nonfaculty jobs in universities, were employed
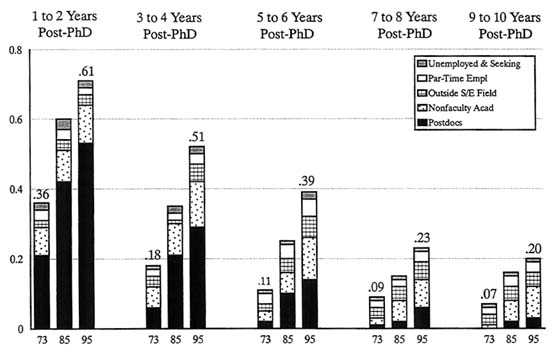
Figure 3.12
Fraction of US life-science PhDs not holding permanent full-time jobs in science or engineering, 1973, 1985, and 1995.
Data from table F.1.
part-time, worked outside science and engineering, or were unemployed; the comparable fraction in 1973 was only 11%.5 What might be most alarming about the 1995 figure is that it reflects the situations of those who earned PhDs in 1989 and 1990. For those receiving their doctorates now, the prospects for finding career positions on university faculties or in government or industry where their long research training will be fully used are even less certain. For young scientists caught in this "postdoctoral holding pattern", the frustrations are understandable; most of them are 35–40 years old, and they typically receive low salaries and have little job security or status within the university setting (for example, most are not permitted to apply for research grants as independent investigators). Moreover, they are competing with a rapidly growing pool of highly talented young scientists—including many highly qualified foreign postdoctoral appointees—for a small number of jobs in academe, government, and industry. This situation—and its implications for individual scientists and the research enterprise—is a matter of great concern to the committee. We explore these implications in later chapters.
Although the prospects for permanent research positions have declined substantially for all life-science graduates, different groups have been unequally affected by the trend. As shown in figure 3.13, the fraction of women with 5–6 years of post-PhD experience who still held
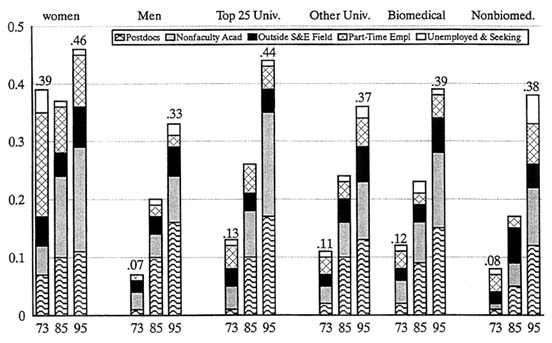
"temporary" or part-time positions has been much higher than the fraction of men, but the difference narrowed from 1973 to 1995. Graduates of the highest-rated institutions found positions later than their colleagues from other schools. However, the difference might be explained primarily by the fact that graduates of the leading institutions were more likely to take postdoctoral apprenticeships and more likely to hold postdoctoral or other nonfaculty positions in academe 5–6 years after graduation. Similarly, recent biomedical-science PhDs were more likely than graduates in nonbiomedical life-science disciplines to hold temporary (non-tenure-track) appointments in universities. Those and other differences in the career patterns of individual groups indicate that the observed national employment patterns of all life-science PhDs do not necessarily apply to those in a particular field, department, or group. For that reason, it is imperative that the employment histories of graduates of individual university departments be made available to prospective graduate students and postdoctorals.
The changes in career prospects for young scientists occurred while the total numbers of life scientists in the workforce continued to increase. Figure 3.14 shows the numbers of life-science PhDs (US citizens and permanent residents only) in the workforce. The figure reveals that the numbers employed in every sector continued to grow throughout the 22-year period. Much of the growth in the faculty at PhD-granting institutions occurred before 1989. In contrast, the most pronounced and persistent trend in the 22-year period is the growth in the numbers in industry, postdoctoral
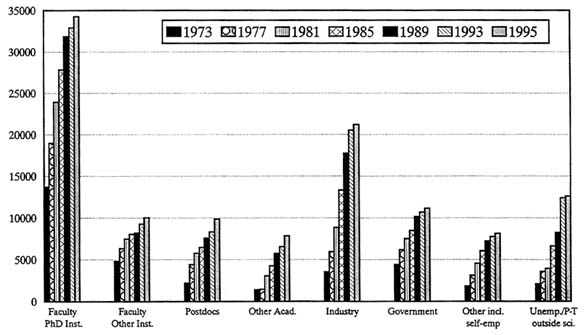
fellows,6 other (nontenured or non-tenure-track) academics, other including self-employed, and the group containing unemployed, part-time, and PhDs now working outside science and engineering.
The results of the changing employment patterns are illustrated in figure 3.15. The figure shows changes in the number of life scientists employed in each sector—or unemployed and seeking employment—in three periods: 1973–1981, 1981–1989, and 1993–1995, the latest period on which data are available. In the 1970s, by far the largest increase in the workforce was in faculty jobs (41.5% of the total growth); in the 1980s, industrial positions accounted for the largest share of additions to the workforce (28.1% of the total growth), just ahead of faculty positions. However, in 1993–1995, the total growth in faculty and industry workforce was less than the increase in the numbers of persons in temporary and under use positions (postdoctoral and other nonfaculty staff, unemployed, part-time employed, and outside science and engineering), which accounted for 45.4% of the growth in life-science "workforce", compared with about 25% in earlier years. The data in figure 3.15 help to explain the conundrum of a growing workforce, a low rate of unemployment, and a high level of dissatisfaction among life scientists seeking to establish careers. Compared to previous years, an increasing percentage of these younger life scientists are in temporary positions.
|
6 |
Figure 3.14 used Survey of Doctorate Recipients data, which include only US citizens and permanent residents. The numbers of postdoctoral fellows shown in the figure are therefore lower than the numbers shown in chapter 2. |
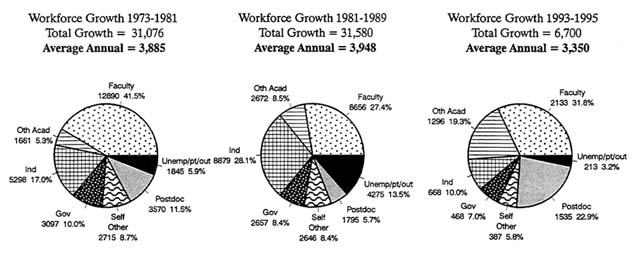
Figure 3.15
Increase in life-science PhD workforce in 1973–1981, 1981–1989, and 1993–1995, by sector.
Data from table F.8.
References
COSEPUP (National Academy of Sciences, Committee on Science, Engineering, and Public Policy). 1995. Reshaping the graduate education of scientists and engineers. Washington, DC: National Academy Press.


