Appendix A
Assessing Uncertainty in Decision Processes
The object of regulating drinking water contaminants is to reduce preventable disease, disability, and death related to drinking water. This assumes that removing, reducing, or preventing contamination of drinking water will result in a mitigation of adverse health effects. Created under the authority of the Safe Drinking Water Act (SDWA) Amendments of 1996, a Drinking Water Contaminant Candidate List (CCL) is a list of contaminants from which decisions to take regulatory action will primarily begin. The framework presented suggests a general scheme EPA might use to develop a decision process to place chemical or microbiological contaminants on a track for regulation, increased research, or removal from a CCL. Realization of this or any other framework requires specific choices that affect how widely or narrowly "the net" will be cast in capturing contaminants that potentially are of public health importance.
As noted in Chapter 5, an ideal decision process is one that exactly selects only those contaminants whose regulation will reduce disease, disability or death, and exactly dismisses those contaminants that play little or no part in affecting human health. Unfortunately, the true state of nature ("the truth") remains either unknown or shrouded in uncertainty for the majority of contaminants on the CCL. It is likely, therefore, that there will be some error in the decision process, allowing some contaminants that should be regulated to pass through, while placing other relatively harmless contaminants on a regulatory track. Thus, there are two kinds of errors that participants in a decision process can make.
Assume there are N contaminants on the list (for the CCL, N = 60, however, it will be demonstrated that the size of N is irrelevant) and EPA uses a decision process that correctly identifies a proportion (s1) of the contaminants that need
regulating (thus leaving [1-s1] of these contaminants unidentified) and correctly identifies another proportion (s2) of contaminants that are harmless. The numbers s1 and s2 are features of a particular decision process and will change as the criteria in this process change (e.g., if the agency decides to use a 10-6 rather than a 10-5 risk level as a trigger for regulation). Assume further that a proportion, p, of contaminants on the list is "truly" in need of regulation.
Given any decision process, it is possible to cross-classify the results in the following 2 × 2 table:
|
|
|
EPA Decision |
|
|
|
|
|
Regulate |
Do not regulate |
|
|
"Truth" |
Should regulate |
s1*p*N |
(1-s1)*p*N |
p*N |
|
|
Should not regulate |
(1-s2)(1-p)*N |
s2*(1-p)*N |
(1-p)*N |
|
|
|
s1*p*N +(1-s2)(1-p)*N |
(1-s1)*p*N + s2*(1-p)*N |
N |
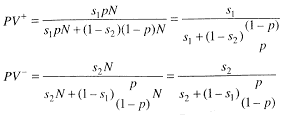
It is now possible to answer two important questions: given a decision to regulate, what is the chance that this decision was correct? Given a decision not to regulate, what is the chance that this decision was correct? In screening parlance, the first is commonly called the positive predictive value (PV+), the latter the negative predictive value (PV-), while s1 is the sensitivity of the decision process, and s2 is its specificity. The prevalence of the condition that is being screened is p, in this case, the proportion of contaminants on the CCL that should be regulated. Thus, p depends on the criteria used to construct the CCL.
PV+ measures the chance that a contaminant that was selected for regulation was chosen correctly, so (1-PV+) represents the fraction of contaminants that were incorrectly selected for regulation. This type of error represents a cost to utilities and the public. PV-, on the other hand, is the fraction of contaminants that are correctly unregulated, so (1-PV-) represents the fraction of contaminants that are not regulated but should be. This error represents a public health cost. It can readily be seen that policies affecting PV+ and PV- will have implications for costs and for public health. What determines these two quantities?
To calculate PV+ and PV-:

Note, N is present in every factor in the numerator and denominator and, hence, drops out. Moreover, both PV+ and PV- depend on s1 and s2 (this is to be expected, as these numbers represent how well a specific decision process performs), but also on p, the proportion of contaminants on the list that need regulating. EPA must contend with a relatively higher p for a list like the CCL, which, by virtue of the way it was developed, is "enriched" with contaminants that likely need regulating relative to a random sample of environmental contaminants.
P is provided by nature, although it can be altered changing the criteria that govern entry onto the candidate list. Given the existing CCL, p is fixed, but s1 and s2 can still be adjusted by using different decision processes. Either one of s1 and s2 can always be made 100 percent merely by deciding to regulate all contaminants on the list (i.e., s1 = 100 percent or no contaminants on the list (i.e., s2 = 100 percent). In the first case, the process correctly identifies all contaminants that need regulating, but will likely drag along many that do not. The reverse is true for s2 = 100 percent. In some (rare) instances you might have a decision process that has both s1 and s2 equaling 100 percent. In that case, one could decide with certainty, in every instance, whether a chemical needs regulating or not. While this is the ideal, it is not the usual circumstance. In most cases, both s1 and s2 will fall short (sometimes far short) of the ideal. It is important to examine the consequence of this.
To begin, it is useful to select a few examples.
|
a) p = 0.8 |
s1 = 90%, |
s2 = 90%. |
This represents a list with a high percentage of contaminants that truly need regulating, and a decision process that is extremely accurate. It correctly selects 90 percent of the contaminants that need regulating, and ignores 90 percent of those that do not. We calculate PV+ and PV-:
|
PV+ = 97% |
PV-= 69% |
Thus, there is little monetary cost to utilities and consumers, but almost one in three (31%) contaminants that should have been regulated were not.
|
b) p = 0.5 |
s1 = 90%, |
s2 = 90%. |
|
PV+ = 90% |
PV-= 90% |
|
In this example, the list is evenly split between contaminants that need regulating and those that do not. The performance of the decision process mirrors s1 and s2.
|
c) p = 0.1 |
s1 = 90%, |
s2 = 90%. |
|
PV+ = 50% |
PV-= 99% |
|
While the public health efficiency is low, the utility and consumer efficiency is high, with only 50 percent of the regulated contaminants needing regulation. This represents a list with relatively few contaminants that need regulating, but those that do need regulating are identified.
|
d) p = 0.01 |
s1 = 90%, |
s2 = 90%. |
|
PV+ = 8% |
PV-= 99+% |
|
In the last example, few contaminants on the list actually require regulation, but they are identified. However, the cost to utilities and consumers is high (92 percent of the regulated contaminants do not actually need regulating).
It is important to emphasize that in each example, exactly the same decision process is being used, only the list it operates on is different. It is possible to make some general statements about the effects of different decision processes when p varies. First, both measures of "correctness" depend on s1, s2, and p. For high prevalence values, most decision processes (i.e., almost all combinations of s1 and s2) lead to low PV-(public health costs in terms of mistaken decisions). On the other hand, for low values of p, most decision processes (combinations of s1 and s2) lead to a high proportion of public health decisions being correct. The reverse situation will hold for PV+ (a measure of wasted monetary costs).
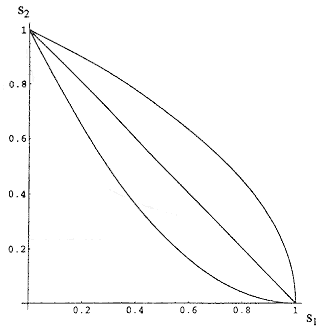
The criteria used in a given specific decision process determine both s1 and s2 and different processes can have different combinations of s1 and s2. Generally speaking, a very poor decision process will have low parameters; a good one will have high parameters. But for a given process with criteria that can be adjusted (e.g., how many species of animals are necessary to consider a chemical a carcinogen), changes in the criteria meant to increase either s1 or s2 will usually act to decrease the other. The way s1 and s2 co-vary can have an important effect on their impact on PV+ and PV-. To illustrate, consider three generic cases of inverse variation of s2 with s1: a linear decrease, a supralinear decrease, and a sublinear decrease (see Figure A-1).

Figure A-1
Supralinear, linear, and sublinear relationships between s1 and s2.
Linear: s2 = (1-s1)
Supralinear: s2 = (1-s1)1/2
Sublinear: s2 = (1-s1)2
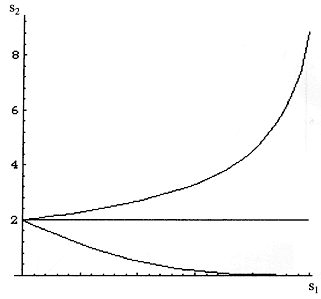
In all three instances s2 decreases as s1 increases (and vice versa), but the effect on PV- is different in each case (see Figure A-2). Similar effects are produced on PV+ for different patterns of dependence of s1 and s2. What is most surprising is that for some dependencies of s2 on s1, both measures can move in the same direction (both up or both down).
Any attempt to increase the proportion of contaminants ''captured" by changing decision criteria (e.g., increasing s1) will have a different effect depending on the specific way that s2 trades off with s1. In one case PV- will increase, in another it will not change, and in a third instance it will decrease. The effect is produced by the speed that s2 changes with respect to s1. Thus, the consequences of changing decision criteria can be complex and unpredictable.
Some generalizations are possible. If it is desirable to have both PV+ and PV- to be greater than 50 percent (i.e., correct more often than not) then s1 + s2> 1.0. However, s1 + s2 > 1.0 only guarantees that PV+ and PV-> 1.0, not that each individually will be > 0.5. When using contaminant lists with a high preva-

Figure A-2
Changes to PV- as decision process altered to increase s1 as s2 decreases linearly (flat line), supralinearly (increasing line), or sublinearly (decreasing line).
lence of contaminants that need regulation (like the CCL), a high s2 is likely to influence PV+ (monetary cost efficiency), while high s1 is more likely to influence PV- favorably (public health efficiency). The reverse is true for lists with an expected low proportion of regulated contaminants (e.g., a list generated with a "wide net" with respect to potentially dangerous contaminants). However, when adjustments are made in the decision criteria used to accommodate desirable performance, it is possible for an unexpected result to appear, depending on the mutual dependence of s2 and s1, as shown above.
In order to predict and evaluate the effects of changing criteria, EPA should consider estimating s1 and s2 by applying any contemplated decision process to a group of contaminants that are currently widely accepted as appropriately regulated and a group of contaminants widely accepted as not needing regulation. By changing the criteria to affect s1 (or s2) it would also be possible, in principle, to estimate the functional relationship between s1 and s2. These general observations are applicable to any decision process, whether applied to elements of the CCL or to general contaminants considered as candidates for the CCL. The analysis demonstrates that the same decision process can produce quite different costs and benefits in these two applications.


