


Below is the uncorrected machine-read text of this chapter, intended to provide our own search engines and external engines with highly rich, chapter-representative searchable text of each book. Because it is UNCORRECTED material, please consider the following text as a useful but insufficient proxy for the authoritative book pages.
CHAPTER 5. STUDY OF SMOOTHNESS-MEASURING EQUIPMENT AND INDICES Purpose and Objectives As more and more agencies are adopting pavement smoothness specifications, ancT as the monitoring of pavement smoothness becomes a more common activity In the pavement management area, there is a strong motivation to evaluate the smoothness-measuring equipment and associated smoothness indices commonly in use. Currently in the U.S., there is a wide variety of smoo~ness-measur~ng equipment and smoothness indices employed. Moreover, many agencies employ different equipment and indices for measuring Initial pavement smoothness and time 1 1 ~ 1 . . monitored smoothness. Icleally, the same equipment usect to measure crucial smoothness would be used to measure the smoothness of that pavement over time. The results of the analyses conducted in chapter 4 strongly indicate the positive effect of initial smoothness on the future smoothness of the pavement. This is a very important finding that supports what has been intuitively believed by many within the pavement community. However, a set of recommended guidelines is now needec! for measuring and reporting crucial smoothness which, to the extent possible, represent a consensus or trend of best practices. These guidelines may therefore serve as a dynamic "nucleus document" around which to add unprov~ng and clarifying information over a reasonable period of lime, such that State DOTs can migrate from their current varied practices toward a standardized approach to measuring and specifying Axial smoothness. Due to the integrated nature of a smoothness index and smoothness-measur~ng equipment In an overall test procedure, this project studied each side of the smoothness issu~quipment and indices to arrive at recommended specifications for equipment used to measure ~rutial pavement smoothness. This was accomplished through a review of current smoothness-measuring equipment and Trough an evaluation of current smoothness summary statistics. Once recommended summary statistics were selected, specifications for the equipment were developed. Review of Smoothness-Measuring Equipment aL 1 Over the last century, a vast array of equipment has been developed to evaluate the smoothness of pavements. In recent years, the growing interest in pavement management systems has focused on pavement ride as a major factor in evaluating the condition of a road, thereby creating He need for economically evaluating the extensive mileage of a highway system. Electronics and modern technology have been applied, creating an ever-expanding approach to the subject. 163
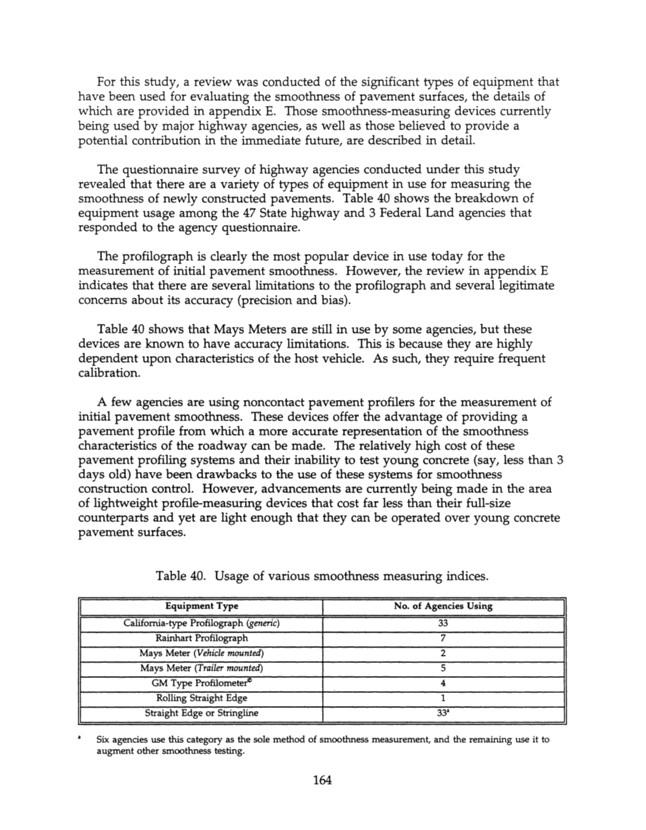
For this study, a review was conducted of the significant types of equipment that have been used for evaluating the smoothness of pavement surfaces, the details of which are provided in appendix E. Those smoothness-measur~ng devices currently being used by major highway agencies, as well as those believed to provide a potential contribution in the immediate future, are clescribed in detail. The questionnaire survey of highway agencies conductecl under this study revealed that Mere are a variety of types of equipment in use for measuring the smoothness of newly constructed pavements. Table 40 shows the breakdown of equipment usage among the 47 State highway and 3 Federal Lancl agencies that responded to the agency questionnaire. The profilograph is clearly the most popular device ~ use today for the measurement of initial pavement smoothness. However, the review in appendix E indicates Cat there are several limitations to the profilograph and several legitimate concerns about its accuracy (precision and bias). Table 40 shows that Mays Meters are still in use by some agencies, but these devices are known to have accuracy limitations. This is because they are highly dependent upon characteristics of the host vehicle. As such, they require frequent calibration. A few agencies are using noncontact pavement profilers for Me measurement of initial pavement smoothness. These devices offer We advantage of providing a pavement profile from which a more accurate representation of Me smoothness characteristics of Me roadway can be made. The relatively high cost of these pavement profiling systems and their inability to test young concrete (say, less than 3 days old) have been drawbacks to the use of these systems for smoothness construction control. However, advancements are currency being made In the area of lightweight profit - measuring devices Cat cost far less than their full-size counterparts and yet are light enough that they can be operated over young concrete pavement surfaces. Table 40. Usage of various smoothness measuring indices. Equipment Type California-type Profilograph (generic) Rainhart Profilograph No. of Agencies Using Mays Meter (Vehicle mounted) . . . . . . Mays Meter (Trailer mounted) - GM Type Profilometer~ Rolling Straight Edge . Straight Edge or Stringline 33a a Six agencies use this category as the sole method of smoothness measurement, and the remaining use it to augment other smoothness testing. 164
The review of equipment focused on types of devices that could be appropriate for use on major highway projects, are currently available, and have at least limited use by a major highway agency. The following important principles can be defined as a result of this equipment review: 1. A testing procedure should be "profile-based" and have a high correlation with user response to road roughness. 2. A testing procedure should be refined to a degree of accuracy (precision and bias) to allow it to be used with adequate def~rution in a smoothness specification. 3. Pavement surface characteristics should be evaluated ~ a manner Mat is fair to the agency and construction industry alike. 4. A testing procedure should be understandable by all involved anti defensible In a court of law. A testing procedure should have the support of managers and technicians. Although the review indicated several pieces of equipment Cat could be used In measurement of initial pavement smoothness, it is apparent that the capabilities and characteristics of the necessary smoothness-measuring equipment is largely driven by the smoothness index that it measures. As such, a smoothness Index must first be selected before suitable equipment (or equipment characteristics) can be identified. For example, once a recommended index is chosen, the necessary equipment properties (sample interval, wavelength accuracy range, and dynamic accuracy) can be defined to complete the equipment specification. Therefore, a review of various smoothness indices is warranted and is presented in the following section. Descuplion of Smoothness (Roughness) Indices Discussed in this section are the more prominent pavement roughness measurement statistics for assessing pavement smoothness. Because the degree of index correlation with the response of highway users is critical to the selection of appropriate indices, available information regarding each index's relationship with user response is included below. These Indices of pavement smoothness are grouped according to three categories: subjective ratings, mechanical fiIter-based numerics, and profile-based numerics (Paterson 1987a). Subjective Rating Indices Several subjective ratings of pavement roughness have been developeci, most significantly the present serviceability rating (PSR) concept developed at the AASHO Road Test (Carey and Trick 1960~. This rating index has received widespread usage since He AASHO Road Test, as many highway agencies adoptecl the PER or modified it based on regional information. However, the use of subjective pavement ratings based on He response of a pane} of pavement raters is not economically practical for the assessment of initial pavement smoothness. Furthermore, other factors, such as vehicle size and type, pane] size, extent and type of pane! training, 165
and panel regionality, may also affect the repeatability and bias of subjective rating numerics (Hutchinson 1964; Sayers 1996; Janoff, Nick, Davit, and Hayhoe 1985). Because of their economic Unpracticality and difficulties In obtaining repeatable assessments, subjective ratings are not reco~runended as prunary indices for the assessment of initial pavement smoothness. However, the response of highway users and perhaps the additional pavement damage from dynamic loads should be controlling factors In defining acceptable levels of pavement smoothness. Because of this strong desire in the highway community to correlate roughness indices with user response, He roughness-user response relationship has been explored in various studies for both response-type and profile-based numerics Janoff, Nick, Davit, and Hayhoe 1985; Sayers and Gillespie 1986; lanoff 1988; Al-Omari and Darter 1992~. The correlation of roughness indices with subjective ratings of user response is used later as a critical factor in the selection of an index for pavement smoothness. Mechanical Filter-Based Indices Mechanical systems for measuring roadway roughness Include response-type road roughness measuring (RTRRM) systems and rolling straighteclge systems. RTRRM systems measure the cumulative relative displacement between the axle and He vehicle body and average Hat value over some distance of roadway; ~us, the Index is reported In terms of vertical deviation over distance of roadway traveled (e.g., in/mi). Summary numerics measured by response-type systems (e.g., Mays Ride Meter iMRM], PCA Roadmeter, and BPR Roughometer), calibrated to a profile or over numeric in some cases, are reported to not correlate well win user response to roadway roughness. Mays Ride Number The Mays ride number (MRN) is a measure of accrued vertical axle travel per length of highway travel. It is obtained from a displacement transducer that detects small Increments of axle movement relative to the car body, expressed In units of length/length (generally In terms of in/mi). This summary statistic rectifies each increment of positive or negative movement of the axle relative to the vehicle body and then calculates the average rectified axle displacement over the length of the test section. In essence, the MEN statistic (in the absence of nonlinear effects) is He average rectified velocity (ARV) of the axle motion, multiplied by the tune needed to travel ~ mi (~.6 km) at the prescribed test speed (Gillespie, Sayers, and Segal 1980~0 The repeatability and accuracy of this technique is affected by vehicle loading, placement of He measuring apparatus in the vehicle (preferably in He center to neutralize the effects of vehicle roll), tire pressure, suspension spring rate, friction, and shock absorber characteristics. The MRN is noted to correlate better with user response than other REARM system outputs, such as the PCA Roadmeter and the BPR Roughometer indices; therefore, it is considered the best of the available response-type systems (Gillespie, Sayers, and Segal 1980~. Results of a correlation between the average of a 21-member 166
pane] rating and MRN in 1984 yielded a moderate correlation coefficient (R2) of 0.58 danoff and Davit 1984~. However, results of the International Road Roughness Experiment (IRRE) conducted in 1982 indicated good correlation between MRM output and the subjective response of a small pane} for AC pavements (Sayers and Gillespie 19861. Two NCHRP studies completed in 1985 and 1988 using strict quality control and large rating panels yielded Tow to moderate R2 values (0.55 and 0.62, respectively) between MRN and mean pane] ratings (MPR) for all pavement types danoff, Nick, Davit, and Hayhoe 1985; lanoff 1988~. Those same studies concluded that for PCC and composite surfaces and for all Tree pavement types (AC, PCC, and composite) combined, MRN measures do not accurately predict rideability danoff 19881. A 1987 Kansas DOT research project using 108 AC, PCC, and composite test sections resulted In moderate panel rating R2 values of 0.67 for both AC and PCC pavements (Moore, Clark, and Plumb 1987~. A 1987 research project in Ohio indicated poor correlation between MRN and user response for PCC pavements, although the correlation for AC pavements was fair (Spangler and Kelly 1987~. Finally, a smaller panel rating study In Colorado yielded high correlation values between MRN and user response for AC pavements and very low correlation values between MRN and user response for PCC pavements; tests were conducted at both 35 and 55 mi/hr (56 and 88 km/hr) (Arterburn and Suprenant 1990~. MRN values for the Colorado studies were determined from root-mean square acceleration (RMSA) values obtained using a high-speed profile measuring system win ultrasonic sensors. Table 41 summarizes the reported correlations between MRN and user response. The inability of the response-type system indices to correlate well with user response and with similar measuring systems can be related to both He inability of response-type systems to measure and sufficiently weight He surface profile wavelengths that are most related to user response and to overall variability within these systems. Response-type systems, such as the ~M, respond to spatial frequencies (i.e., reciprocal of wavelength, spatial frequency of 10 equals wavelength of 0.~) only from about 0.013 to 0.150 cvcles/ft (0.042 to 0.492 cycles/m) whereas , , , ~ , . .. . ~ . ~ ~ ~ ~ . . ~ . . ~ ~ . ~ ~ _ _ panel ratings are highly correlated With spatial frequencies between U.-12d and Mu cycles/ft (0.410 and 2.067 cycles/m) Qanoff 1988~. As a result, the MRM does not respond to short wavelength roughness that is felt by highway users. Similarly, the PCA Roadmeter responds to frequencies between 0.014 and 0.027 cycles/ft (0.046 and 0.089 cycles/m) at 50 mi/hr (80 km/hr), and He BPR Roughometer is excited by pavement surface frequencies between 0.05 and 0.2 cycles/ft (0.164 and 0.66 cycles/m) at 20 mi/hr (32 km/hr) (Gillespie, Sayers, and Segal 1980~. Consequently, these devices, especially the PCA Roadmeter, do not respond adequately to the critical short wavelengths of a pavement profile. 167
Table 41. Correlation of MAN with user response. No. of PCC No. of AC PCC AC All Reference ~ Sections ! Sections ~R2 ~R2 ~Types, R2 , anoff and Davit 1984 i l i I 1 0.58 layers and Gillespie 1986 I 01 11 1 _ 1 0.94 1 I anoff, Nick, Davit, and | 17| 18 | 0. 3 | 0.74 | 0.55 | ~ anoff 1988 1 1111 97 1 0' 18 1 0 85 1 0.62 Moore, Clark, and Plumb | 2~301 78-84 | 0. '7 | 0.67 | |';pangler and Kelly 1987 1 181 17 1 0.36 1 0.74 1 0.56 .\rterburn and Suprenant | 18 | 51 | O ~0.81 ~ Mechanical filters, such as the RTRRM systems, respond to only a small range of roadway profile wavelengths, amplifying and attenuating Me wavelengths that they measure according to the lateral properties of each mechanical device. The estimated gain for a typical RTRRM mechanical system is shown in figure 93. A gain of 1.0 for a waveband indicates that the surface profile output measured by the device is the same as the actual surface profile. Increases or amplifications of Me actual profile elevations are noted by a gain greater than I, whereas decreases or attenuations of Me true elevations result In a gain of less than 1. It is evident from this figure that the true pavement surface profile is not measured by RTRRM systems. Variability in RTRRM systems has been documented since 1980, when Gillespie et al. (1980) concluded that a significant amount of random error is associated win the dependence of RTRRM systems on the dynamics of Weir host vehicle. Factors such as variations In fire pressure, shock absorber properties, vehicle weight changes, and testing speed all affect the output index of RTR1<M systems (Gillespie, Sayers, and Segal 1980; Kulakowski, Chapman, and Wambold 1987; Lu, Bertrand, and Hudson 1990~. Gillespie, Sayers, and Segal (1980) conclude that "in the more critical functions of evaluating sections of Individual roads (especially Me relatively smooth surfaces represented by new construction), the remaining random error Innits the usefulness of RTRRM systems." At the time, it was recommended that low-cost profile measurement/process~ng systems for data collection be developed for measuring a calibrated, time-stable equivalent of an RTRRM system measurement (Gillespie, Sayers, and Segal 1980~. 168
4 ~ - |-St f shock absorbers 3 ~ ~ 1~\ ~ ~ absorbers ~:~ 0.001 0.01 0.1 1 10 Spatial frequency (cycles/ft) Figure 93. Sensitivity of typical RTRRMS to spatial frequency (adapted from Gillespie, Sayers, and Segal 1980). Profile Index (PA from a Profilograph The profilograph, commonly used for initial pavement smoothness control, applies a mechanical rolling straightedge filter to a pavement profile, measuring wavelengths within the range of 1 to 75 ft (0.3 to 23 m) and amplifying or attenuating the wavelengths Mat are factors of the profilograph length (25 ft [7.6 m]). This is evident in figure 94, which shows the profile amplified by a factor of 1.85 at wavelengths of 25 ft (7.6 m) and attenuated by a factor of 0.45 at wavelengths of 12.5 ft (3.S m) (Scofield, Kalevela, Anderson, and Hossa~n 1992). Figure 94 does not include the weighting effect of the in/ml statistic as noted by Darl~ngton (1995). Using the ~n/mi statistic as Me unit of a smoothness index attenuates longer pavement wavelengths and amplifies shorter wavelengths. For example, if a profilograph trace contains sinusoidal waves with a 0.5-:n (12.7-mm) amplitude and a wavelength of 0.2 mi (.32 km), there would be 1 in (25.4 mm) of deviation from the zero trace in each wavelength, and the zero blanking band profilograph in/ml statistic would be 10. However, if sinusoidal waves of the same height were spaced at 0.1 mi (0.16 km), there would be the same deviation per wavelength, and the in/ml statistic would be 20. The relationship between 169
4 - o ~ - Or, n 1 n r, 1 rat 1 Spatial frequency (cycles/ft) 1 - 10 Figure 94. Sensitivity of simulated profilograph to spatial frequency (adapted from Scofield, Kalevela, Anderson, and Hossa~n 1992~. wavelength and in/ml is linear, resulting In a larger gain for pavements with shorter wavelengths. In figure 94, use of Me in/ml statistic would result In the simulated profilograph response gain increasing to the right as spatial frequency increases. Thus, use of the ~n/mi statistic effectively filters me profile data placing a linearly increasing emphasis on shorter wavelengths. Whether by accident or design, the ~n/mi statistic amplifies me shorter wavelengths mat tend to most affect me users' options of a roadway. This has helped the statistic to provide smoothness index values that correlate fairly well with user response. However, the statistic is not based on signal theory, and it applies a linear weighting to profile data wavelengths that is not based on analytical investigation of the relationship between user response and pavement wavelengths. However poorly the profilograph measures the true pavement surface profile, the PI, as derived from the profilograph output, has served me highway corrununity fairly well as an easily understood index of ~rutial pavement smoothness. Nevertheless, recent studies have highlighted cases in which the PI has not correlated well with user response (Darlington 1995~. In addition, one study showed that the PI correlated only moderately well with PSI, with R2 values of 0.705 using a 0.2 in (5 mm) blanking band on roadways less than 20 in/ml (0.32 m/km) (Walker and Lin 170
1988). A slightly better correlation (R2 = 0.742) was obtained when a 0.1 In (2.5 mm) blanking band was used (Walker and kin 1988). This moderate correlation has resulted In several States experimenting with the reduction or eluntnation of the blanking band in their profilogram data reduction (Parcells and Hossain 1994). Research completed In 1989 by the Pennsylvania Transportation Institute ~. ~. ~'.. ~ . concluded that using a blanking band on profilograph traces from new pavements is unacceptable for pavements with PI values less than 7 in/ml (~10 mm/km) (Kulakowski and Wambold 1989~. That study also showed correlations unproved significantly in linear regression between PI and IR] when the blanking band was reduced to 0.! and 0.0 in (2.5 and 0.0 mm). Another study conducted for the South Dakota DOT in 1993 indicates increasing correlation with IRI, PST, and the lanoff ride number (RN~anoff) when the blanking band is reduced to 0.! and 0.0 in (2.5 and 0.0 mm) (Moser, Hudson, and Hudson 1993~. These studies conclude that, as the move toward smoother pavements progresses, it will be important to reduce or eliminate the blanking band from profiIogram evaluation to avoid missing times of pavement roughness important to highway users. ~, ~ User response correlations are not available for pavements measured using 0.: or 0.0 ~ (2.5 or 0.0 mm) blanking bands. Therefore, it is not possible to determine what, if any, increase in correlation with user response can be obtained by reducing the blanking band Further study is necessary to identify the correlation between PI using a reduced blanking band profilogram and user response, especially in the smoothness range of newly-constructed pavements. Computer modeling of rolling straightedge (profiIograph) measurements using pavement surface profiles obtained from inertial and inclinometer equipment are becoming more common. This application allows PI values to be more easily obtained. In addition, it provides a more accurate crucial pavement profile from which other pavement smoothness indices can be obtained. The flexibility and speed provided by PI values modeled using high-speed, more accurate pavement profiles presents the opportunity to maintain Pl-based specifications while simultaneously evaluating other profile-based smoothness specifications. Slope Variance (SV) Another mechanical-type, profile-based statistic developed at the 195~60 AASHO Road Test is the slope variance (SV) (Carey and Huckins 1962~. This value was measured by the CHLOE ProfiIometer as the difference in angles between a small beam with two wheels, 9 in (229 mm) apart, and He 25.5-ft (7.~-m) long trailer towed at a speed of 2 to 3 mi/hr (3.2 to 4.S km/hr) (Gillespie, Sayers, and Segal 19801. The slope variance for He AASHO Road Test was estimated by sampling the slope record at Oft (0.3 m) intervals, finding the mean of the values in each test section, and then computing the mean squarest deviation of those values from the mean (Carey and Huckins 1962~. 171
The gain from the CHT=OE system is near 1.0 for spatial frequencies between 0.02 and 30 cycles/ft (0.06 and 98 cycles/m) and is less than 1.0 for higher spatial frequencies (Gillespie, Sayers, and Segal 1980). A gain of 1.0 indicates perfect representation of the "true" pavement profile. This trueness to the actual slope profile is a positive advantage of the SV statistic; however, SV is derived from a band of profile spatial frequencies much broader than is significant to an automotive vehicle, and as a result introduces a random error that degrades the agreement between RTRRM system output and SV (Gillespie, Sayers, and Segal 1980~. Although the simple geometry of the early profilers implies that SV can be computed mathematically from more accurate profile measures, the earlier instrumentation systems had quirks and complexities that have not been well documented; thus, estimates of SV made from measured profiles are not equivalent to outputs from old instruments. The SV is sensitive to We choice of profile measurement and does not describe a standard roughness measure. The "true" variance of me slope of a road profile is infinite, since Me true profile includes texture effects (Savers and Gillesnie 1986: Savers Gillesnie and Oueiroz 19861. As a ~, ~, ~, ~, _ , ~ ~ ~ . . . ~ ~ . ~ result, the rev is not an ideal pavement smoothness measurement. The information presented above leads to Me conclusion Cat subjective ratings and roughness indices based on mechanical vehicle-response output have shortcomings Cat render them sometimes inadequate or unpractical for use as indices of initial pavement smoothness. Roll~ng-straightedge or profiIograph-based roughness indices are not based on the range of roughness wavelengths that highway users find offensive. The simplicity of PI measurement and its moclerate correlation with user response have helped to make it the most widely used index for ~rutial pavement smoothness quality control. However, advances In the ability to measure and analyze pavement surface profiles and more frequent reports of drivers finding pavements with low PI ratings to be offensively rough have made the use of the PI statistic less ideal. Thus, indices based on measurement of true pavement profile are investigated for their ability to more completely relate with user response and provide a practical method of measuring nutial pavement smoothness. Profile-Based Indices- Mechanical System Simulation Since Me advent of high-speed profile measuring devices, analog and digital filtering have been used to remove unnecessary and unproper wavelengths from measured "true" surface profiles, that is, to amplify or attenuate selected wavebands. Profil~based pavement smoothness numerics are generally obtained by either simulating the response of an RTRRM system as it traverses the profile or by separating (filtering) and weighting the spectra of wavebands that make up the road surface profile. These approaches are similar In that the profile for each is filtered with a band-pass filter, transformed to a positive value, and averaged over He length of the profile. The differences lie mostly in the use of either rectification or squaring and In He filter bandwidths and weighings (Hayhoe 1992~. - r--- 1 1 - 1 ^. ~. . 172
Most roughness indices use either the average rectified slope/velocity (ARS/ARV) or the root mean squared (RMS) elevation/slope/acceleration methods. The average rectified method and its deviations uses the average of the positive values of measured elevation, slope, or velocity. The root mean squared method on the other ~ ~ ~ . . .~ . ~ -~ nanu, cteterm~nes the square root of the squared elevation, slope, or acceleration profile values. Neither of these methods stands alone as an index for pavement smoothness. The RMS and AR slope and acceleration approach infiruty as Me profile surface becomes vertical or as it changes direction abruptly. In addition, a baselength for filtering must be defined for the RMS to be consistent (Sayers, Gillespie, anct Paterson 1986~. The type of filter (mechanical or digital/analog) applied to the pavement surface profile is the determining factor needed, In addition to the RMS or ARS reduction method, for defining a profile-based smoothness Index. RARV and RARS con Distal filters for pavement profiles sometimes attempt to simulate the response of mechanical filters or isolate the profile wavelengths that are well correlated with some factor, such as user response. The reference average rectified velocity (RARV) and the reference average rectified slope (RARS) statistics are examples of indices that filter the pavement profile using quarter-car, four-degree-of-freedom models (Gillespie, Sayers, and Segal 1980~. These statistics were user! to provide a base for ... .. . . ~%, . cat~oranng actual I<~<M system output, resulting In the calibrated average rectified velocity (CARV) statistic (Gillespie, Sayers, and Segal 1980~. The RARV is affected by the simulated speed and sampling interval used to measure Me road profile. Therefore, Me simulation speed is noted win RARV index values (Queiroz and Hudson 1984~. RARV statistics based on several s~ulabon speeds (12, 20, 3l, and 50 mi/hr [20, 32, 50, and 80 km/hr]) were used at the 1982 {RRE for comparison with user response, with better correlations found at the higher simulation speeds (Sayers and Gillespie 1986~. International Roughness Index (IR1) A well-known example of filtering pavement profiles to simulate an RTRRM system response is the "Golden Car" filter used for the IRI. The DO is defined as the reference average rectified slope (RARS80) of a standard quarter- car simulation at a traveling speed of 50 mi/hr (80 km/hr), measured in units of len~th/len~h (~n/mi or m/km) (Sayers, Gillespie, and Queiroz 1986~. con - c} ~ Since the World Bank first published guidelines for conducting and calibrating roughness measurements (Sayers, Gillespie, and Paterson 1986), IRT has been adopted as a standard for the FHWA Highway Perfonnance Monitoring System (HPMS) to provide consistency among States. Since 1989, the FHWA has required that all States report pavement roughness data in TRI units for paved rural arterials and urban freeways, including Interstates. In the last few years, IR] has become a de facto standard in the U.S., largely due to FHWA acceptance, even Rough some States and 173
Provinces maintain smoothness specifications using a different roughness index than TRI. In acTdition, IR] has shown to be reproducible by a wide variety of equipment. It is currently used in Minnesota for control of new PCC pavement construction smoothness along with the profiIograph must-grind statistic (Maurer 1995~. Computation of the I:RI from filtering and weighting the measured pavement profile attenuates and amplifies the profile wavelengths, as shown in figure 95. This model, used in ASTM E Il70-87, provides a band pass filter at frequencies of approximately 0.014 to 0.177 cycles/ft (0.046 to 0.558 cycles/m) at 50 mi/hr (80 km/hr). There is a significant amplification (gain) for the spatial frequencies at about 0.019 cycles/ft (0.062 cycles/m), corresponding to the body bounce mode of vibration, and another amplification is generated for spatial frequencies at about 0.14 cycles/ft (0.46 cycles/m), accounting for the high-frequency wheel hop (Hayhoe 1992~. The range of wavelengths necessary to provide good fidelity in IRI measurements is 2 to 80 It (0.6 to 24 m) (Sayers 1990~. Because of the properties of the ~ statistic, a series of very low amplitude, short wavelength profile deviations can give the same IRI value as a few large amplitude, long wavelength surface deviations. This means that the exact type of roughness exhibited by a pavement section cannot be defined by Me IR] statistic. In addition, it has been demonstrated that IR] for jointed plain concrete pavement dPCP) can be affected by rainfall and 3 2 1 1 1 O- . 0.001 0.01 0.1 1 Spatial frequency (cycles/ft) 1 Figure 95. Sensitivity of IRI to spatial frequency (adapted from Sayers 1990~. 174
changes in air temperature. The following relationship was developed at the University of Wyoming by Ksaibati, Ansan:, and Adkins (1993) that correlated rainfall and air temperature with {R] for one JPCP, resulting In a correlation coefficient (R2) of 0.849: {RI = 2.72 + 0.~17(A) + 0.00357(B) - 0.00065(B)2 (~) where: IR] = International Roughness Index, mm/m. A = 72-hr rainfall before testing, mm. B = Change In 24-hr air temperature, °C. A 1991 Michigan DOT study noted that TR] measurements for the same 200-ft (60.9-m) composite sections increased by 47 to 163 percent from summer to winter conditions. ~ other locations the IR} decreased by 31 to 46 percent from summer to winter. Analysis of these changes led Michigan DOT researchers to conclude Cat composite pavements subject to frost action are rougher in winter than in summer, and composite pavements not subject to frost action are rougher in summer Man In winter (Novak and DeFrain 1992~. Presumably, these climate-related changes in the statistic will also be reflected in over smoothness measuring indices that measure similar short pavement wavelengths. Correlations between ~ and user response indicate that IR] represents user opinion fairly well, as noted in table 42. A follow-up to the 1988 NCHRP study found much better correlation for AC pavements Man for PCC sections (Sayers 1989~. Some of this poor PCC pavement correlation is explained by Sayers and Karamihas (1996) as the result of using an effective half-car roughness index for Me calculations rather Man TR] in the follow-up study. The half-car mode} effectively attenuated the short wavelength content of the profile and affected the correlation. When the IRT was calculated for Me NCHRP ciata, the R2 for PCC increased to 0.61 (Sayers and Karamihas 1996~. Table 42. Correlation of IR] with user response. . No. of PCC ~ No. of AC PCC AC All Types, Reference | Sections | Sections | R2 | R2 | R Darlington 1995 1 14 1 14 1 -1 - 1 0.72 1 Sayers, Gillespie, and Queiroz 1986 l 0 l 11 | -T o91 1 1 Janoff 1988 111 97 0.150.83 0.62 Spangler and Kelly 1987 18 0.50~ 0.79 0.64 Sayers and Kara~nihas 1996 1 111 1 97 T 061r o. 175 it.
Some concern has been raised by Darlington and others about the IRI's tendency to amplify wavelengths longer than those generally correlated with user response (Darlington 19951. The IRT does not give a direct measure of the accelerations affecting the riding comfort perceived by users, although it correlates very highly with them (Paterson 1987a). It is suggested that the reason for the fairly good correlation between ~ and user response is the fact ~at, while TR] focuses on longer wavelength profile information, the amplitude of both long wavelengths (included) and short wavelengths (not included) is generally higher for rougher pavements than for smoother pavements. Occasionally, this relationship has been shown to change, especially in newer pavements. There is also concern Cat the vehicle characteristics embodied In the IR] mathematical mode! may not be specifically representative of all vehicle classes or of future technology. However, it has been demonstrated for heavy trucks that chassis and floor vibrations correlated very highly, and seat vibrations correlated well with the sunulation on which DO is based (Paterson 1987a). Output from the ~ statistic does not differentiate between short- or moderately long-waveleng~ roughness. To address ~is, Sayers (1990) suggests that for new construction two moving IRI baseleng~s be used in computing IRI values. Sayers recommends that a 528-ft (161-m) baselength be used to set overall quality (at a maximum limit of 60 in/ml [0.91 m/km] over 528 ft [161 m] for new construction). A 20-ft (6.~-m) baselength with a magnum limit of 90 ~n/mi (~.42 m/km) over 20 ft (6.1 m) could be used to guard against any sudden surprises (Sayers 1990~. In this way, bow the overall quality of a road and the roughness of short events are defined. The half-car roughness index (HRI), a roughness measure related to He TRI statistic, uses the average profile from both wheel tracks as Inputs to the "golden" quarter-car mode] used In ~ computation (Sayers, Gillespie, and Queiroz 1986~. Although a true half-car mode! is not used for the HRI, mathematically the results of the HR] memos are equivalent to results of a standard half car analysis. This is because neither the half-car model, the HRT, or the ~ account for vehicle roll. Individual wheelpatn roughness tends to be canceled by the profile averaging process, so that for very short wavelengths, the roughness amplitude of He averaged profile is 70.7 percent of the amplitude of a single wheel track profile. For very long wavelengths, the averaging process does not vary between single and averaged wheel Profiles. One shiv indicates that for AC Pavements HRI was 80 Percent 1. J ~ ' , ~ ~ . ~ e ~ e ~ ~ ~ ~ ~ , ~ ATE _ ~ _ - _` ot the average of the 1ndlvldual wneelpatn ant values. nor 1J(~ ; pavements, mat study estunated that the relationship is closer to 90 percent (Sayers 1989~. In terms of a measure of Initial smoothness, the HRT does provide an indicator of the roughness of both wheelpaths in one statistic. However, individual areas of roughness In a single wheelpath are attenuated and can be masked. Since roll is not measured by He HR! statistic, rather its effect is reduced by the profile averaging process, use of He IR] statistic for each wheelpath is preferable to He HRI for initial smoothness measurements. Sayers (1989) expresses this conclusion by stating, "IRI 176
might be viewed as a potentially more useful roughness index simply because it can provide roughness levels separately for left- and right-hand wheel tracks, to show how one side of a lane has deteriorated more than the other. The HRT cannot be used for this purpose." As noted above, correlation of the ~ with user response In the lanoff study was 0.15 for PCC and 0.83 for AC pavements. When Sayers reevaluated the data using IRl model, the PCC correlation increased to 0.61 and the AC correlation increased slightly to 0.90. The large increase in PCC correlation resulted from the HRI's attenuation of short wavelength surface deviations, more generally associated with PCC pavements. Sayers Ride Number (RNSayers) The RN developed by Sayers and Karamihas (1996) also uses a quarter-car filter with properties that reportedly allow the index to correlate well with user response. Data from the 1988 NCHRP study and from a Minnesota DOT study were used for the index development. The RNSayers was derived as an exponenuai transformation ot an RMS slope statistic called the Sayers PI (PISayers) win units of slope (in/in), in the following relationship: RN = 5e 60(PIsayers) _ ~_ ~. e (12) If profiles from two wheelpaths are processed, He RMS of the individual left and right wheelpath PI5ayers values is computed for use In equation 12. Each PISayers computation involves He use of a modification of He IR! algorithm. The modifications include replacing the IR! quarter car coefficients with new values (K~ = 5120, K2 = 390, C = 17, and ~ = 0.036), changing the initialization length from 36.1 It (11.0 m) to 62.3 It (19.0 m), and changing the accumulation computation from mean absolute to root mean square. The gain for this ride number is shown in figure 96. A major intent of this new ride number is to provide a roughness statistic that is insensitive to sample interval, that provides good agreement when calculated using profiles from different devices, and that uses a currently available algorithm to permit ease of changeover to a new index. The correlation of He RNsayers with user response, using data from the 1988 NCHRP study, is good. Some difficulty was found in identifying the pavement wavelengths that correlated best win user response. In Ohio, the wavelengths with good correlation ranged from 1.l to 36 ft (0.34 to 10.97 m), and in Minnesota the range extended from 4.5 to 90.5 It (~.37 to 27.58~. The R2 for all pavements in the Ohio data se! was 0.85, and for the Minnesota data set, the R2 was GAS, both of which indicate very strong correlations (Sayers and Karamihas 1996~. 177
4 l l t; ~ i ~ l ~ l {l~ 1 1 ~ 1 1 1 1 1 1 ~ ~ I 1 1 ~ 1 1 i, 1 1 1 1 1 1 1 ~ I I I I 11 I ,1 1 1 1 1 1 1 1 1 1 1 1 ' 1 1 1 1 1 1 1 1 to ~ 0.001 0.01 0.1 Spatial frequency (cycles/ft) Figure 96. Sensitivity of RNsaye~s to spatial frequency (adapted from Sayers and Karamihas 1996). Telescoped Rolling Straightedge (TRS) 1 10 A recent investigation of the measurement of Me ride quality of flexible pavements, prepared for the Soup Dakota DOT, introduced a smoothness measuring index based on computer-modeled straightedge analysis of Soup Dakota profiler surface maces measured at I-ft (0.305-m) intervals. The mode! places I-ft (0.305-m) incremented straightedges from 2 to 10 it (0.61 to 3.05 m) long across the nine surface elevations on either side of the measurement position. The magnum vertical difference between the measurement position elevation and Me intersecting elevation Of the 45 simulated straightedges is recorded as the maximum vertical distance (MVD) for that measurement position. This process is repeated for each position along Me measured profile and the square roof of the sum of squares normalized to mi (~.61 km) length and a 20-ft (6.l m) maximum straightedge length used to compute the AS statistic (Moser, Hudson, and Hudson 1993~. In concept, the MVD finds Me 2- to 10-ft (0.61- to 3.05-m) straightedge length and longitudinal position where the vertical deviation is maximized. The resulting gain estimated for each ~ in (25.4 mm) amplitude wavelength is shown in figure 97, which indicates Mat the MVD gain oscillates between 1.5 and 2 for wavelengths up to 10 ft (3.05 m) and steadily declines to I.0 at 20 ft (6.) m). The MVD gain is greater than 178
4 ~. . . . . . 1 I 1 - - - TRS/25 (25.4 mm cosine) 1 . ...... . .. ~ . . . . . ; . - MVD (25.4 nun cosine) As' ; jet ~ oL ~ ~ ~, - 1 0.001 0.01 0.1 1 10 Spatial frequency (cycles/ft) Figure 97. Sensitivity of MVD and TRS to spatial frequency (Darlington 1995). 0.1 for wavelengths between 2 and 30 ft (0.61 and 9.1 m). This indicates that the MVD statistic reacts to wavelengths In Me range where drivers typically react negatively. Also shown in figure 97 is the TRS statistic normalized to the most typical value of 25. As win MVD, Me TES statistic reacts to wavelengths from 2 to 30 ft (0.61 to 9.1 m). The developers of the TRS statistic believe there is a sensitivity to localized profile distortions and a heavier weighting on large distortions Mat make this a powerful statistic. Possibly, Even the range of wavelengths that the TRS reacts to, the statistic will relate well win user response. However, there is no current information that relates TRS to user response. Also, Me algorithm used in the TRS calculation is not based on signal theory and is computationally intensive. Because the I-ft (0.305-m) data spacing precludes accurately measuring surface profile wavelengths less than 2 it (0.61 m), TRS does not respond to this small portion of Me short surface wavelengths believed to affect rider comfort. Better correlation with user response than the IR! or RN is not expected from Me TRS index. 179
Profile-Based Indices Filtered and Weighted While the RARV, IRI, and RNsayers pavement smoothness indices use a quarter-car model for filtering the surface profile, another filtering method in use is completed by separating and weighting the waveband spectra Mat make up Me roadway surface. Major indices in this category Include the Michigan DOT Ride Quality Index (RQI), the Janoff Ride Number (RNJano8), the Sp angler Ride Number (RNSpang,er), the quarter car index-RMSVA (QIr), and Me Mays Meter output function of RMSVA (MO). Each of these is described in more detail below. Michigan DOT RQl One of the earliest efforts at profile filtering and weighting is reported by Darlington in Me early 1970s at Me Michigan DOT (Darl~ngton 1995). The Department used third-order analog or digital bandpass filters to Include only wavelengths between 2 and 50 ft (0.6 and 15.2 m), attenuating all other wavelengths. They then correlated each wavelength with user response. To simplify the calculation hey weighted wavelengths from 2 to 5 it (0.6 to I.5 m), 5 to 25 It (~.5 to 7.6 m), and 25 to 50 It (7.6 m to 15.2 m) with relative weightings of 9, 6, and 3, respectively, hereby placing more emphasis on the shorter wavelengths that correlated more win user response in their field evaluations (see figure 98). The current Michigan ride quality index (RQ1) is given by the following equation: RQl = 3.077 [n(VAR, x 108) + 6.154 Ln(VAR2 x 108) + 9.231 [n(VAR3 x 108) - 141.85 (13) VAR's I, 2, and 3 In equation 13 are variances for 50 to 25, 25 to 5, and 5 to 2 ft (15.2 to 7.6, 7.6 to I.5, and I.5 to 0.6 m) wavelengths, respectively. The factor 108 is a computational aid, and the variance is given by: VAR = [~,x2/N] - [~x/NJ2 where: x = amplitude, in. N = number of samples. (14) The correlation coefficient (R2) between user response and 1988 RQI for AC and PCC pavements was 0.81, win a standard deviation of 8 RQI units (Darlington 1995). A total of 63 raters was used In Me 1978 evaluation over 28 test sections for development of the RQl statistic. In an unpublished study, DarI~ngton reports that the R2 for ~ using data from the same 28 sections was 0.72, with a standard deviation of 9.6 in/ml (Darlington 1995~. The 1988 NCHRP Project 1-23 pavement roughness study in Michigan using 68 pavement sections found good correlations between RQl and user response for all measured surfaces in Michigan danoff 1988~. 180
8 7 6 ·_4 ~ Cal ~ 4 1 , , 1 1 1 1 1 1 1 1 1 1 1 1 1 1 1 1 1 1 1 1 1 1 1 1 1 1 1 1 l l 1 1 1 1 1 . 1 1 1 1 1 1 1 . _ I . 1 1 . ;-,.~. 1 1 1 1 1 1 1 l , I . 1 1 . 1 I 1 1 1 1 1 1 1 1 1 1 1 1 1 l 1 1 1 1 1 1 1 1 1 1 1 1 1 1 1 1 1 1 1 1 1 1 ~1 1 ~1 1 1 1 O.UU1 U.U1 0.1 1 10 Spatial frequency (cycles/ft) Figure 98. Sensitivity of RQI to spatial frequency (adapted from Darlington 1995). A study in Wisconsin using a magnitude estimation scale instead of the commonly used Weaver/AASHO scale found R2 values of 0.21 for the relationship between user response and the new RQl (Gary, Horowitz, and Ross 1988~. The results and conclusions of this study were described as unsupported by lanoff in the accompanying discussion. Table 43 includes a summary of these correlations. The new Michigan RQl appears to have used high-quality methods of signal processing, correlation, and data recluction. It is currently being used by the Michigan DOT In a dual specification with PI for new AC and PCC pavement construction. Profile measuring equipment capable of accurately measuring surface wavelengths from 2 to 50 ft (0.6 to 15.2 m) is required for this index. However, very little information about the Michigan DOT RQl development, testing, and performance of the RQl has been published. This makes it difficult to recommend the RQl statistic as a standard for national use. The methods used in computing this index-spectral analysis, correlation of wavebands with user response, bandpass filtering, and using the log function of the variance appear valid and are reproduced in part in the lanoff ride number URNS off), described next.
Table 43. Correlation of RQl with user response. .. .. No. of PCC No. of AC PCC AC All Types, l Reference I Sections I Sections I R2 I R2 I R2 l I Arlington 1995 (Michigan DOT 1 14 1 14 1 - 1 - 1 0.64 1978 study, Old RQI) _ Darlington 1995 (Michigan DOT 14 14 , _ 0.81 1988 study) New RQI) Janoff 1988 (New RQI) 27 21 0.83 0.90 0.86 Berg, Horowitz, and Ross 1988 l 11 1 21 | _ | _ I 0.21 (New RQI) ~. Jan off Ride Number (RNJanoff) The RNJar~off was developed under NCHRP 1-23 from 282 pavement sections in 5 States spanning a range from 0.4 to 4.5 on a O to 5 rideability scale danoff 1988). The RNJar~off is an approximation of the mean panel rating (MPR) using 156 participants. It is defined by the following relationship: RN = -1.47 - 2.851Oglo~pt~off) The P\moa iS defined as Me lanoff PI computed from Me square root of Me mean square of the profile height within Me frequency band range of 0.125 to 0.630 cycles/in (0.410 to 2.067 cycles/m). The NCHRP 1-23 stud based on data from a controlled study of sections in Ohio, Michigan, New Jersey, New Mexico, and Louisiana, determined Cat for all paved surfaces the longitudinal roughness measured using the frequency band of 0.125 to 0.630 cycles/ft (0.410 to 2.067 cycles/m) correlated well with MPR values, accounting for over SS percent of the variation Canon 1986~. Simply put, Me report indicates that highway users rate the rideability of a road based primarily on the amplitude of pavement surface wavelengths from I.6 to S.0 It (0.5 to 2.4 m) at 55 mi/hr (~S km/hr). This is similar to the primary weighting that Me RQl places on wavelengths from 2 to 5 it (0.6 to 1.5 m). The correlations win user response from this study are very good and are shown in table 44, along win the Spangler/Kelly Ride Number (RNSp=`g~er) correlations, a smoothness statistic that will be described shortly. Figure 99 illustrates the sensitivity of the Manor to spatial frequency. ,, (15) The Ptmoff has not reportedly been used by any highway agency for initial pavement smoothness control, but it is expected to be used by one highway department in 1997. Some questions about Me critical wavelength bands to be used in the filter, the varying correlations with PCC, and the methodology used in computation have led some researchers to reserve judgment regarding the Ptmoff (Sayers 1994~. Its use as a control index requires that Me profile measuring ~2
Table 44. Correlation of Janoff and Spangler/Kelly ride numbers with user response. Reference Janoff and Davit 1985 (RNJa,~off)' OH data Janoff 1988 (Rim off), AH data Janoff 1988 (1;tNJar~off), MI data Janoff 1988 (RN off), OH data Spangler and Kelly 1987 (RNSpangler) . 22 25 __ , 97 111 27 21 18 17 18 17 No. of PCC No. of AC PCC AC All Types, l Sections Sections R2 R2 R2 0.86 0.69 0.81 0.86 0.79 0.89 0.88 0.92 0.98 0.88 0.85 0.86 0.90 0.88 0.83 10 9 8 6 5 4 1 o 0.001 0.01 0.1 1 10 Spatial frequency (cycles/ft) Figure 99. Sensitivity of RNJar~off to spatial frequency (adapted from Sayers 1994). 183
equipment be capable of measuring surface profiles accurately within the spatial frequency range of 0.1114 to 0.7071 cycles/ft (0.366 to 2.322 cycles/m) Janoff and Hayhoe 1990; Hayhoe 1992). Spangler/Kelly Ride Number (RNSpangler) A simultaneous project funded by the Ohio DOT and led by Spangler and Kelly used the same data collected in the NCHRP 1-23 study in Ohio to develop another ride number (Spangler and Kelly 1987~. The pavement serviceability rating (PSR) correlation developed by this study indicated that: PSR = 4.54 - 20~56 x (PIsp~`g~er) The Pimp, is defined by the following equation: (16) (PISpar~g~er) = EMS x [S2/(S2+14S+100~] x P (17) where: RMS = Root-mean square. P = Measured pavement profile displacement amplitude, in. S = Complex operator, I/ft. The effect of this equation is to compute the root-mean square of We spatial acceleration (ft/ft2 or m/m2) of the measured pavement profile (P), where Me displacement amplitude of the measured pavement profile has been attenuated by a second-order, high-pass spatial filter with a spatial natural frequency of 10 ft (3 m) per cycle. Optimization of He correlation between profile and user response was accomplished by varying He spatial natural frequency cutoff level. Comparison of He RNSp~`g~er with user response yielded good correlation with AC and all pavement types combined, as shown previously In {able 44. Correlation for PCC and composite pavements was moderately good R2 = 0.79 and 0.85, respectively. The 1988 RN~`off transforms provided better correlations for the Ohio data than the RNSpang~er transforms, as table 44 indicates. A 1996 study indicates that the Sp angler/Kelly algorithm includes an error that causes a significant bias as a function of sample Interval (Sayers and Karamihas 1996~. QIr-Quarter-Car Simulation Used in Brazil Originally developed by Brazilian researchers using He quarter-car system, the Ql was replaced by the QIr at He 1982 IRRE (Sayers and Gillespie 1986~. The QIr is based on He root-mean squared vertical acceleration (RMSVA) summary statistic, although He computation procedure results In a statistic that is not actually related to vertical acceleration. Rather, RMSVA is equivalent to the RMS deviation at the midpoint of a roiling straightedge of length two times the baselength. This method squares the amplitude of He measured positive and negative vertical deviations in a road profile. To obtain the Q; statistic, the profile is processed to yield two RMSVA 184
values for baselengths of 3.3 and 7.6 it (: and 2.5 m). These values are then combined In the following relation: QIr ~ -8.54 + 6.17 x RMSVAlo + 19.38 x RMSVA25 (~) This relation assumes that elevation is measured In millimeters and that the baseleng~s (~.0 and 2.5) are measured In meters, resulting in RMSVA numerics with units of I/m x 10-3 (Sayers and Gillespie 1986~. Figure 100 illustrates the sensitivity of QIr to spatial frequency. Correlation with response from a small group of users at the IRRE on AC pavements yielded R2 values of 0.89 (Sayers and Gillespie 1986~. Ql also correlated very well with the TRI in the 1982 IRRE (Sayers, Gillespie, and Queiroz 1986~. The Qua transform approximates vertical acceleration within 10 percent for wavelengths greater than 4.3 it (14 m) (Sayers and Gillespie 1986~. QIr is not known to have been used as a summary statistic for Initial smoothness specifications. Mays Meler Oubput Function of RMSVA Another RMSVA-based roughness index estunates Me Mays Meter output (MO) ARS (in/mi) from the RMSVA of profiles in 4 and 16 ft (1.2 and 4.9 m) baselengths (Paterson 1987a). This index is defined by the following equation: o 0.001 0.01 0.1 1 10 Spatial frequency (cycles/ft) Figure 100. Sensitivity of QIr to spatial frequency (adapted from Sayers, Gillespie, and Queiroz 1986). 185
MO = 20 + 23(RMSVA12) + 58(RMSVA49) Unfortunately, no information is available regarding the relationship of MO with user response. However, its fair correlation with Mays Meter response (R2 = 0.82) suggests that its correlation with user response may be similar to that of the MEN (Hudson, Unpin, and Elkins 1987~. The reported correlation of MO with PI is 0.94, indicating that its user response may be more similar to that of a California profiIograph (Uddin, Hudson, and Elkins 1990~. Evaluation of Smoothness Indices (19) This section presents an evaluation of the smoothness indices previously discussed. The purpose of this evaluation is to ultimately identify the smoothness statistics that are most suitable for use in a smoothness specification. Identification of these statistics then provides a basis for defining the equipment characteristics and properties needed to measure initial pavement smoothness. Review of Kev Selection Factors To select a smoothness index from the large number of available statistics described previously, it is necessary to first define the factors necessary for a good initial pavement smoothness statistic. Foremost among these factors is correlation win user response for AC and PCC pavements, but He ability to correlate the statistic with other statistics and the ability to correlate win current smoothness statistics so that specification Innits can be easily developed are also considered critical In He selection process. In addition, He information available from past experience will make an Index more desirable. The Importance of these factors is discussed below. Correlation With User Response Although a large number of pavement roughness indices have been developed, those that have remained In use over He years have had one common characteristic" Hey were thought to relate well win the option of roadway users regarding He rideability of He roadway surface. For example, the BPR and PCA statistics fall into the category of roughness measures that did not correlate well with user response, and these statistics are now rarely used. The Mays Ride Number is in the process of being replaced by statistics that correlate better with user response; some reported weakness In He correlation of the PI statistic with user response is weakening its position as the index of choice for new pavement smoothness control. In determining He level of correlation win rider response for each of the statistics evaluated In this study, the R2 values noted in the previous section were reviewed. Because PCC pavements generally contain shorter wavelength roughness components Han AC pavements, and because different indices react differently to different wavelengths, He correlation of indices with user response varies with pavement type. ~6
To account for these differences In response to pavement type, the R2 of indices for each pavement type were evaluated. Those R2 values that were products of the most reliable studies were selected for defining the correlation with rider response of each statistic. However, the range of roughness for these studies was generally greater than that typically found in new construction. Very few studies focus on the narrow range of initial pavement smoothness. No information on correlation with user response was available for the SV and MO statistics, and estimates of the correlation were used for rating these pavement indices. Correlation With Other Smoothness Statistics SHAs currently use a variety of indices for defining initial pavement smoothness. If changes in the plenary smoothness inclex are desired, it is critical that reliable correlations be available between the ~rutial smoothness index in use and He selected initial smoothness Index. In particular, a standard initial smoothness Index should be able to correlate with the Pl. To correlate with pavement management indices, the selected ~rutial smoothness index should also correlate well with ~ because of its widespread use. Over the past few years, several research studies have developed correlation equations between various smoothness indices. A summary of some of these correlations is provided in table 45, along with the R2 correlation (when available). , Information Availability To complete the development of initial smoothness specifications, answers must be available to such questions as: What are the appropriate levels of required smoothness? Should smoothness testing be conducted in one or bow wheelpaths? How many repeat runs are necessary to provide the desired accuracy? The statistic must also permit the highway agency and contractor to identify must-grind locations, so information about this capability must be available. Also, if a highway agency has experience with using the specification in new construction smoothness control, it will be useful to know of any difficulties or legal problems encountered. Much of this information is gained as highway departments gain experience with individual specification Indices. Although not critical, the usage of the selected index In current specifications and the availability of Information about its smoothness levels and repeatability are desirable. Selection of Smoothness Indices - Each of the factors clescribed above is, in some measure, critical to the selection of a smoothness statistic. To define which of the smoothness statistics best meets the requirements of these factors, a ranking approach was followed in which each smoothness statistic was rated according to its ability to meet the evaluation criteria. Furthermore, because each criterion was not perceived to have the same level of importance, each was assigned a weighting factor. ~7
AL - ~ o o O. ~11 ~ lo: ~ ~ - ~ ~ Hi o. =E ~ ~ in ~ to rat ~ in ~ 11 ~ - ~ ~ - + + o o e ~ Hi ~ ~ ID ~ Aft l ~ | ~ ~ ~ ~ ~ ~ R to ll$ m ll - is -i or or ~ ll~ 11 ~ ~ ~ .r 1 1 1 ~4 Cog ~ A 11 At gad ll ~ ~- .~. .. ~ or vl ~ ~ ~ ~ ·_ 2 ~ _ o U.) ~ =' O ~ ~ =0 ~ + +) +.f ~ ~ E ~ =. ~ _ . _ ~ ~ ~ -' ~' Ul) mt! ~ I o E| $ D, R 7 U] O o 0 11 11 11 11 Z _ _ ~ _ _ g _ ._ E ° ~ ~ 9 _ ^ 3 c~ E ~ ~ ~ E D ~ E ~ iI 9 ~- 1 1 1 188 1 l 1 _ r 1 1 1 1 1 1 1 l ~i = oo cr. .E 01 + ~ ~ o.S~ 11' 11 ',, E- so _ _ 1 1 :
an an v) uO be o a; an cq o · - o i Sl~:,~; ~ r: ran ~ ~ L - ~ ~ 1'~1 8-~8 , , 1 , 1 1 1 1~ ~ 1'¢ 1 z 1'~ 1~1 ~ ~zilotlz-1~1~1~11 189
Table 46 lists the statistics and their perceived ranking with regard to the evaluation criteria. The rankings listed in this table are based on the information listecI above. Guidelines used In the determination of the ranking of each criterion are listed In table 47. Based on the results shown In table 46, five statistics stand out as good candidates for use as an Crucial pavement smoothness index. Top scoring indices are the TRI and PI statistics, followed closely by the RN developed by Sayers (RNsayers) (Sayers and Karamihas 1996), the Michigan DOT RQI (Darlington 1995), and the RN developed by Janoff (RNJa7,off) Janoff 1988). Correlation (R2) of TR! win user response for AC pavements is excellent and for PCC pavements is fair, based on several reputable shldies using a range of pavement roughnesses. Although for all pavement types combined, {RI does not correlate as well win user response ~ R2 ~ 0.65 to 0.70), its correlation with panel ratings using data from Minnesota for all pavement types was reported as 0.89 (Sayers and Karamihas 1996~. The IRI is currently used as an index of initial pavement smoothness In Minnesota. For PCC surfaces, the reported correlation of PI with PST was moderate, and correlation for AC pavements is estimated to be slightly beUer, because Me PI responds to a long-wavelength range similar to the Ad. Table 46. Evaluation of pavement roughness measuring Indices. Criterion (see table 47) || A | B | C | D | Weighted || Weighted Value of Each Criterion 5 5 4 4 Score Rank Index Description l Sayers Ride Number (RN-Sayers) r Michigan DOT Ride Quality Index (RQ1) . Janoff Ride Number (RN-Janoff) . Mays Ride Number (MRN) . Mays Meter RMSVA Output (MO) . Spangler/Kelly Ride Number (RN-S/K) Quarter Car Simulation (Qlrj Telescoped Rolling Straightedge (TRS) Slope Variance (SV)
Table 47. Guiclel~nes used for smoothness index rating. l Basis of ll I I l l Critenon | rating || Rating 1 | Rating 2 | Rating 3 | Rating 4 | Rating 5 | A. Correlation with rider 2 . 0.55 to 0.65 to 0.75 to l | respor~se for AC I R of best studies l | ~| 0.65 | 0.75 | 0.85 | 0.85 B. Correlahon with rider 05 0.55 o 0.65 o 0.75 o > 5 l | respo e for PCC | R2 of best studies | ~| 065 | 075 | 085 | 0.8 | l | C. Correlation with other | Ability: PI, MRM, 11 one I two I Free I four | > five |. roughness statistics IRI, RN, RQI, D. Information Info: vanability, availability | spec. limits ~poor ~fair ~ moderate ~good ~ excellent ~1~ [~- She ~ ~_Wll~l"~LlVlLO 1V1 L1L~ 1~sayer~ RQI' and RNJ=off are excellent for AC pavements (A 0.86) and good for PCC surfaces (A 0.81), based on reputable studies completed using NCHRP-furnished data. Of these three, Me RQl is the only one currently used in smoothness specifications for new PCC and AC pavements. Indices Cat are currently used for initial pavement smoothness control, the PI and the MRN, fell short in correlation with user response. Because of the long-stand~ng use of these indices, there are a large number of correlations developed between these indices and other roughness statistics. The correlations between PI and MRN with IRI are reportedly good, with R2 values ranging from 0.92 to 0.97. However, correlations of PI with MRN are not as good, with reported correlation coefficients (R2) between 0.57 to 0.94 (Scofield 1993~. Based on available information, no index of pavement smoothness stands out as the single statistic of choice. The TR] is well known In the pavement management arena but is a newcomer to the crucial smoothness control area. PI has been used for many years for initial smoothness quality control, resulting in improved control of pavement rideability. Reducing or eliminating the blanking band should make the PI more sensitive to the short wavelength oscillations that can occur In Me paving operation, thus resulting in better relation with user response. Since the PI statistic can be computed using inertial-based, higher-speed profile measurements, data collection, repeatability, and correlation with other smoothness indices can also be greatly improved by the new technology and appropriate models. 171~T 17~T VIA 12(~)T ~11 hears mr~t~nti~1 tic On ini4;~1 c~mnr~thn~ce ct:~tictir hilt Janoff, Sayers' ~` Len ~ art ~` ~ &~ ~ ~ ~ ~ ~ ~ ~ ~ - ~ ~ ~ &^ ~` - ~A LV~ ~ ~ &~ - ~ ~ ~ - ~` ~ ~ L have seen limited use. Because of Ignited data about He relationship of these indices win user response for new pavements and about He index levels required to provide smoothness levels equal to or better than current specifications, it will be difficult at this time to develop crucial smoothness specifications based on these statistics. A carefully planned correlation study of rider response to the roughness of new pavements measured by these indices would help to define appropriate specifications smoothness limits. In the absence of such a study, assistance from 191
I]MTRI, the Michigan DOT, and Jim Research (developers of the RNSaye~;, RQI, and RNJar~off, respectively) would be required to define these limits. Because of the lack of a proven replacement, the PI, notwithstanding its limitations previously described, should remain the current index of choice for PCC and AC pavements. However, it is recommended that the blanking band be eliminated and PI statistics be computed from surface profiles measured using inertial-based systems. Since the PI amplifies wavelengths that are not related to user response, and profiIograms do not provide accurate pavement profiles, measuring "true" profiles will permit State Agencies to concurrently study other indices that relate better with user response. The IRI provides another opportunity to develop a profile-basecl smoothness specification, although its correlation with user response is reportedly not better than the PI statistic. Correlations are available for developing required levels of roughness. To address He limited ability of the ~ statistic to differentiate between short and long wavelengths, it may be possible, with information from I:MTRI, to develop a mov~ng-average IR] specification. However, the window used for filtering these profiles must be chosen carefully, and rectangular filters should be avoided. Thus, the currently available information suggests that, for the immediate future, the PI fusing "true" profile modeling and a zero blaring band) should remam the primary index of pavement smoothness. An IRI-based smoothness specification will provide a cradl~to-grave statistic but is not expected to unprove the current PI correlation win user response. Additional study of the RN~;U,off, RNSayers' and RQl statistics is recommended to further improve the quality of initial pavement smoothness specifications. Information necessary for unplementation of such a specification Includes the correlation of each index win user response for each pavement type in the smoothness range typical of new pavements. Variability associated with profile measuring equipment, operators, cI~matological factors, profile filters, and sampling Intervals must all be evaluated for the Index most related to user response, to allow development of statistically based, performance-related smoothness specifications. To allow introduction of specifications using the Ad, RQI, or RN statistics, recommendations for equipment capabilities have been developed that are broad- based. This will provide measured pavement profiles that can be used to provide sufficient accuracy and breadth for use win all promising smoothness statistics. Profile Measuring Equipment Requirements Based on Selected Indices The primary Indices reconnnnended for potential use in initial s m oothness elm; ~ ~a +; ~ ~ PIT MAT Teal O~_l`~Ct~l=~, ~ A, 6~Janoff, $~saye=, RQI, and I~J have inherent characteristics that help to define He requirements of He equipment necessary to measure the pavement profiles needed for index computation. These characteristics include the pavement 192
wavelengths to which the index responds and the variability associated with the index. Using these characteristics, the requirements of construction quality control pavement profile measuring equipment can be defined; these requirements are described below. Measured Profile Wavelengths Because each primary index responds to slightly different pavement surface profile wavelengths, it is critical Cat equipment for measuring construction pavement smoothness be capable of accurately measuring surface profile ~ these wavelengths. These critical wavelengths reported In the literature are listed In table 48 for the primary indices Janoff 1986; Paterson 1987a; Scofield 1992; Darlington 1995; Sayers and Karamihas 1996~. To provide additional accuracy and capacity, these wavelength ranges have been modified slightly, accounting for gains greater than 0.l, and both are shown in table 48. It is evident from table 48 that equipment capable of accurately providing the primary smoothness indices must be able to accurately measure pavement surface wavelengths from 0.9 to Il0 It (0.27 to 33.5 m). Current equipment is capable of measuring wavelengths from 3 in (76.2 ~run) to 300 ft (91.4 m). ,Sampl~n~ Interval To measure the shorter wavelengths accurately. an anDroDriate sampling interval must be selected. -- -r - - -A The required sampling interval is defined by the minimum wavelength of interest. Shannon's Sampling Theorem indicates that the sampling interval needs to be at least two times the minimum wavelength of interest. The actual sampling rate required to recover the necessary signal frequencies is called Me Nyquist rate (Stanley, Dougherty, and Dougherty 1984~. If the Nyquist sampling rate is not attuned, a phenomenon known as "aliasing" results. This causes frequencies -a ~ - - - --r r - - r Table 48. Wavelengths measured by primary indices. ~. Index ~Source ~ Reported bandwidth ~ Moclified bandwidth Paterson 1987a 3.0 to 80 It Scof~eld 1992 I.0 to 75 ft RNsayers Sayers 1996 I.7 to 36 It RQl Darlington 1995 2.0 to 50 ft ~anoff ~JaIloff 1986 ~1.6 to ~ ft 2.! to I10 It 0.9 to 85 It l.: to 77 It 1.4 to 88 it I.2 to 10 ft ft = 0.305 m 193
to be mistaken for entirely differently frequencies upon signal reconstruction or recovery. A practical example of this phenomenon is the wagon wheel effect often noted In western movies. Because of an insufficient rate of film collection, long wavelengths are added to Me visible picture, resulting in the speed of the wheels appearing to slow and sometimes reverse as the wagon wheel rotation speed Increases (Scofield 1993~. The reason for requiring smaller sample intervals is to help to avoid abasing of the profile. Aliasing occurs when phantom long wavelengths are adcled to the profile because of an Insufficient sampling interval. DarI~ngton reports Cat if the phantom wavelengths are digitized before they are filtered from the profile, they will remain in the final profile (Darlington 1995~. As a result, the Michigan DOT collects eight samples per minimum wavelength of interest and uses short wavelength analog antialias~ng fitters on its profiles prior to digitizing it in its computers. The PRORUT system collects four samples per m~rumum necessary wavelength anct uses a low-pass (smoothing) filter set at about Oft (0.3 m) wavelength to provide antialiasing (Sayers 1990~. However, according to DarI~ngton and DeFrain at the Michigan DOT, Me moving average, smoothing filter does not sufficiently reduce the aliased effect. :~creasing Me sampling rate reportedly helps to reduce the aliasing phantom wavelengths. Table 48 indicates that the smallest wavelength of interest for the primary indices is 0.9 It or 11 in (0.27 m) in length. If an analog antialiasing filter is used bra the profile measuring equipment, a sampling interval of 2 In (50.S ~run) is reco~runended. If digital antialiasing filters are employed, a sampling interval of ~ in (25.4 man) shouIc} be used. It is interesting to note that profiIograph sampling rates are very near this range. For example, Me sampling rate for Me Cox CSS200 computerized profiIograph is 1.3 In (33 mm), and the sampling rate for the IPMC-McCracken computerized profiIograph is 1.22 in (Cox and Sons 1994; Noonan 1994~. Because current profile measuring equipment can measure pavement profile at intervals of ~ In (25.4 mm) or less, it is recommended that the sampling interval for the initial smoothness control equipment specification be I.0 in (25.4 mm), unless analog antialiasing filters are used. Distance Accuracy Longitudinal accuracy is necessary for defining must-grind locations and for correlating output from repeat passes over a pavement surface. A typical range of distance accuracy varies from 0.02 to 0.! percent for most high-speed profile measuring devices (Evans 1993~. The new FHWA LTPP profile measuring devices can measure longitudinal distances within 0.05 percent of the actual length, 0.5 ft/l,OOO It (0.15 m/305 m) (FHWA 1994b). Currently used profiIographs measure distances with about 0.10 percent error, that is, ~ It (0.3 m) per 1,000 It (305 m) (Noonan 1994~. Because He level of longitudinal measurement accuracy of profilograph equipment has not been noted as insufficient, and because current 194
technology is available to measure longitudinal profile lengths at high speeds with the same accuracy, a distance accuracy requirement of 0.! percent (1 ft/l,OOO it [0.3 m/305 m]) is recommended for the initial smoothness control equipment specification. This is consistent with the accuracy requirements for Class ~ equipment in ASTM E950-94. Vertical Elevation Accuracy The vertical elevation accuracy of a profiling system can be measured both statically and dynamically. Static accuracy determination is measured when the device is stationary and is Me accuracy method used for current profilograph systems. Accuracy requirements are generally made up of two components precision and bias (ASTM El77~. Precision is a measure of Me profile repeatability of one or more pieces of equipment using one or more operators. Bias is the deviation of the device from the true profile, as measured by the best available profile measuring method-typically either rod and level or Face Dipstick. The static accuracy method is used for the current profilographs with a required vertical measurement precision and bias of +0.02 in (0.51 mm) on 0.5-in (12.7-mm) and 1.5-in (38-mm) gage blocks (ASTM El274~. For the new FHWA LTPP profiling equipment, the required static precision and bias is +0.005 in (0.125 mm) at 95 percent reliability. ASTM E950 requires a vertical measurement resolution of <0.005 In (0.1 mm) for Class ~ measurement. Among commonly available high-speed profile measurement devices, the static precision and bias ranges from 0.002 to 0.012 In (0.05 to 0.3 mm). Because Me static accuracy of a profile measuring device is not as critical as the dynamic accuracy, it is recommended that the static accuracy required In the crucial smoothness control equipment specification be better than the required dynamic accuracy) but not unduly restrictive. This is the logic used In defining Me specifications for the FHWA LTPP profiling equipment. Therefore, a static accuracy (precision and bias) of 0.005 in (0.125 mm) is recommended. A measure of the dynamic accuracy of a pavement profile measuring device widen a specified range of wavelengths is much more difficult than that of static accuracy. However, it is necessary to identify inaccuracies in the hardware and software that may not be evident in static accuracy measurements. To quantify dynamic accuracy, repeat measurements must be made of pavement profiles through a range of new construction roughness, using care to eliminate the effects of horizontal wander, longitudinal positioning deviations, filtering variations, and data nror~.~in~ divergence. Such noint-bv-noint comparisons were performed bv rim o ~ ~ -I- A rim rat --- A--------- - A Sp angler, et al. (1990) for the Federal Aviation Administration (FAA). The reported average standard deviations for AC pavements from that study are listed In table 49 (Sp angler, Gerardi, and Yager 1990). 195
Table 49. FAA Bluegrass Parkway Profilometer~ evaluation results (Spangler, Gerardi, and Yager 1990~. . . Average Std. Deviation Average Absolute Bias Profiler (18 runs) (~S runs, 1,057 points) North-Central region 0.012 In (0.31 mm) 0.016 In (0.40 mm) ProfiIometer~ AZ ProfiIometer@-Laser 0.010 In (0.26 mm) 0.054 In (~.36 mm) AZ ProfiIometer~-Infrared ~0.019 in (0.49 mm) ~0.035 In (0.89 mm) Sp angler, Gerardi, and Yager (1990) tested Me K. I. Law mode! 690DNC ProfiIometer~ used by the FHWA Norm Central Region contractor on a 0.2-mi (0.3- km) section of the Bluegrass Parkway in Kentucky. That pavement was a relatively smooth AC surface and should be considered as a good site for obtaining repeatable profile measurements. Rod and level measurements were recorded at I-ft (0.305-m) Intervals. The method of profile analysis used for this equipment included moving averages and filtering of profile data from IS runs (Sp angler, Gerardi, and Yager 1990~. Prior to digitizing, the pavement profile was measured on An (25.4-mm) Intervals, averaged over ~ It (0.3 m), and recorded at 0.5-ft (0.152-m) intervals. During profile measurement, the profile was high-pass filtered using a third-order filter set at 300 ft (92 m). To adjust for phase shifting, the profile was later reverse filtered using Me same filter, resulting In a s~xth-order high-pass filter. The rod and level profile was "tipped" to remove the very long wavelengths. Then it was subjected to the same filtering as the ProfiIometer~ data received. ProfiIometer~ precision was determined using the standard deviation of Me elevations for IS runs at each ~ ft (0.3 m) interval. The average standard deviation was 0.012 in (0.31 mm), and the mean absolute bias between the average ProfiIometer~ elevations ant! the rod and level elevations was 0.016 In (0.40 mm) (Spangler, Gerardi, and Yager 1990~. Two other K. I. Law mode! 690DNC systems were also tested at this site, and me average standard deviations for those systems were about the same as the North Central Region ProfiIometer@. The average absolute bias for these systems was larger, as shown In table 49. Po~nt-by-point comparison statistics of repeated profiIograph traces are not available but are expected to be In the range of Me data reported by Sp angler, Gerardi, and Yager (1990~. ASTM E950-94 requires a maximum one-standard deviation precision of 0.015 in (0.38 mm) from at least 10 repeat runs to achieve Class ~ measurement status. In addition, to achieve Class ~ status, the average of the difference between the 196
measured elevation and a baseline elevation for 1,057 points spaced at I-ft (0.305-m) Intervals must not exceed 0.050 In (~.25 mm). Although the ASTM precision and bias requirements for Class ~ measurement are slightly less stringent than the Kentucky data indicate is feasible, it is recommended that the Class ~ ASTM E950 dynamic precision and bias requirements be followed in the development of specifications for initial smoothness measuring equipment. Other Considerations Several other attributes of the Initial smoothness measuring equipment that may not be specifically recommended In the specification, but that will nonetheless be useful, include minimal weight, higher speeds, ease of use, must-grind location capability, horizontal location accuracy control, rapid availability of survey data results, and automated calibration, data collection, filtering, and reporting. An understanding by the construction contractor of the newly constructed pavement smoothness level widen days or hours instead of widen weeks can improve road surface quality and result in savings to both the contractor and the owner agency. Lightweight surface measuring systems, like hose developed in Michigan and Texas, can assist Me contractor and Me State In early detection of profile roughness. Increased speed and automation In the data collection and analysis processes can also unprove cost-effectiveness of a quality control process. Because of the reported problems with PI variations along different wheelpaths, a device to ensure horizontal positioning could eliminate this random variability and unp rove repeatability. Finally, it remains unperative that a must-gr~nd location identification method be included in Me software of any system for measuring Initial construction surface profiles. None of the primary indices provide this capability inherently, and it will be necessary, as with the PI, to conduct a supplementary simulated straightedge analysis to identify locations that require grinding. The Michigan DOT reports that must-gr~nd areas determined using the 0.3 In (7.6 mm) criteria on profiles measured with their inertial profiler were about 33 percent of the areas determined based on profiIograms from simulated and actual profiIograph measurements. If must-grind specifications are based on inertial-based profiles, modifications of the grind [units may be necessary to maintain a high quality of Initial pavement smoothness. Summary This chapter has presented information on both smoothness-measur~ng equipment and smoothness indices. The various types of smoothness-measur~ng equipment are discussed, with a detailed review provided in appendix E. Various primary pavement smoothness indices were presented and reviewed In terms of their ability to correlate with user response, Weir ability to correlate with other smoothness statistics, and the availability of information for development of a specification. Ultimately, two smoothness indices were ranked highest according to those criteria: IRI and Pl. They were followed closely by three indices that show much better 197
correlation with user response but for which insufficient information is available to develop a working specification at this time (Michigan DOT RQI, Janoff Ride Number [~moff] and Sayers ode Number Sayer Based on the five indices, properties of the equipment recommended for use in modern smoothness construction specifications were identified. These properties include the ability to accurately measure pavement surface wavelengths from 0.9 to 110 ft (0.27 to 33.5 m) with a sampling intermural of ~ in (25.4 mm). The static accuracy (precision and bias) of this equipment should be +0.005 in (0.125 mm) at 95 percent reliability. The 10-sample, single operator, dynamic precision for the equipment should be 0.015 In (0.38 mm) at a confidence level of 95 percent within the wavelengths of 0.9 and Il0 it (0.27 to 33.5 m). The dynamic bias of the equipment, as compared to high-precision rod anc! level or Dipstick baseline profiles, should be no more than 0.05 In (~.25 mm), according to the procedures described In ASTM E950-94. A must-gr~nd location feature should also be Included In the software. Over attributes, such as m~nunizing weight, Increasing speed, controlling horizontal wander, and automating data collection, calibration, analysis, and reporting should also be encouraged. Table 50 summarizes these recommended properties of smoothness-measuring equipment. The movement toward adopting a new pavement profiling system will not happen overnight. Many of the current smoothness-measuring practices are deeply Ingrained within Me highway agencies and paving industries that make it Impractical to quickly move toward the adoption of new equipment and smoothness indices. Highway agencies and paving contractors have invested significant resources In the current systems, which in many cases are providing satisfactory results. However, in order to make significant improvements to the way that smoothness data are collected and reported, a slow and gradual movement toward profile-based systems appears warranted, and effective training programs will be necessary to fully mdoctr~nate such systems into the mainstream of data collection activities. . ~- ~. 198
Table 50. Summary of recommended properties for smoothness measuring equipment. 11 Property | Recommended Requirement . . Measured Profile Wavelengths 1.2 to 100 ft (0.37 to 30.5 m) up to 55 mi/hr (88 km/hr) 1 In (25.4 mm) if digital antialiasing used 2 in (51.8 mm) if analog antialiasing used Sampling Interval l . Distance Accuracy Vertical Elevation Accuracy Static Precision/Bias Dynamic Precision/Bias Over Considerations 0.1 percent +0.005 in/+0.005 in (0.125 mm/0.125 mm) +0.015 in/+0.05 in (0.38 mm/1.25 mm) Lightweight Rapid sampling speed Ease of use Identify must-grinds Horizontal positioriing Rapid availability of survey data results Automated calibration, analysis, reporting 199
MO = 20 + 23(RMSVA12) + 58(RMSVA49) Unfortunately, no information is available regarding the relationship of MO with user response. However, its fair correlation with Mays Meter response (R2 = 0.82) suggests that its correlation with user response may be similar to that of the MEN (Hudson, Unpin, and Elkins 1987~. The reported correlation of MO with PI is 0.94, indicating that its user response may be more similar to that of a California profiIograph (Uddin, Hudson, and Elkins 1990~. Evaluation of Smoothness Indices (19) This section presents an evaluation of the smoothness indices previously discussed. The purpose of this evaluation is to ultimately identify the smoothness statistics that are most suitable for use in a smoothness specification. Identification of these statistics then provides a basis for defining the equipment characteristics and properties needed to measure initial pavement smoothness. Review of Kev Selection Factors To select a smoothness index from the large number of available statistics described previously, it is necessary to first define the factors necessary for a good initial pavement smoothness statistic. Foremost among these factors is correlation win user response for AC and PCC pavements, but He ability to correlate the statistic with other statistics and the ability to correlate win current smoothness statistics so that specification Innits can be easily developed are also considered critical In He selection process. In addition, He information available from past experience will make an Index more desirable. The Importance of these factors is discussed below. Correlation With User Response Although a large number of pavement roughness indices have been developed, those that have remained In use over He years have had one common characteristic" Hey were thought to relate well win the option of roadway users regarding He rideability of He roadway surface. For example, the BPR and PCA statistics fall into the category of roughness measures that did not correlate well with user response, and these statistics are now rarely used. The Mays Ride Number is in the process of being replaced by statistics that correlate better with user response; some reported weakness In He correlation of the PI statistic with user response is weakening its position as the index of choice for new pavement smoothness control. In determining He level of correlation win rider response for each of the statistics evaluated In this study, the R2 values noted in the previous section were reviewed. Because PCC pavements generally contain shorter wavelength roughness components Han AC pavements, and because different indices react differently to different wavelengths, He correlation of indices with user response varies with pavement type. ~6
