National Academies Press: OpenBook

Recapitalizing the Navy: A Strategy for Managing the Infrastructure (1998)

Chapter: Appendix B: Analysis of Department of the Navy Funding Trends

« Previous: Appendix A: Admiral Johnson's Letter of Request
Suggested Citation:"Appendix B: Analysis of Department of the Navy Funding Trends." National Research Council. 1998. Recapitalizing the Navy: A Strategy for Managing the Infrastructure. Washington, DC: The National Academies Press. doi: 10.17226/6391.
×

Page 92

B
Analysis of Department of the Navy Funding Trends

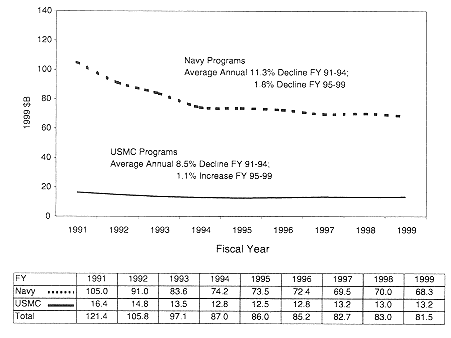
The overall Department of the Navy funding by Service is depicted in Figure B.1.1 It shows a significant decline in funding for both the Navy and the Marine Corps from FY 1991 through FY 1994 and then a leveling out through FY 1999.

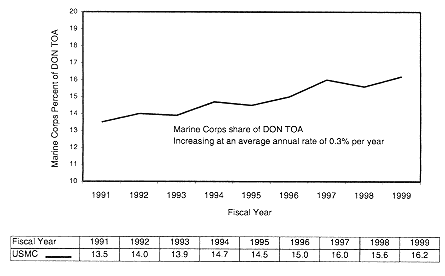
The Marine Corps share of the Department of the Navy budget has increased from 13.5 percent in FY 1991 to 16.2 percent in FY 1999 and continues to increase at an average rate of 0.3 percent per year, as shown in Figure B.2.

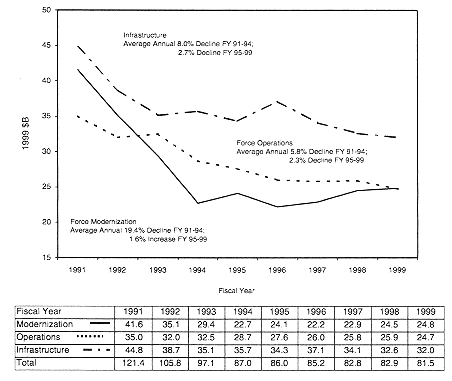
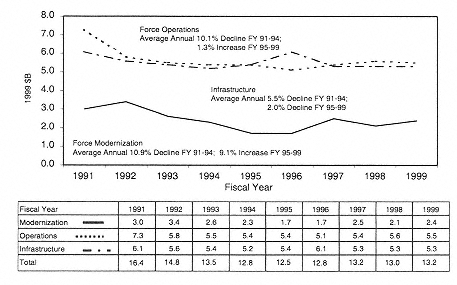
The funding for the overall Department of the Navy and for the two Services is depicted in Figures B.3, B.4, and B.5.

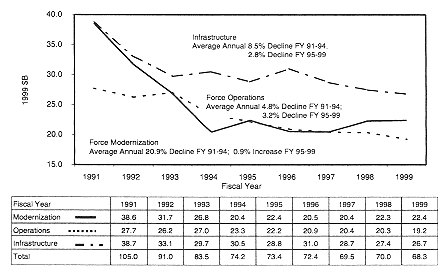
Department of the Navy funding was broken down into three categories: (1) infrastructure using the OSD (Program Analysis and Evaluation [PA&E] definitions of infrastructure; (2) force operations using the O&M and military personnel appropriations in the OSD (PA&E) definitions of forces; and (3) force modernization using the research, development, test, and evaluation (RDT&E), procurement, and military construction appropriations in the OSD (PA&E) definitions of forces.

In almost every case there is a clear difference in funding trends between FY 1991–1994 and FY 1995–1999. The funding trends appear to show that force modernization bore the brunt of the overall budget reductions and then recovered

1Unless otherwise noted, all data shown in this appendix are a result of the committee's use of FY 1999–2003: President's Budget Future Years Defense Programs. In addition, please note that all data are shown in constant FY 1999 budget dollars: FY 1991 through FY 1997 are actual obligations, FY 1998 is the current budget in execution, and FY 1999 is the President's budget currently being considered by Congress.

Suggested Citation:"Appendix B: Analysis of Department of the Navy Funding Trends." National Research Council. 1998. Recapitalizing the Navy: A Strategy for Managing the Infrastructure. Washington, DC: The National Academies Press. doi: 10.17226/6391.
×

Page 93

image

Figure B.1
Funding for Department of the Navy programs, 1991–1999.
image

Figure B.2
Marine Corps percentage of Department of the Navy (DON) total obligational
authority (TOA), 1991–1999.

Suggested Citation:"Appendix B: Analysis of Department of the Navy Funding Trends." National Research Council. 1998. Recapitalizing the Navy: A Strategy for Managing the Infrastructure. Washington, DC: The National Academies Press. doi: 10.17226/6391.
×

Page 94

image

Figure B.3
Funding for Department of the Navy programs, 1991–1999.
image

Figure B.4
Funding for U.S. Navy programs, 1991–1999.

Suggested Citation:"Appendix B: Analysis of Department of the Navy Funding Trends." National Research Council. 1998. Recapitalizing the Navy: A Strategy for Managing the Infrastructure. Washington, DC: The National Academies Press. doi: 10.17226/6391.
×

Page 95

image

Figure B.5
Funding for U.S. Marine Corps programs, 1991–1999.

slightly from FY 1995 to 1999. Navy programs follow a similar pattern, but the magnitude of the reductions is somewhat greater and is depicted in Figure B.4. Marine Corps (USMC) programs have smaller declines and larger increases and are depicted in Figure B.5.

Table B.1 depicts the results of an analysis to determine if and to what extent there were resource transfers between programs and Services during the period between FY 1991 and FY 1999. The first column lists the categories; the second column is FY 1991 funding in billions of FY 1999 dollars; the third column is FY 1999 funding in billions of dollars; the fourth column shows the reduction in funding from FY 1991 to FY 1999; the fifth column lists the percent reduction by category from FY 1991 to FY 1999; the sixth column indicates the FY 1999 funding that would have occurred if each category were reduced by the same Navy Department overall percentage; and the seventh and last column represents the difference between actual FY 1999 funding and the normalized FY 1999 funding. This last column indicates the degree to which a category had funding transferred either into it (a positive number) or out of it (a negative value).

This analysis shows that Navy modernization was the bill payer for the overall Navy Department budget reductions and resulted in an excess $3.5 billion reduction that must be recouped from other programs in order to reestablish the former funding relationships of about a decade ago and continue capitalization of the Navy. If Navy modernization requirements exceed the former share

Suggested Citation:"Appendix B: Analysis of Department of the Navy Funding Trends." National Research Council. 1998. Recapitalizing the Navy: A Strategy for Managing the Infrastructure. Washington, DC: The National Academies Press. doi: 10.17226/6391.
×

Page 96

TABLE B.1 Resource Transfers Between Programs and Services (in billions of FY 1999 dollars)


FY 1991 to FY 1999


Category

FY 1991

FY 1999

Reduction in Funding

Percent Change

Normalized FY 1999

Transfer

Department of the Navy


Modernization

$41.6

$24.8

$16.8

40

$27.9

-$3.1

Operations

$35.0

$24.7

$10.4

30

$23.5

$1.2

Infrastructure

$44.8

$32.0

$12.9

29

$30.0

$1.9

Total

$121.4

$81.5

$40.0

33

$81.5

$0.0

Navy


Modernization

$38.6

$22.4

$16.2

42

$25.9

-$3.5

Operations

$27.7

$19.2

$8.5

31

$18.6

$0.6

Infrastructure

$38.7

$26.7

$12.0

31

$25.9

$0.7

Total

$105.0

$68.3

$36.7

35

$70.4

-$2.1

USMC


Modernization

$3.0

$2.4

$0.6

20

$2.0

$0.4

Operations

$7.3

$5.5

$1.8

25

$4.9

$0.6

Infrastructure

$6.1

$5.3

$0.8

14

$4.1

$1.2

Total

$16.4

$13.2

$3.3

20

$11.0

$2.1

NOTE: Totals may not add due to rounding.

of the Navy Department budget or it is necessary to continue to increase the Marine Corps share of the budget, the $3.5 billion figure must be adjusted upward accordingly.

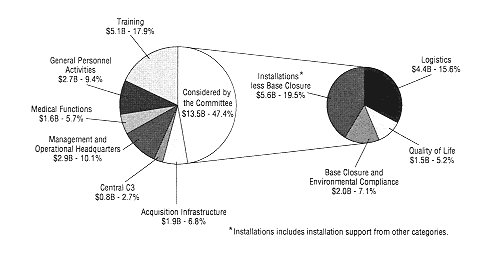
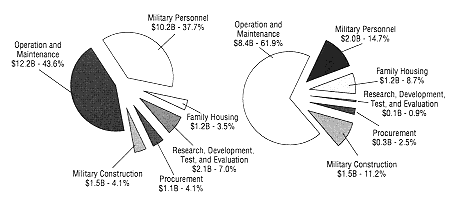
For the reasons articulated in Chapter 1, the committee focused its review on the approximate half of the Navy infrastructure that is more closely associated with the N4 organization (i.e., those portions of the infrastructure concentrated on base closure and environmental compliance, installations (less base closure), central logistics, and quality of life). The total Navy infrastructure and the portion initially considered by the committee are depicted in Figure B.6.

The committee also looked at infrastructure by appropriation since different offices in OSD and different committees in Congress review different parts of the budget by appropriation. Not surprisingly, the O&M account and the MPN account make up the majority of the funding for infrastructure. This result is displayed in Figure B.7 for both the total infrastructure and the portion reviewed by the committee.

Suggested Citation:"Appendix B: Analysis of Department of the Navy Funding Trends." National Research Council. 1998. Recapitalizing the Navy: A Strategy for Managing the Infrastructure. Washington, DC: The National Academies Press. doi: 10.17226/6391.
×

Page 97

image

Figure B.6
Navy infrastructure by functional categories initially considered by the committee.
Data shown are average values from FY 1995 to FY 1999.
image

Figure B.7
Navy infrastructure by appropriation initially considered by the committee. Data
shown are average values from FY 1995 to FY 1999.

Suggested Citation:"Appendix B: Analysis of Department of the Navy Funding Trends." National Research Council. 1998. Recapitalizing the Navy: A Strategy for Managing the Infrastructure. Washington, DC: The National Academies Press. doi: 10.17226/6391.
×
Page 92
Suggested Citation:"Appendix B: Analysis of Department of the Navy Funding Trends." National Research Council. 1998. Recapitalizing the Navy: A Strategy for Managing the Infrastructure. Washington, DC: The National Academies Press. doi: 10.17226/6391.
×
Page 93
Suggested Citation:"Appendix B: Analysis of Department of the Navy Funding Trends." National Research Council. 1998. Recapitalizing the Navy: A Strategy for Managing the Infrastructure. Washington, DC: The National Academies Press. doi: 10.17226/6391.
×
Page 94
Suggested Citation:"Appendix B: Analysis of Department of the Navy Funding Trends." National Research Council. 1998. Recapitalizing the Navy: A Strategy for Managing the Infrastructure. Washington, DC: The National Academies Press. doi: 10.17226/6391.
×
Page 95
Suggested Citation:"Appendix B: Analysis of Department of the Navy Funding Trends." National Research Council. 1998. Recapitalizing the Navy: A Strategy for Managing the Infrastructure. Washington, DC: The National Academies Press. doi: 10.17226/6391.
×
Page 96
Suggested Citation:"Appendix B: Analysis of Department of the Navy Funding Trends." National Research Council. 1998. Recapitalizing the Navy: A Strategy for Managing the Infrastructure. Washington, DC: The National Academies Press. doi: 10.17226/6391.
×
Page 97
Next: Appendix C: Developing Output Measures »
Recapitalizing the Navy: A Strategy for Managing the Infrastructure Get This Book
×
 Recapitalizing the Navy: A Strategy for Managing the Infrastructure
Buy Paperback | $64.00
MyNAP members save 10% online.
Login or Register to save!
Download Free PDF

READ FREE ONLINE

  1. ×

    Welcome to OpenBook!

    You're looking at OpenBook, NAP.edu's online reading room since 1999. Based on feedback from you, our users, we've made some improvements that make it easier than ever to read thousands of publications on our website.

    Do you want to take a quick tour of the OpenBook's features?

    No Thanks Take a Tour »
  2. ×

    Show this book's table of contents, where you can jump to any chapter by name.

    « Back Next »
  3. ×

    ...or use these buttons to go back to the previous chapter or skip to the next one.

    « Back Next »
  4. ×

    Jump up to the previous page or down to the next one. Also, you can type in a page number and press Enter to go directly to that page in the book.

    « Back Next »
  5. ×

    Switch between the Original Pages, where you can read the report as it appeared in print, and Text Pages for the web version, where you can highlight and search the text.

    « Back Next »
  6. ×

    To search the entire text of this book, type in your search term here and press Enter.

    « Back Next »
  7. ×

    Share a link to this book page on your preferred social network or via email.

    « Back Next »
  8. ×

    View our suggested citation for this chapter.

    « Back Next »
  9. ×

    Ready to take your reading offline? Click here to buy this book in print or download it as a free PDF, if available.

    « Back Next »
Stay Connected!