
2
The Cancer Care ''System''
There is no national cancer care program or system of care in the United States. Like other chronic illnesses, efforts to diagnose and treat cancer are centered on individual physicians, health plans, and cancer care centers. The authority to organize, coordinate, and improve cancer care services rests largely with service providers and insurers, although employers and other payers are increasingly holding providers accountable for quality, and consumers are calling for action by state and federal legislatures. Nevertheless, there is a federal research and programmatic infrastructure that greatly affects the quality of cancer care obtained within the U.S. health care system. This chapter describes:
- elements of the federal cancer care effort;
- elements of cancer care: who gets care, what services are provided, who provides care, where it is provided, and at what cost; and
- aspects of health care organization and financing that affect cancer care.
Elements of the Federal Cancer Care Effort
Although there is no national cancer care system, substantial public investments in research, training, prevention, and information dissemination have been made in an attempt to improve cancer care in the United States. The federal infrastructure is larger and more complex than that for other medical conditions. Since the "War on Cancer" was launched in 1971, a large share of federal medical research funding has been invested at the National Cancer Institute (NCI) to understand the underlying mechanisms of cancer, to evaluate progress against cancer through surveillance, to test promising diagnostic and treatment modalities, and to make information on how to prevent, treat, and live with cancer available to health care providers and to the public. At the Centers for Disease Control and Prevention, ongoing efforts to reduce the burden of cancer
include providing cancer screening to low-income populations and monitoring the achievement of cancer-related public health goals (see Chapter 6). Elsewhere in the federal government, the Agency for Health Care Policy and Research disseminates information about clinical practice guidelines to health providers and supports health services research aimed at understanding the links between the organization and delivery of health care and the resulting health outcomes (see Chapter 7). The federal Health Care Financing Administration (HCFA), as the nation's largest payer for health care, has established quality assurance programs targeting cancer care and is developing tools to more effectively monitor the quality of cancer care delivered to Medicare beneficiaries (see Chapter 6).
Although there are numerous sites within the federal government whose programs and research directly relate to the quality of cancer care, there is no system in place to coordinate these efforts. This has not always been the case. Although the effort failed, an attempt was made during the 1970s to coordinate federal and private cancer research programs through the National Cancer Program.
The 1971 War on Cancer Act (P.L. 92-218) created a National Cancer Program, headed by the director of the NCI to coordinate both federal and private cancer research programs (McGeary, 1997). The National Cancer Program concept saw NCI as primarily a research agency that was also involved in translating research into applications to improve prevention, diagnosis, treatment, and rehabilitation efforts. The National Cancer Program was not supposed to become the cancer care system, but it was supposed to interact enough with the system through planning and coordination to improve the delivery of patient care. These broader coordination and planning goals that should have extended the reach of the National Cancer Program beyond NCI to other federal and private parties could not be met, and when the 1971 act was recodified in 1978, the scope of the program was redefined to include only NCI (McGeary, 1997).
Cancer care is often provided as part of research initiatives; consequently, the current National Cancer Program intersects with the health care delivery system. The majority of children with cancer, for example, fall within an NCI-sponsored system of care because they are participants in NCI-sponsored research protocols (Simone and Lyons, in press). Furthermore, a system of NCI-funded cancer centers extends research opportunities to community hospitals throughout the country. Nevertheless, most cancer care services are provided by hospitals and centers falling outside the purview of the National Cancer Program, and there is no national effort to coordinate the disparate federal efforts related to the quality of cancer care.
The lack of national coordination in cancer-fighting efforts in the public, private, and voluntary sectors is a problem that hinders progress against cancer, according to the findings of the NCI-appointed National Cancer Advisory Board (NCAB) in their review of the National Cancer Program in the early 1990s (NCAB, 1994). In its final report, the NCAB recommended that the National Cancer Program should extend "beyond research to its application to the people and include all non-research, non-governmental, and community constituents whose actions impact the cancer problems" (NCAB, 1994). To date, the legislative authority to have the National Cancer Program coordinate federal and nonfederal cancer programs has not been reinstated (McGeary, 1997).
Elements of Cancer Care
Individuals Receiving Cancer Care
In 1999, more than 8 million Americans, or 3 percent of the population, will require some form of care because of a diagnosis of cancer: 1.2 million of these individuals will be newly diagnosed this year and initiate treatment; some, diagnosed in previous years, will continue treatment; others, who have been successfully treated and no longer have evidence of cancer, will require follow-up; and over 500,000 people will die from cancer (ACS, 1999; Ries et al., 1997). Even larger numbers of adults in the United States will have been screened for cancer.
Cancer is characterized by abnormal cell growth, but it is really more than 100 different diseases, each with a unique profile of population at risk, symptoms, effective treatments, and prognosis. Some cancers are extremely rare, but relatively few cancer sites account for more than half (54 percent) of all new cases of cancer: prostate; breast; lung and bronchus; and colon and rectum (Table 2.1) (ACS, 1999).
Cancer most often strikes after middle age. Six of ten new cancer cases occur among those age 65 and older (Ries et al., 1997). With the aging of the "baby-boom" cohort, the number of new cancers diagnosed annually in the United States among the elderly is projected to more than double by the year 2030 (Polednak, 1994). Roughly four of ten new cases of cancer occur among working-age adults who often must meet the demands of supporting and raising a family while undergoing treatment. In terms of potential years of life lost, lost productivity, and lost earnings, cancer that strikes at younger ages has graver consequences than cancers that affect the elderly. Cancer among children is rare (e.g., 14.2 cases per 100,000 infants and children up to age 14 in 1993-1994) (NCI, 1998a); however, with the success of treating cancer in childhood, estimates are that 1 in 1,000 people reaching adulthood is a cured survivor of childhood cancer (NCI, 1997).
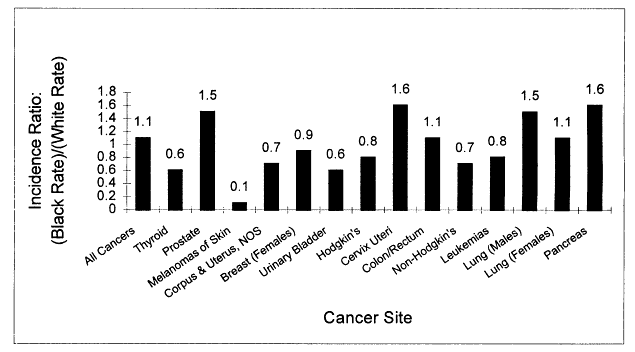
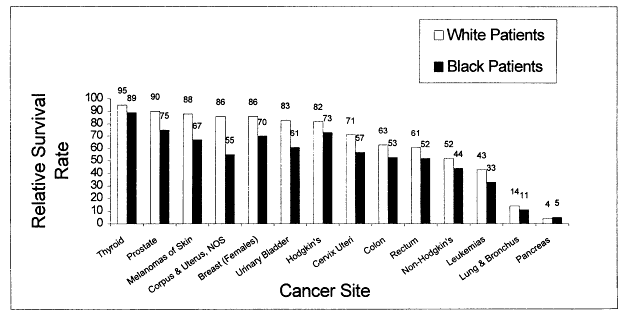
Cancer disproportionately affects the African-American community. Cancer incidence rates are higher for several sites, and once cancer is diagnosed, survival is poorer (Figures 2.1 and 2.2). Limitations in access to health care explain some, but not all, of these differences (see Chapter 3).
Slightly more men than women are diagnosed with cancer each year, but as women succumb to the effects of increased rates of smoking over the past two decades, they are becoming more equally represented among those with cancer (ACS, 1999).
TABLE 2.1
Estimated Number and Distribution of New Cancer Cases, United States, 1999
|
|
Estimated No. |
Distribution (%) |
|
All Sites |
1,221,800 |
100.0 |
|
Prostate |
179,300 |
14.7 |
|
Female breast |
175,000 |
14.3 |
|
Lung and bronchus |
171,600 |
14.0 |
|
Colon and rectum |
129,400 |
10.6 |
|
All other sites |
566,500 |
46.4 |
|
SOURCE: ACS, 1999. |
||
Trajectory of Cancer Care
The continuum of cancer care spans prevention, early detection and screening, diagnosis and treatment of new cancer cases, care of survivors, palliative care, and finally, support for terminally ill patients and their families (Mandelblatt et al., 1998). In this section, phases of cancer care are described beginning with early detection and screening. Primary prevention (efforts to prevent the occurrence cancer) is outside the scope of this report. (Much of this section is adapted from Ganz, 1996.)
Early Detection and Screening
The goals of early detection and screening are to identify cancers before they invade nearby tissue or spread to new sites. Visual examination of the colon using a colonoscope, for example, can find polyps that can be removed before they turn into invasive tumors. Other common screening and early detection methods are mammography, testing for bleeding in the digestive tract, Pap smears of the cervix, blood tests for prostate-specific proteins, and examination of the skin surface. Early detection of cancer is also influenced by attention to symptoms of cancer (e.g., blood in stool, lump in breast) and prompt follow-up. Once cancer is detected by screening or because of symptoms, the diagnostic evaluation phase of cancer management begins.
Diagnostic Evaluation
When a cancer screening test is positive or symptoms lead to its detection, further examinations are conducted to confirm the diagnosis and make it more precise. Pathologists attempt to identify the type of cell causing the cancer and may try to identify prognostic factors from a biopsy or tumor removed surgically to judge whether the cancer is fast growing or slow growing. Breast cancer tissue, for example, is usually examined for the presence of hormone receptors. If the receptors are present, therapy with hormone-blocking drugs may be prescribed to prevent a recurrence. Results of diagnostic and prognostic tests may be reviewed by a team of specialists as a decision is made on the first approach to treatment. Most newly diagnosed cancer patients go through a series of staging tests, including blood tests, x-rays, and various types of scans, to determine the extent of the disease. Initial planning is unusually important for many types of cancer, because choice of the first treatment severely limits subsequent treatment options due to the nature of cancer progression.
Primary and Adjuvant Treatment
Traditionally, most cancers have been treated with surgery, radiation, chemotherapy, or some combination of the three. Surgery has the longest history and is the mainstay of primary treatment for solid tumors (i.e., most cancers other than leukemias and lymphomas). For cancers
that have not yet metastasized to distant sites, surgery is often curative, particularly for tumors that are completely localized.
Radiation is the primary treatment for some cancers (e.g., Hodgkin's disease and other lymphomas), but more often, it is used in conjunction with surgery. As an adjuvant to surgery, it is used to destroy remaining cancer cells in and around the site of the primary cancer. It is particularly important, for instance, as an adjunct to lumpectomy for women with early-stage breast cancer and has been demonstrated definitively in randomized trials to reduce the likelihood of a local recurrence. In some cases, radiation is used to shrink the size of a tumor before surgery or in late stages of disease to offer symptom relief by shrinking growths that interfere with eating, breathing, or other functions.
Chemotherapy (including hormone therapy) may be used alone to treat some cancers (e.g., some lymphomas and leukemias), but it is more often used in combination with radiation and surgery. If cancer is found at diagnosis to have spread from its original site (i.e., metastasized), the only potentially curative treatment option is chemotherapy, which can reach cancerous cells around the body. In most cases, patients begin an extended course of chemotherapy, which may last months, after surgery. Like radiation, it may also be used as "neoadjuvant therapy," given before a tumor is surgically removed, with the intent of shrinking the tumor.
With most forms of cancer, higher doses of chemotherapy and radiation are more effective, but they also cause more damage to healthy tissue. The bone marrow (from which most elements of the blood are continuously formed) is particularly sensitive to chemotherapeutic agents and radiation, and doses high enough to control cancer can easily wipe out the bone marrow, killing the patient as well. Over the past decade, oncologists have increasingly used a controversial strategy that employs high-dose chemotherapy and/or radiation treatment in conjunction with autologous bone marrow transplantation, in which patients have some bone marrow removed and stored before they are treated. After treatment, the stored bone marrow cells are reinfused into the patient to repopulate the bone marrow and begin producing blood cells. Bone marrow transplantation using marrow from healthy donors ("allogeneic transplantation") is established as a primary treatment for some leukemias and lymphomas—diseases in which the cancer has arisen in the blood elements themselves—but autologous transplantation still remains of unknown value for the treatment of solid tumors.
Other types of treatment use the body's own immune system to resist disease or invasions. Agents known as biologic response modifiers, which are derived from or modeled on the body's own natural products (e.g., interferon, the interleukins, tumor necrosis factor) are being used in cancer treatment, generally in combination with other treatments.
For most cancers, the majority of physicians and researchers have agreed on one or more "standard treatment approaches"—usually based on research findings, a consensus of expert opinion, or both. Doctors may have different opinions about how to treat some cancers because definitive evidence on what treatment works best (if there are any effective treatments) is not available.
In a few cases, treatments that appear to be of equal effectiveness, but have different implications for quality of life, are available (e.g., watchful waiting versus surgery for some prostate cancers). In these situations, patient preferences often determine the choice of treatment. Patient-centered care is care that incorporates respect for patients' values and preferences, provides information in clear and understandable terms, promotes autonomy in decision making, and attends to the need for physical comfort and emotional support.
Much of cancer treatment involves managing cancer symptoms, including pain and the side effects of cancer treatment. The latter may include fatigue; problems related to nutrition and eating (e.g., loss of appetite, nausea and vomiting); hair loss; neurotoxicity (e.g., damage to nerve cells, causing numbness or tingling in hands and feet); loss of concentration; psychological distress; sexual problems; and infertility. Some effects of cancer treatment are short-lived (e.g., hair loss, nausea), but others are permanent (e.g., increased susceptibility to infection after removal of the spleen, infertility after certain chemotherapy drugs). Likewise, some treatment side effects are immediate (e.g., hair loss), whereas others may arise only after a substantial delay (e.g., congestive heart failure many years after anthracycline chemotherapy, leukemia secondary to alkylating agents or radiation therapy). Information about the long-term side effects of treatment on important organs, such as the heart and lungs, is becoming more available.
Cancer patients in the United States have long been interested in treatments not traditionally offered as part of mainstream medicine. The incorporation of some alternative or complementary approaches as adjuncts to conventional treatments is a direct result of patients' desires for better cancer treatment, both curative and palliative, and generally for treatment that leaves them with a better quality of life than they might otherwise expect (Box 2.1).
|
BOX 2.1 Alternative or Complementary Cancer Treatments Certain approaches to pain relief and coping (e.g., guided imagery, acupuncture, therapeutic touch) are increasingly being offered in mainstream cancer centers alongside conventional treatment. Other alternative approaches such as combinations of unknown drugs and chemicals given with the promise of cure fall squarely outside what mainstream medicine accepts, and patients may go to clinics inside and outside the United States to obtain them. Among the more popular alternative or complementary approaches are the following:
Patients may use mind-body approaches, in particular, throughout the course of cancer treatment (and survivorship)—for example, to alleviate the side effects of chemotherapy, to improve their psychological state, and to increase their energy levels. Some of these techniques have been studied and have been shown objectively to benefit patients, although this cannot be said for each approach or claim of benefit. At present, there is little evidence available for judging which, if any, alternative treatments are actually beneficial, particularly in terms of improved survival and, in some cases, safety. It is reasonable to assume, however, that patient interest will continue to maintain a focus on these treatments and that the government will continue its modest efforts to foster reliable evaluations of them. |
Posttreatment Surveillance and Follow-Up Care
The follow-up care phase of treatment is the time after completion of the initial course of therapy. Life-long follow-up is necessary to identify problems following cancer treatment, such as new cancers or recurrence of the same cancer.
Treatment of Recurrent Cancer
Cancer may recur in the same part of the body in which it was found originally (a local recurrence), or it may reappear in a more distant part of the body (a metastasis). The type of treatment that is selected for a recurring cancer depends on the specific type of cancer, how large it is, how it behaves biologically, and what previous therapy was given. Recurrent cancers can be cured, but the chance of cure is usually far lower than it is for the initial treatment of cancer. Advanced and incurable cancer may exist at the time of diagnosis, or it may occur after many years of treatment and follow-up care. In either case, the usual goal of care for the patient with advanced cancer resistant to anticancer therapy is symptom relief. Some patients may also want to participate in clinical trials of new experimental treatments.
Palliative Care
Much can be done to relieve symptoms, ease distress, provide comfort, and in other ways improve the quality of life of someone with cancer. This care may be referred to as palliative care, supportive care, or comfort care. Palliative care is important at any stage of cancer care management. For a person with cancer, maintenance of quality of life requires, at a minimum, relief from pain and other distressing symptoms; relief from anxiety and depression, including the fear of pain; and a sense of security that assistance will be readily available if needed. Hospice care is an approach to care during the final stages of life.
End-of-Life Care
One-half of cancer patients die of the disease, making death and end-of-life care important issues that must be addressed (American Society of Clinical Oncology, 1998). Poor symptom control, fear, and a lack of acceptance of death before dying, can be minimized by ensuring that appropriate medical and social support services are available (Foley, 1998). End-of-life care is in itself a diverse set of services and may involve the following (Lynn, 1997):
- management of physical or emotional symptoms and limitations of function;
- provision of pain relief and palliation to improve or maintain the quality of remaining life;
- counseling on the potential harm or benefit of aggressive life-extending treatments;
- respite, social support, and other services to relieve caregiver burden;
- advance care planning (e.g., living wills); and
- bereavement support.
End-of-life care extends beyond physical treatments to include supportive psychological, spiritual, and emotional care, and the goals of care shift from the quantity of life to the quality of life and symptom relief.
Providers of Cancer Care
It is common for cancer patients to see a number of specialist providers during the course of cancer care. Interdisciplinary care refers to the reliance on health care and other providers with a range of backgrounds and expertise. An interdisciplinary cancer care team might include an oncology nurse, pathologist, radiation oncologist, medical oncologist, surgeon, nutritionist, social worker, occupational therapist, pastoral counselor, hospice volunteer, and pain management team made up of physicians, nurses, and pharmacists. Individuals being cared for in a cancer center may have the most direct access to the full range of cancer care providers. In other settings—for example, rural areas—a community-based primary care provider may become the local member of a geographically dispersed team and, through communication, serve as a link between these providers and patients.
A wide range of physicians can be involved in cancer care, from pathologists, radiologists, surgeons, and medical oncologists, to specialists in pain management. It is difficult to obtain a precise count, but there are roughly 10,000 cancer physician specialists according to information from medical boards, the American Medical Association's (AMA's) annual survey of physicians, and the American Society of Clinical Oncology (ASCO).
Specialty medical boards are private, voluntary, nonprofit organizations founded to conduct examinations and issue certificates of qualifications. As of 1997, four medical specialty boards had certified nearly 10,000 cancer specialists:
- The American Board of Internal Medicine had certified 6,550 medical oncologists.
- The American Board of Radiology had certified 1,468 radiation oncologists.
- The American Board of Pediatrics had certified 1,348 pediatric hematology oncologists.
- The American Board of Obstetrics and Gynecology had certified 568 gynecologic oncologists.
Many practicing "oncologists" are not board certified as such. For example, among physicians identifying themselves as radiation oncologists on the AMA survey, as many as one-quarter were not certified by the American Board on Radiology (AMA, 1997). The reasons experienced oncologists might not be board certified include age (board certification is relatively recent) and primary involvement in research activities rather than patient care. Board certification is used as a quality indicator for physicians, but subspecialty certification is not always available for cancer specialists (e.g., there is no board certification for surgical oncology).
According to the AMA, in 1996 there were an estimated 6,731 self-identified medical oncology specialists representing 1 percent of the U.S. physician workforce. Nearly all of these oncologists (87 percent) were involved in patient care, and of these, more than three-quarters (77 percent) were in office-based practices. An estimated 8 percent of oncologists were primarily clinical researchers (AMA, 1998).
As of 1997, about 9,000 U.S.-based physicians belonged to the American Society of Clinical Oncology, the largest professional society dedicated to clinical oncology issues (Linda Mock, American Society of Clinical Oncology, personal communication to Mafia Hewitt, March 1998).
Ambulatory Cancer Care Providers
National data on ambulatory medical care is available from two large surveys conducted by the National Center for Health Statistics, the National Ambulatory Medical Care Survey (NAMCS), and the National Hospital Ambulatory Medical Care Survey (NHAMCS) (Schappert, 1997). Only nonfederally employed physicians are included in the NAMCS sample and certain specialties are excluded—anesthesiologists, pathologists, and radiologists. Clinics specializing in radiology were excluded from the NHAMCS. Radiologists are important providers of cancer care and their omission limits the interpretation of cancer-specific analyses. Nevertheless, data from these surveys are presented to obtain some insights into the characteristics of adult ambulatory cancer care provided in physician office-based practices and hospital outpatient departments (care provided in hospital emergency rooms was excluded from the following analyses).
Each year, an estimated 19 million adults (age 25 and older) visit physicians' offices and hospital outpatient departments for cancer care.1 These visits represent 3 percent of adult ambulatory care visits. The five physician specialties (excluding radiologists) providing most adult office-based ambulatory cancer care are the following (Table 2.2):
- oncologists,
- primary care providers,
- dermatologists,
- urologists, and
- general surgeons.
The predominant physician provider (excluding radiologists) of adult ambulatory cancer care varies by type of cancer (see Table 2.2):
- Urologists are the main providers of ambulatory care for adults with prostate cancer (72 percent of visits).
- Dermatologists are the main providers of ambulatory care for adults with skin cancer (nonmelanoma) (67 percent of visits).
- Oncologists see roughly one-half of adults with cancer of the lung or larynx (46 percent of visits), female breast (45 percent visits), and colorectal cancer (51 percent of visits), and nearly two-thirds of adults seeking care for lymphoma or leukemia (73 percent of visits).
TABLE 2.2
Distribution of Adult (age 25 and older) Ambulatory Cancer Care Visits, by Type of Cancer, Site of Visit, and Physician Specialty, 1994-1996 a
|
|
Type of Cancerb |
|||||||
|
|
All |
Larynx, Lung |
Female Breast |
Prostate |
Colon, Rectum |
Lymphoma, Leukemias |
Skin (nonmelanoma) |
Other Type |
|
Sample Size |
5,609 |
455 |
1,122 |
698 |
606 |
705 |
713 |
1,310 |
|
Site of Visit |
100.0 |
100.0 |
100.0 |
100.0 |
100.0 |
100.0 |
100.0 |
100.0 |
|
Physician office-based visits |
88.6 |
83.5 |
88.4 |
94.0 |
87.9 |
86.5 |
94.5 |
84.8 |
|
Hospital outpatient department visits |
11.4 |
16.5 |
11.6 |
6.0 |
12.1 |
13.5 |
5.5 |
15.2 |
|
Physician Office-Based Visitsc |
||||||||
|
All physicians |
100.0 |
100.0 |
100.0 |
100.0 |
100.0 |
100.0 |
100.0 |
100.0 |
|
Oncology |
33.8 |
45.5 |
45.1 |
9.9 |
51.0 |
72.9 |
0.3 |
27.3 |
|
Primary care |
15.4 |
23.0 |
12.8 |
14.3 |
24.1 |
16.0 |
10.5 |
14.7 |
|
General surgery |
10.4 |
3.0 |
29.9 |
0.7 |
16.3 |
1.5 |
5.9 |
8.0 |
|
Specialty surgery |
5.1 |
4.4 |
6.6 |
0.2 |
1.8 |
0.8 |
12.7 |
5.4 |
|
Dermatology |
14.3 |
0.0 |
0.0 |
0.0 |
0.0 |
1.6 |
67.3 |
14.4 |
|
Urology |
12.3 |
0.0 |
0.0 |
71.5 |
0.1 |
0.0 |
0.0 |
13.4 |
|
Other specialty |
8.8 |
24.0 |
5.5 |
3.5 |
6.7 |
7.3 |
3.3 |
16.9 |
|
Hospital Outpatient Department Visitsd |
||||||||
|
Total |
100.0 |
100.0 |
100.0 |
100.0 |
100.0 |
100.0 |
100.0 |
100.0 |
|
General medical |
81.0 |
73.1 |
87.0 |
66.6 |
91.3 |
96.0 |
82.2 |
69.8 |
|
Surgery |
18.0 |
26.8 |
13.0 |
33.4 |
8.7 |
3.7 |
17.8 |
26.7 |
|
Other |
1.0 |
0.1 |
0.0 |
0.0 |
0.0 |
0.3 |
0.0 |
3.5 |
Nurses and social workers are also essential providers of cancer care. More than 17,000 nurses are certified by the Oncology Nursing Society as oncology nurses (ONS, 1998). These nurses have extensive experience with the management of cancer, including the administration of chemotherapy, monitoring of pain and nausea, and patient counseling and education. An estimated 1,000 social workers with special training in oncology provide psychosocial services to people with cancer and their families (Susan Hedlund, Association of Oncology Social Workers, personal communication to Maria Hewitt, September 1998).
Cancer care often involves numerous practitioners across a variety of settings, physicians' offices, outpatient diagnostic centers, hospitals, nursing homes, patients' homes, and hospices, making communication and coordination of care difficult. Comprehensive and coordinated care management refers to the ability to fully access necessary services and to have components of care efficiently planned and integrated. Clear and ongoing communication among care providers and among providers, patients, and family members is a prerequisite to coordinated care. Too often, adults newly diagnosed or suspected of having cancer see one doctor and then others sequentially, without having an overall plan of care devised at the outset by, or in consultation with an interdisciplinary team. This can have deleterious consequences because the first treatment offers the best chance for cure and because every treatment used may limit subsequent treatment options (Moore, 1985).
Sites of Cancer Care
Although the locus of cancer care in the past has been the hospital, an increasing number of cancer care services, from diagnostic imaging to the administration of chemotherapy, are being shifted from the hospital to outpatient settings. According to the NAMCS and the NHAMCS, most cancer-related adult ambulatory care is provided in physicians' offices (89 percent), with the balance (11 percent) provided in hospital outpatient departments (Table 2.3).2 Relatively few types of cancer account for more than three-quarters (79 percent) of all adult ambulatory visits—female breast; skin (nonmelanoma); lymphomas and leukemias; prostate; colon and rectum; and lung and respiratory cancers (Table 2.3). Management of cancer-related symptoms and the need for follow-up care and pre-or postoperative checks are among the most common reasons for adults' making cancer-related ambulatory care visits (Table 2.3). Chemotherapy is administered during about one in five adult ambulatory care visits (22 percent). As would be expected given the age of onset of most cancers, more than one-half (56 percent) of adult ambulatory care visits are made by the elderly, and Medicare is the principal source of payment for adult ambulatory care visits (Table 2.3).
In 1997, nearly 1,000 hospital-based cancer care programs discharged 276 or more patients with a primary diagnosis of cancer (Comarow, 1997; Ehrlich, 1997). These hospitals range from relatively small, community-based hospitals to large referral centers that treat cancer patients exclusively. Available evidence suggests that cancer patients are concentrated in a few U.S. hospitals. Only one in three of the 5,080 general hospitals in the United States has a cancer program approved by the American College of Surgeons' Commission on Cancer (AcoS-COC)
(1,500 programs), but these hospitals, most of them community hospitals, provide care for 80 percent of newly diagnosed patients (Carol Cook, Administrative Coordinator, American College of Surgeons, personal communication to Maria Hewitt, February 1999; American Hospital Association, 1999).3
TABLE 2.3
Characteristics of Adult (age 25 and older) Cancer-Related Ambulatory Cancer Care Visits, 1994-1996
|
|
Cancer Care Visitsa |
|
|
Characteristic |
Sample Size |
Distribution (%)b |
|
Type of cancerc |
||
|
Lung, other respiratory |
455 |
7.3 |
|
Female breast |
1,122 |
18.4 |
|
Prostate |
698 |
12.7 |
|
Colon, rectum |
606 |
11.0 |
|
Lymphomas, leukemias |
705 |
14.0 |
|
Skin (nonmelanoma) |
713 |
15.7 |
|
All others |
1,310 |
20.9 |
|
Age |
||
|
25-44 |
649 |
9.8 |
|
45-64 |
1,970 |
33.9 |
|
65-74 |
1,604 |
29.2 |
|
75+ |
1,386 |
27.1 |
|
Site of visits |
||
|
Physician office |
3,075 |
88.6 |
|
Hospital outpatient department |
2,534 |
11.4 |
|
Reason for visitd |
||
|
Symptoms |
1,297 |
26.4 |
|
Exam, tests, medication |
735 |
12.3 |
|
Chemotherapy, other therapy |
680 |
11.6 |
|
Follow-up, pre-or post-op check |
1, l 58 |
19.2 |
|
Cancer, no specific reason provided |
1,474 |
25.8 |
|
Other |
265 |
4.8 |
|
Oncolytic therapy administerede |
||
|
Yes |
1.090 |
21.9 |
|
No |
4,519 |
78.1 |
|
Result of referralf |
||
|
Yes |
1,740 |
28.0 |
|
No |
3,869 |
72.0 |
|
3 |
See Chapter 6 for a description of the ACoS-COC survey process. |
|
|
Cancer Care Visitsa |
|
|
Characteristic |
Sample Size |
Distribution (%)b |
|
Insurance |
||
|
Medicare |
2,671 |
49.2 |
|
Medicaid |
299 |
2.4 |
|
Non-Medicare, private commercial |
1,316 |
23.9 |
|
Non-Medicare, HMO, other prepaid |
653 |
14.6 |
|
Self-pay or no charge |
295 |
4.6 |
|
Other insurance |
92 |
1.0 |
|
Unknown |
283 |
4.2 |
|
a Visit was considered cancer related if the principal diagnosis was coded as a malignant neoplasm (ICD-9 140 to 208). Radiologists and radiology clinics are not included in the survey samples and ambulatory visits to these providers are not represented. b Percentages are adjusted using sampling weights to produce national estimates. c In the Ninth Edition of the International Classification of Diseases (ICD-9): larynx, lung = 161, 162; female breast = 174; prostate = 185; colon, rectum = 153, 154; lymphomas, leukemias = 200-208; other = all other malignancies. d Reason for visit is the most important patient complaint, symptom, or other reason given by the patient for the visit. e Oncolytic therapy ordered, supplied, or administered during the visit including antineoplastics; hormonal or biological response modifiers; antimetabolites; antibiotics, alkaloids, or enzymes; or DNA-damaging drugs (National Drug Code Directory Drug Classes). f Was patient referred for this visit by another physician? SOURCE: USDHHS, 1999a, b. |
||
Each year, individuals with cancer incur 1.4 million hospitalizations (5 percent of all hospital discharges) (Graves and Gillum, 1997). In 1994, relatively few types of cancer accounted for the majority (52 percent) of hospitalizations—lung and other respiratory cancers, lymphomas and leukemias, and cancers of the colon and rectum, female breast, and prostate (Table 2.4). Most individuals hospitalized with a principal diagnosis of cancer are elderly (55 percent), and Medicare is the payer for most hospital care (Table 2.4). A greater share of cancer-related hospitalizations occurs in larger than in smaller hospitals (i.e., 45 percent of cancer-related hospitalization are in hospitals with 300 beds or more, and 37 percent are in hospitals with fewer than 200 beds) (Table 2.4).
With the advent of earlier hospital discharges, there has been a growing demand for services provided in the home. About 6 percent of the 2 million individuals estimated to be receiving home health care services each year have cancer (Jones and Strahan, 1997). Most indi-
viduals who die as a result of cancer spend the end of their lives in hospitals, but individuals with cancer are more likely than those with other conditions to use hospice care. The majority of individuals residing in hospice care facilities have cancer (Jones and Strahan, 1997).
TABLE 2.4
Characteristics of Hospital Discharges with Primary Diagnosis of Cancer, 1994
|
Characteristic |
Sample Size |
Estimate No. of Cancer-Related Hospital Discharges Nationally (se) a |
Percent Distribution (se)a |
|
All cancer discharges |
11,021 |
1,408,600 (66,300) |
100.0 |
|
Type of cancerb |
|||
|
Lung, other respiratory |
1,415 |
194,000 (14,800) |
13.8 (0.8) |
|
Female breast |
1,092 |
137,300 (11,900) |
9.7 (0.7) |
|
Prostate |
838 |
110,000 (10,400) |
7.8 (0.6) |
|
Colon, rectum |
1,172 |
142,900 (12,200) |
10.1 (0.7) |
|
Lymphomas, leukemias |
1,116 |
152,000 (12,700) |
10.8 (0.7) |
|
All others |
5,388 |
672,300 (35,800) |
47.8 (1.2) |
|
Age |
|||
|
0-24 |
455 |
53,600 (10,100) |
3.8 (0.2) |
|
25-44 |
1,029 |
129,900 (8,100) |
9.2 (0.4) |
|
45-64 |
3,434 |
444,900 (27,300) |
31.6 (0.5) |
|
>65 |
6,103 |
780,100 (48,900) |
55.4 (0.6) |
|
Sex |
|||
|
Male |
5,227 |
664,100 (44,800) |
47.1 (0.6) |
|
Female |
5,794 |
744,600 (31,100) |
52.9 (0.8) |
|
Race |
|||
|
White |
7,382 |
1,012,600 (62,700) |
71.9 (1.1) |
|
Black |
1,059 |
127,100 (11,500) |
9.0 (0.4) |
|
Other |
642 |
54,600 (10,400) |
3.9 (0.2) |
|
Not stated |
1,938 |
214,300 (29,000) |
15.2 (0.6) |
|
Hospital size (No. of Beds) |
|||
|
6-99 |
896 |
190,800 (14,600) |
13.5 (0.8) |
|
100-199 |
1,822 |
329,800 (21,100) |
23.4 (1.0) |
|
200-299 |
2,627 |
254,200 (17,600) |
18.0 (0.9) |
|
300-499 |
3,521 |
384,100 (23,500) |
27.3 (1.1) |
|
>500 |
2,155 |
249,600 (17,400) |
17.7 (0.9) |
|
Characteristic |
Sample Size |
Estimated No. of Cancer-Related Hospital Discharges Nationally (se) a |
Percent Distribution (se)a |
|
Principal expected source of payment |
|||
|
Medicare |
5,352 |
733,500 (64,300) |
52.1 (0.8) |
|
Medicaid |
683 |
82,900 (11,400) |
5.9 (0.7) |
|
Other government |
117 |
20,100 (5,500) |
1.4 (0.3) |
|
Blue Cross |
1,097 |
119,500 (28,131) |
8.5 (1.9) |
|
Other private or commercial |
2,965 |
354,600 (49,100) |
25.2 (3.0) |
|
Self-pay or no charge |
298 |
36,700 (8,800) |
2.6 (0.6) |
|
Other |
352 |
38,200 (6,372) |
2.7 (0.3) |
|
Not stated |
157 |
23,100 (5,700) |
1.6 (0.2) |
|
a Numbers and percentages are adjusted using sampling weights to produce national estimates. Variance estimates were calculated using the Taylor series approximation technique taking into account the complex design the survey (StataCorp, 1997). b According to the Ninth Edition of the International Classification of Diseases, (ICD-9): lung, larynx = 161, 162; female breast = 174; prostate = 185; colon, rectum = 153, 154; lymphomas, leukemias 200-208; other = all other malignancies. Table includes discharges for which the first listed diagnosis was cancer. SOURCE: USDHHS, 1999c. |
|||
The Intersection of Cancer Care and Research
The majority of children with cancer (an estimated 70 percent), but only about 2 percent of adults, receive their care through a research protocol, most often sponsored by the National Cancer Institute (NCI, 1998a). There are 35 NCI-designated ''comprehensive cancer centers'' with extensive research portfolios covering basic science, epidemiology, medicine, and public health. Another 23 NCI-designated "basic" and "clinical" cancer centers have research programs with a narrower focus (Figure 2.3). In addition to conducting research, NCI-designated cancer centers also provide community outreach activities and public education (NCI, 1999).
NCI's Cooperative Group Program conducts and promotes multi-institutional clinical trials. Twelve cooperative groups involve 1,700 institutions and 6,000 investigators throughout the United States, Canada, Europe, and Australia. Each year, approximately 20,000 new patients participate in cooperative group clinical trails (NCI, 1999).
The Community Clinical Oncology Program (CCOP) links community cancer specialists and primary care physicians with clinical cooperative groups and cancer centers to conduct clinical trials. There are currently 48 CCOP offices in 30 states, with 330 participating hospitals at which some 2,300 physicians enter individuals into NCI-approved clinical trials. An additional seven minority-based CCOPs enhance the participation of minority populations in clinical trials. Altogether, more than 4,000 patients are entered into NCI-sponsored cancer treatment clinical trials each year through CCOPs and an additional 4,000 participants are entered into cancer prevention and control clinical trials (NCI, 1999).
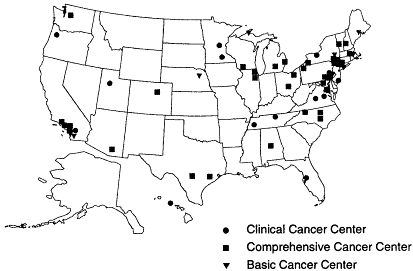
Figure 2-3
National Cancer Institute-designated cancer centers.
Financial Costs of Cancer Care
The financial costs of cancer care are substantial, both in societal terms and to individuals paying for care. This section describes estimates of national cancer care expenditures and, with the limited data that are available, the distribution of costs by cancer site or phase of care. Chapter 3 discusses financial costs from a patient perspective and reviews potential financial barriers to access to care related to the absence of insurance coverage or to inadequate insurance coverage for care.
In 1998, the "direct" health care cost of delivering cancer care (e.g., hospital and outpatient care, nursing home care, home health care, doctors and other providers, drugs) was estimated to be roughly $50 billion, representing about 5 percent of U.S. health care expenditures (Martin Brown, Head, Health Services and Economics Section, Applied Research Branch, Cancer Surveillance Research Program, National Cancer Institute, personal communication, October 19, 1998; Schuette et al., 1995). Most "direct" cancer care expenditures cover hospital care (65 percent) and physicians' services (24 percent) (Brown and Fintor, 1995). The economic burden of cancer is substantially higher if "indirect'' costs are considered, for example, those associated with lost earnings and reduced work productivity (Brown and Fintor, 1995).
Direct medical costs for cancer exceed those for most other chronic illnesses. In one study of chronic health care direct costs in a large staff-model health maintenance organization (HMO), the annual costs for cancer exceeded by far the annual costs associated with other chronic diseases such as heart disease, diabetes, depression, and multiple sclerosis. A person diagnosed with heart disease accounted for 40 percent more in annual costs than someone without such a diagnosis, after controlling for age, sex, and presence of other chronic conditions. For cancer, there was more than a ninefold increase in annual cost (Fishman et al., 1997). Factors contributing to the high costs associated with cancer care include the specialized facilities and personnel used to deliver therapy, the inherent toxicity and other risks associated with anticancer treatments, the complexity of the disease
and variability in patient response, and the advent of new technologies (e.g., radiotherapeutic equipment, new drugs, diagnostic tests) (Bailes, 1995; Lazar and Desch, 1998).
Cancer is a diverse set of conditions, so it is not surprising that the cost of cancer care varies by the type of cancer. In one analysis within a large staff-model HMO, the costs of initial, continuing, and terminal care were found to vary for three cancers: colon, prostate, and breast. The costs associated with each treatment phase varied by stage at diagnosis, patient age, and the presence or absence of other diseases, and the patterns of variation differed for each type of cancer. The total costs of initial care, for example, increased with stage at diagnosis for colon and breast cancer, but not for prostate cancer (Taplin et al., 1995).
The variation in cost by type of cancer and stage of illness is also seen in a study of Medicare payments. Among the Medicare population, average payments varied among cancer sites, especially in the initial care phase, where payments were highest for lung and colorectal cancers and lowest for female breast cancer (Table 2.5).
Efforts to promote cancer screening among the elderly will likely increase Medicare costs. Persons diagnosed at earlier stages incur higher total Medicare payments between diagnosis and death than those diagnosed at later stages, reflecting their longer survival. Total Medicare payments from diagnosis to death were lowest for those with lung cancer, mainly because of short survival times (Table 2.6).
Impact of an Changing Health Care System On Cancer Care
Cancer is a common chronic illness whose management is costly, technology dependent, and interdisciplinary and extends from prevention to end-of-life care. It thus illustrates the challenges posed by the increasingly complex and dynamic American health care system. This section describes how one dominant force of change, the rise in managed health care, has affected essential aspects of health care delivery that are important to individuals with cancer. Another trend, the tendency for employers to assume financial risk and to self-fund or insure their own health plans, is also described because it has limited the applicability of cancer-related, state-mandated health benefits and consumer protections.
TABLE 2.5
Average Medicare Payments by Site and Phase of Cancer (1990 dollars per person-year)
|
|
Lung |
Female Breast |
Prostate |
Colon or Rectum |
Bladder |
|
Less than 1 year survival |
$19,199 |
$16,475 |
$18,698 |
$22,473 |
$21,529 |
|
Survived I year or more |
|||||
|
Initial |
17,518 |
8,913 |
10,235 |
17,505 |
10,717 |
|
Continuing care |
4,305 |
3,138 |
3,788 |
3,625 |
4,656 |
|
Pre-final |
9,985 |
7,633 |
8,542 |
9,056 |
10,036 |
|
Final |
13,217 |
11,129 |
12,061 |
12,028 |
13,633 |
|
SOURCE: Riley et al., 1995. |
|||||
TABLE 2.6
Medicare Payments, Average Age at Diagnosis, and Average Years of Survival by Site of Cancer
|
|
Lung |
Female Breast |
Prostate |
Colon or Rectum |
Bladder |
|
Total payments from diagnosis to deatha |
$29,184 |
$50,448 |
$48,684 |
$51,865 |
$57,629 |
|
Average payments per yeara |
$17,371 |
$5,333 |
$7,005 |
$8,016 |
$7,927 |
|
Average age at diagnosis |
73.6 |
74.9 |
75.3 |
76.2 |
75.6 |
|
Average years of survival |
1.68 |
9.46 |
6.95 |
6.47 |
7.27 |
|
a 1990 dollars per person-year. SOURCE: Riley et al., 1995. |
|||||
Managed Care
Although the majority of Americans insured through employment-based plans, 73 percent in 1995, are enrolled in some type of managed care plan (President's Advisory Commission, 1998), less than one-half of newly diagnosed cancer patients are in such a system. This decreased exposure to managed care occurs because 60 percent of individuals newly diagnosed with cancer are elderly and covered by Medicare, and 87 percent of Medicare beneficiaries have opted for traditional fee-for-service (FFS) care (HCFA, 1998).
Managed care can be defined as an entity that assumes both the clinical and the financial responsibility for the provision of health care for a defined population (Donaldson, 1998). It is, however, difficult to distinguish one type of managed care organization from another (Box 2.2).
With the shift to managed care, health insurance products have adopted features that directly influence how care is delivered—what services are offered, who provides them, and how they are organized (President's Advisory Commission, 1998). The relationship between managed care and quality is not clear, and evidence can suggest that managed care is as good as, worse than, or better than fee-for-service care—depending on which research one turns to (Miller and Luft, 1997). Managed care presents "both a problem and an opportunity for cancer care" according to the President's Cancer Panel (President's Cancer Panel, 1997). On one hand, managed care organizations (MCOs) may restrict patients' access to oncology specialists, limit the use of new therapeutic agents (e.g., closed drug formularies, off-label use of drugs), or deny coverage of care offered as part of a clinical trial. Furthermore, physicians within MCOs may be at financial risk and so may not fully assume the role of patient advocate. On the other hand, proponents of managed care applaud the success of MCOs in curbing health care spending and suggest that managed health care promotes preventive services, standardizes "appropriate" care by adopting clinical practice guidelines, and often provides comprehensive disease management for those with chronic illnesses such as cancer. For Medicare beneficiaries, more extensive coverage of outpatient drugs and other ancillary services by HMOs than FFS plans is also viewed as particularly beneficial for cancer patients. The limited evidence regarding the way in which managed care has affected the quality of cancer care is reviewed in Chapter 5.
|
BOX 2.2 Defining Managed Care Although managed care has a long history in the United States, adoption of the federal Health Maintenance Organization Act in 1973 (as well as the term "health maintenance organization") marked the beginning of an era of accelerating growth for the managed care industry. In the 1970s and 1980s, HMOs typically were one of four distinct types:
Currently, this typology fails to describe accurately new forms of managed care. Many new systems now have components of both IPAs and groups, and share many of the same physician groups and intermediary organizations (e.g., IPAs). Most managed care organizations now have multiple options or "products" from which consumers can choose. Thus, the evolution of health care organizations has surpassed the current taxonomy, and even experienced observers of the health care system cannot adequately distinguish different health plans from one another. SOURCE: Landon et al., 1998. |
A key concern of individuals with cancer is how they access cancer care specialists. In managed care systems, access to oncology specialists is often through a "gatekeeper," a primary care provider who authorizes referrals to specialists. In recent years, nearly one-third of primary care physicians report an increase in the severity and complexity of patient conditions they care for without referring to a specialist (St. Peter et al., 1997). Oncologists have expressed concerns that delays in referrals from primary care providers in managed care settings can negatively affect the outcome of therapy (Mortensen, 1997). While there are public concerns about access to specialists within managed care, there is little information on how managed care has affected oncology referral patterns. Furthermore, it is not entirely clear what the respective roles of primary care physicians and specialists should be in the provision of some aspects of care (e.g., follow-up care). The limited available evidence on the effect of provider specialization on quality is reviewed in Chapter 5.
Access to treatments and procedures has also changed in recent years. Utilization review has become a standard feature of both conventional and managed care. In a 1995 national survey, physicians said that on average, 59 percent of their patients were reviewed for length of stay, 45 percent for site of care, and 39 percent for the appropriateness of treatment. Although utilization review is common, denials of recommended procedures or referrals to specialists are relatively rare. Physicians reported that only 1 percent of recommended surgical procedures and 3 percent of referrals to specialists were ultimately denied (Remler et al., 1997).
Most Medicare HMO enrollees report having few problems accessing care—in a 1996 survey, 6 percent said that they did not get a desired referral to a specialist. People with chronic illnesses, disabilities, or functional impairments were, however, more likely to report problems of access (Gold et al., 1997). Medicare beneficiaries enrolled in HMOs are generally satisfied with their plans, and those whose cancer is diagnosed after they enroll are no more likely than others to disenroll and opt for fee-for-service care (Riley et al., 1996).
When patients (or their physicians) disagree with a plan's coverage decision, a resolution procedure is available, but the timeliness and processes (e.g., option of external review) may vary greatly from plan to plan. Licensed health plans are subject to numerous state and federal laws, and many also comply with standards of private accrediting bodies (e.g., National Committee for Quality Assurance, Joint Commission on Accreditation of Healthcare Organizations) (see Box 2.3) (President's Advisory Commission, 1998).
|
BOX 2.3 Selected Federal and State Regulations Regarding Resolution of Complaints or Appeals* Medicare Under the Medicare fee-for-service system, fiscal intermediaries and carriers must provide a two-step internal review and notification of their final decision before a beneficiary is entitled to seek reconsideration from the Social Security Administration (SSA) and the Health Care Financing Administration (HCFA). HMOs that participate in Medicare are required to provide meaningful internal procedures for resolving complaints about the quality of care, untimely provision of care, or improper demeanor of health care personnel. HMO decisions to deny coverage for certain treatments, referral outside a plan, or reimbursement for emergency or out-of-area care are subject to an external review and administrative appeal. HCFA has contracted with a private organization, the Center for Health Dispute Resolution, to perform these reconsiderations. After external review, a Medicare beneficiary dissatisfied with the results of the review has a right to SSA review. Medicaid The federal Medicaid statute requires state agencies to provide beneficiaries with a fair hearing and an administrative appeal when their eligibility or requests for services are denied or not acted upon within reasonable time. These determinations can be challenged in state court under state administrative procedure acts or in federal court. In addition, HMOs that contract to serve Medicaid beneficiaries must establish an internal complaint procedure that will resolve disputes promptly. These internal procedures are subject to review and approval by the state. |
|
ERISA Plans All employers offering health benefits to their employees through managed care organizations or traditional indemnity insurers must comply with requirements of the Employee Retirement Income Security Act (ERISA). ERISA requires private employer-provided health benefit plans to disclose certain information to plan participants, to report information to the federal government, and to pay benefits that are promised under the plans. ERISA regulations generally require employer health plans to approve or deny claims within 90 days and to approve or deny an appeal of claims denials within 60 days. Although ERISA health plans are required to establish and disclose complaint and appeals procedures to participants, and to notify participants of claims denials, the plans are not required to provide a particular complaint procedure. State-Licensed Insurance Products Some state insurance regulations require health insurers doing business in the state to provide certain complaint procedures to enrollees. In addition, all 50 states have laws licensing or governing HMOs doing business in the state, which are separate from their laws regulating indemnity insurance products. Many states' laws are based on the model HMO law drafted by the National Association of Insurance Commissioners, which requires HMOs to establish complaint procedures approved by the state's insurance commissioner. An estimated 30 states have some specified complaint procedures that HMOs must follow, and at least seven states now require an expedited appeal for denials of urgently needed care. SOURCE: President's Advisory Commission, 1998. |
Changes in the way physicians are paid have altered the financial incentives of clinical practice. Whereas providers under fee-for-service generally have financial incentives to provide more care, managed care plans have attempted to shift the incentive system toward the use of performance indicators. Common measures used by half or more HMOs with such physician incentive systems include utilization and cost, quality of care (e.g., adherence to practice guidelines), patient complaints, and the results of consumer surveys. Usually, these performance-based bonuses or "withholds" represent a small share of a physician's total income. Managed care organizations still tend to pay individual specialists on a fee-for-service basis, but elements of risk are being introduced. Some plans are capitating (i.e., paying a flat fee per patient covered) or competitively bidding for specific specialty services such as mental health, radiology, podiatry, and cardiology (InterStudy, 1997). Some managed care organizations offer cancer care as a "carve-out" through a network of cancer care providers (e.g., Value Oncology Services) (Bell, 1997). In these arrangements, an employer removes coverage for cancer care from the regular health benefits plans and arranges for coverage through a contract with a separate set of specialized providers.
Cancer care is often resource intensive, and some managed care companies are hiring disease management specialists to track costs and manage patient care (Bennett, 1997; Piro and Doctor, 1998). Disease management systems can reduce costs and improve care if they coordinate care
and reduce unnecessary visits or redundant diagnostic tests or if they manage pain and other symptoms better, thereby reducing the use of emergency rooms. Disease management can contribute to greater patient satisfaction if coordination of care and provider communication improve.
Several versions of a patient's Bill of Rights were considered during the 105th Congress, but no federal legislation was passed (Medical Payment Advisory Commission, 1998). A range of protections that are particularly relevant to people with cancer in managed care plans were considered, including guaranteed access to health care specialists, continuity of care if a health provider is dropped in the middle of treatment, reimbursement for care while participating in clinical trials, and access to a meaningful internal and external appeals process for consumers to resolve their differences with their health plans and health care providers.
Self-Funded Health Insurance Plans
Nearly one-half of insured workers in 1995 were employed by organizations that self-fund their health insurance plans (Jensen, 1997). Many states have mandated the coverage of certain health benefits and consumer protections, but self-funded plans are regulated under the federal Employee Retirement Income Security Act of 1974 (ERISA) and are not subject to these mandates. Several state laws affect cancer care (Box 2.4). Rhode Island, Georgia, and Maryland, for example, require insurers to pay for new investigational cancer therapies provided as part of a qualified clinical trial, and at least 17 states prohibit insurers from excluding coverage for the off-label use of prescription drugs to treat cancer (e.g., use of a drug approved by the U.S. Food and Drug Administration [FDA] for one type cancer or other condition to treat another type of cancer for which the drug has not yet been FDA approved) (NCI, 1998b). States can affect the care provided under ERISA plans by mandating what providers licensed in the state must do (e.g., requiring physicians to give patients with breast cancer information about treatment options) (Murphy et al., 1997).
Key Findings
A single national system or program to ensure access to comprehensive, coordinated care for cancer does not exist. This situation is not unique to cancer, and in fact, pluralism, dynamism, and diversity are hallmarks of the U.S. health care industry (President's Advisory Commission, 1998). The ad hoc and fragmented nature of the existing "system," however, is especially problematic for individuals with cancer because of the complex nature of cancer care.
The trajectory of cancer care services—from early detection to treatment, follow-up, and palliative care can span decades, occur in a variety of settings, involve numerous providers from different medical disciplines, and incorporate an ever-changing set of treatment modalities. The course of care through this trajectory varies widely by type of cancer (of which there are more than 100) and stage of disease. In addition to being highly complex, cancer is one of the most expensive conditions to treat, consuming about one out of every twenty health care dollars spent in the United States.
|
BOX 2.4 State Laws Mandating Cancer Care Benefit Coverage Screening
Treatment
|
|
Clinical Trial Reimbursement
Protections for the Indigent
SOURCE: NCI, 1998b. |
Over the past few decades, managed care has grown to become the dominant organizing and financing mechanism for U.S. health care, changing dramatically the way in which health care services are delivered. Individuals with cancer are less likely to be covered by managed care plans because they are elderly and tend to have Medicare's traditional fee-for-service coverage. Nevertheless, many aspects of cancer care—for example, access to specialists, coverage for drugs and ancillary services, and use of practice guidelines—differ in managed care compared to fee-for-service care. In response to market forces, managed care organizations have consolidated, diversified, and become quite heterogeneous, making it difficult to generalize about their impact on cancer care. States, in some instances, have tried to counter the effects of managed care by mandating certain benefits or consumer protections. These mandates, however, do not apply to many Americans whose health plans are self-funded by an employer and therefore exempt from state regulation.
References
American Cancer Society. 1999. Cancer Facts and Figures—1999. Atlanta, GA: American Cancer Society.
American Hospital Association, 1999. Hospital Statistics: 1999 Edition . Chicago: American Hospital Association.
American Medical Association. 1997. Physician Characteristics and Distribution in the U.S. 1996-1997 Edition. Chicago: American Medical Association.
American Medical Association. 1998. Physician Characteristics and Distribution in the U.S. 1997-1998 Edition. Chicago: American Medical Association.
American Society of Clinical Oncology. 1998. Cancer care during the last phase of life. Journal of Clinical Oncology 16(5):1986-1996.
Bailes JS. 1995. The economics of cancer care. Cancer 76(10 Suppl.):1886-1887.
Bell N. 1997. Approaches to cancer management vary widely. Faulkner & Gray's Medicine and Health Perspectives 51(27):3.
Bennett C, Buchner D, Ullman M. 1997. Approaches to prostate cancer by managed care organizations. Urology 50(1):79-86.
Brown ML, Fintor L. 1995. Economic burden of cancer. In Greenwald P, Kramer BS, Weed DL, eds. Cancer Prevention and Control. New York: M. Dekker.
Comarow A. 1997. 1997 annual guide to America's best hospitals: Inside the rankings. U.S. News & World Report, July 28.
Donaldson MS. 1998. Accountability for quality in managed care. Journal of Quality Improvement 24(12):711-725.
Ehrlich, RH, Hill CA, Winfrey KL, 1997. The 1997 index of hospital quality. Chicago: National Opinion Research Center, University of Chicago.
Fishman P, Von Korff M, Lozano P, et al. 1997. Chronic care costs in managed care. Health Affairs 16(3):39-47.
Foley K. 1998. Presentation on ''Policy issues for physicians and caregivers," at President's Cancer Panel Quality of Cancer Care/Quality of Life Conference, New Haven, CT.
Ganz P. 1996. Understanding cancer, its treatment, and the side effects of treatment. Chapter one in Hoffman B, ed. A Cancer Survivor's Almanac: Charting Your Journey. National Coalition for Cancer Survivorship.
Gold M, Nelson L, Brown R, et al. 1997. Disabled Medicare beneficiaries in HMOs. Health Affairs 16(5):149-162.
Graves EJ, Gillum BS. 1997. National hospital discharge survey: Annual summary, 1994. Vital and Health Statistics. Series 13: Data from the National Health Survey (128):i-v; 1-50.
Health Care Financing Administration. 1998. http://www.hcfa.gov.
InterStudy. 1997. The InterStudy Competitive Edge: Part II, HMO Industry Report. No. 7.2. Excelsior, MN.
Jensen GA, Morrisey MA, Gaffnet S, Liston DK. 1997. The new dominance of managed care: Insurance trends in the 1990s. Health Affairs 16(1):125-136.
Jones A, Strahan G. 1997. The National Home and Hospice Care Survey: 1994 summary. National Center for Health Statistics. Vital Health Statistics. Series 13: Data from the National Health Survey 13(126):i-v; 1-125.
Landon B, Wilson I, Cleary P. 1998. A conceptual model of the effects of health care organizations on the quality of medical care. Journal of the American Medical Association 279(17):1377-1382.
Lazar GS, Desch CE. 1998. Performance measurement in cancer care: Uses and challenges. Cancer 82(10 Suppl):2016-2021.
Lynn J. 1997. Measuring quality of care at the end of life: A statement of principles. Journal of the American Geriatrics Society 45(4):526-527.
Mandelblatt J, Yabroff KR, Kerner J. 1998. Access to quality cancer care: Evaluating and ensuring equitable services, quality of life and survival. National Cancer Policy Board commissioned paper.
McGeary M. 1997. The National Cancer Program: Enduring Issues. Washington, D.C.: National Academy of Sciences, National Cancer Policy Board.
Medical Payment Advisory Commission. 1998. Report to the Congress: Context for a Changing Medicare Program.
Miller R, Luft H. 1997. Does managed care lead to better or worse quality of care? Health Affairs 16(5): 7-25.
Moore C. 1985. Multidisciplinary pretreatment cancer planning. Journal of Surgical Oncology 28:79-86.
Mortensen L, Leader S, Mallick R, et al. 1997. The impact of managed care on oncology practice. Oncology Issues 22-27.
Murphy GP, Morris LB, Lange D. 1997. Informed Decisions: The Complete Book of Cancer Diagnosis, Treatment, and Recovery. New York: Penguin Group.
National Cancer Advisory Board. 1994. Cancer at a Crossroads: A Report to Congress for the Nation.
National Cancer Institute. 1997. Cancer Research: Because Lives Depend on It. Bethesda, MD: National Institutes of Health.
National Cancer Institute. 1998a. The Nation's Investment in Cancer Research: A Budget Proposal for Fiscal Year 1999. Bethesda, MD: National Institutes of Health.
National Cancer Institute. 1998b. State Cancer Legislative Database Program. 1990-98. Bethesda, MD: National Institutes of Health.
National Cancer Institute. 1999. The Nation's Investment in Cancer Research: A Budget Proposal for Fiscal Year 2000. Bethesda, MD: National Institutes of Health.
Oncology Nursing Society. 1998. http://www.ons.org.
Piro L, Doctor J. 1998. Managed oncology care: The disease management model. Cancer 82(Suppl. 10):2068-2075.
Polednak AP. 1994. Projected numbers of cancer diagnosed in the U.S. elderly population, 1990 through 2030 . American Journal of Public Health 84(8):1313-1316.
President's Advisory Commission on Consumer Protection and Quality in the Health Care Industry. 1998. Quality first: Better health care for all Americans. Washington, D.C.
President's Cancer Panel. 1997. Fighting the War on Cancer in an Evolving Health Care System. Bethesda, MD: National Cancer Program, National Cancer Institute.
Remler D, Donelan K, Blendon R, et al. 1997. What do managed care plans do to affect care? Results from a survey of physicians. Inquiry 34 (Fall):196-204.
Ries LAG, Kosary CL, Hankey BF, et al., eds. 1997. SEER Cancer Statistics Review, 1973-1994. NIH Pub. No. 97-2789. Bethesda, MD: National Cancer Institute, National Institutes of Health.
Riley, GF, Feuer EJ, Lubitz JD. 1996. Disenrollment of Medicare cancer patients from health maintenance organizations. Medical Care 34(8):826-836.
Riley GF, Potosky AL, Lubitz JD, et al. 1995. Medicare payments from diagnosis to death for elderly cancer patients by stage at diagnosis. Medical Care 33(8):828-841.
Schappert SM. 1997. Ambulatory care visits to physician offices, hospital outpatient departments, and emergency departments: United States, 1995. Vital and Health Statistics. Series 13: Data from the National Health Survey (129):1-38.
Schuette HL, Tucker TC, Brown ML, et al. 1995. The costs of cancer care in the United States: Implications for action. Oncology 9(11 Suppl.):19-22.
Simone J, Lyons J. In press. Superior cancer survival in children compared to adults: A superior system of cancer care? Salt Lake City: Huntsman Cancer Institute, University of Utah.
StataCorp, 1997, Stata Statistical Software: Release 5.0, College Station, TX: Stata Corporation.
St. Peter R, Reed MC, Blumenthal D, Kemper P.1997. The scope of care provided by primary care physicians: Physician assessments of change and appropriateness. Paper presented at the Association for Health Services Research Annual Meeting, Chicago.
Taplin SH, Barlow W, Urban N, et al. 1995. Stage, age, comorbidity, and direct costs of colon, prostate, and breast cancer care. Journal of the National Cancer Institute 87(6):417-426.
U.S. Department of Health and Human Services, National Center for Health Statistics. 1999a. National Ambulatory Medical Care Survey, 1994-1996, special tabulations. Washington, D.C.
U.S. Department of Health and Human Services, National Center for Health Statistics . 1999b. National Hospital Ambulatory Medical Care Survey, 1994-1996, special tabulations. Washington, D.C.
U.S. Department of Health and Human Services, National Center for Health Statistics. 1999c. National Hospital Discharge Survey, 1994, special tabulations. Washington, D.C.


