
TRENDS IN DOCTORATE RECIPIENTS
Selected Demographic Characteristics
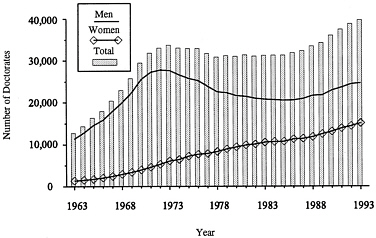
The number of new Ph.D.s increased to an all-time high of 39,754 in 1993. This record continues the upward trend in doctoral attainment that started in 1986 after a period of stagnation during the late 1970s and early 1980s. The doctorates awarded in 1993 were granted by 368 colleges and universities in the United States and Puerto Rico.
-
Women continued to earn increasing numbers of Ph.D.s (15,108 in 1993), while men still fell short of their record number of doctorates in 1972 (24,646 in 1993 compared to 27,754 in 1972).
-
Whereas the number of male Ph.D.s barely doubled from 11,336 to 24,646 over the last three decades, the number of female Ph.D.s increased nearly elevenfold from 1,392 to 15,108. Women's representation grew from 11 percent in 1963 to 38 percent in 1993.
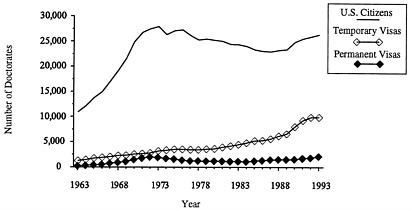
U.S. citizens earned more than two-thirds (26,386) of the doctorates awarded in 1993. However, the share for non-U.S. citizens has increased steadily over the last 30 years, rising from 13 percent (1,605 Ph.D.s) in 1963 to 32 percent (12,173 Ph.D.s) in 1993.
-
In 1993, non-U.S. citizen Ph.D.s on temporary visas outnumbered those on permanent visas by more than four to one—9,923 compared to 2,250. Temporary residents earned 26 percent of all Ph.D.s, whereas permanent residents received only 6 percent. (Note: Temporary residents are nonimmigrants who are granted visas for a specified temporary period of time. Permanent residents are immigrants who are granted legal permanent residence in the United States.)
-
After 14 years of significant annual increases, the number of doctorates earned by temporary residents appears to have leveled off. However, it is too early to determine if this is the beginning of a new trend. Both the number and the proportion of Ph.D.s received by temporary residents were about the same as last year. Since 1963, temporary residents have increased their share of Ph.D.s from 10 to 26 percent.
-
Permanent residents doubled their representation among doctorate recipients from 3 percent in 1963 to 6 percent in 1993. Moreover, permanent residents earned 2,250 degrees in 1993, surpassing their previous high of 2,093 doctorates in 1972.
-
Over half of all non-U.S. Ph.D. recipients originated from four Asian countries: the People's Republic of China (19 percent), Taiwan (12 percent), Korea (12 percent), and India (9 percent). (See Table 4.)
FIGURE 2 Doctorate recipients, by citizenship, 1963–1993.
See technical notes in Appendix C for rates of nonresponse to the question on citizenship status.
SOURCE: National Research Council, Survey of Earned Doctorates.
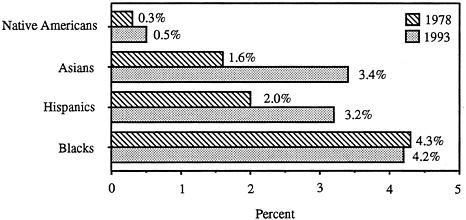
Just over 11 percent of the doctorates awarded to U.S. citizens in 1993 were earned by racial/ethnic minorities—Asians, black Americans, Hispanics, and Native Americans. This represents an increase in minority representation of 3 percentage points since 1978 and a half-point increase since last year.
-
Most U.S. minority groups increased their numbers and proportions of Ph.D.s since 1978 (except for blacks, whose 1993 proportion was just under that in 1978). Asian Ph.D.s experienced the largest growth, more than doubling their representation. (See Appendix Table B-2.)
-
Black Americans received 1,106 degrees in 1993, continuing an increase in awards that began in 1988 (except for a dip of less than 4 percent between 1991 and 1992). This upward trend reversed a period of decline in the number of black Ph.D.s from 1972 to 1987. The 1,106 doctorates awarded in 1993 topped the 1,031 Ph.D.s earned by blacks in 1978 and nearly reached the all-time peak of 1,113 Ph.D.s in 1977. Blacks ' 4.2 percent share of doctorates in 1993 was about the same as in 1978 (4.3 percent) and just slightly less than in the peak year of 1977 (4.4 percent).
-
Of the top 21 institutions (ranked by number of Ph.D.s) that awarded bachelor's degrees to blacks who later received Ph.D.s between 1989 and 1993, 17 are Historically Black Colleges and Universities (HBCUs). Three of the leading Ph.D. institutions (ranked by the number of Ph.D.s) are also HBCUs. (See Tables 6 and 7.)
FIGURE 3 Percentage of doctorates earned by U.S. minorities, 1978 and 1993.
NOTE: Percentages are based on the number of U.S. citizen Ph.D.s with known race/ethnicity. “Native Americans” includes American Indians and Alaskan Natives.
See Appendix Table B-2.
See technical notes in Appendix C for rates of nonresponse to citizenship and race/ethnicity.
SOURCE: National Research Council, Survey of Earned Doctorates.
Field of Doctorate
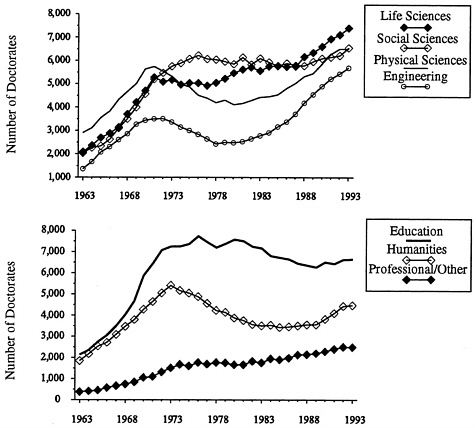
Of the seven broad fields of study profiled in this report, life sciences had the largest number of Ph.D.s-7,397 in 1993. (See Table 2.)
-
Within science and engineering, life sciences outnumbered social sciences (6,545 Ph.D.s), physical sciences (6,496 Ph.D.s), and engineering (5,696 Ph.D.s). Engineering and physical sciences lost ground to the life and social sciences during the 1970s and early 1980s, but began to close the gap in the mid-1980s.
-
Among the nonscience fields in 1993, education continued to outstrip humanities and professional/other fields, producing 6,647 doctorates compared to 4,481 in humanities and 2,492 in professional/other fields. However, the number of Ph.D.s in professional/other fields has increased at a fairly steady rate since 1963, and the number of doctorates in humanities is at its highest level since 1977.
FIGURE 4 Field of doctorate, 1963–1993.
See Table 2.
SOURCE: National Research Council, Survey of Earned Doctorates.
In 1993, doctoral awards to men surpassed those to women in all but one broad field—education. Women predominated in the field of education with 59 percent of all doctorates and neared parity in social sciences and humanities. However, women remained underrepresented in the fields of engineering (9 percent of Ph.D.s), physical sciences (21 percent), and life sciences (42 percent).
-
While women Ph.D.s increased in every broad field over the last 30 years, men experienced major declines after 1973 in social sciences, humanities, and education. Only half as many men received education doctorates in 1993 as in 1973.
FIGURE 5 Field of doctorate, by gender of doctorate recipients, 1963 –1993.
See Table 2.
SOURCE: National Research Council, Survey of Earned Doctorates.
Non-U.S. citizens earned 32 percent of all doctorates awarded in 1993. Their representation varied by field—accounting for 59 percent of Ph.D.s in engineering, 45 percent in physical sciences, and just 11 percent in education. U.S. citizens received more than three-quarters of the doctorates awarded in social sciences, humanities, and education.
-
Among non-U.S. citizens, both permanent and temporary residents were most concentrated in engineering, followed by physical sciences and life sciences. U.S. citizens were most heavily concentrated in education, although they were highly represented in the fields of social and life sciences as well.
FIGURE 6a Citizenship status of doctorate recipients in all fields, 1993.
See Table 3.
See technical notes in Appendix C for rates of nonresponse to the question on citizenship status.
SOURCE: National Research Council, Survey of Earned Doctorates.
FIGURE 6b Broad field composition, by citizenship status of doctorate recipients, 1993.
See Table 3.
See technical notes in Appendix C for rates of nonresponse to the question on citizenship status.
SOURCE: National Research Council, Survey of Earned Doctorates.
Racial/ethnic minorities received 11 percent of all doctorates awarded to U.S. citizens in 1993. As a group, they accounted for 15 percent of the doctorates in education, 14 percent in engineering, and 9 to 10 percent in each of the other broad fields.
-
In 1993, black, Hispanic, and Native American doctorate recipients were most concentrated in the field of education, followed by social sciences. Life sciences and engineering were the leading fields among Asian Americans. (See Table 5.)
-
In 1993, black Americans received more than one-half of the doctorates awarded to minorities in the field of education and professional/other fields; blacks were also the predominant minority recipients of doctorates in the field of social sciences. Asian Americans accounted for well over one-half of minority Ph.D.s in engineering and physical sciences and also earned more doctorates in life sciences than any other minority group. Hispanics were the predominant minority group to receive doctorates in the field of humanities. (See Table 5.)
FIGURE 7 Broad field composition, by minority status of doctorate recipients, 1993.
NOTE: Percentages designate the nonwhite minority representation among U.S. citizens in each field.
See Table 5.
See technical notes in Appendix C for rates of nonresponse to the question on race/ethnicity.
SOURCE: National Research Council, Survey of Earned Doctorates.
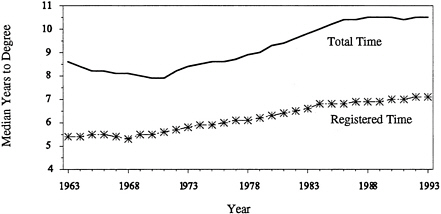
Time-to-Degree
Total time-to-degree (TTD) measures the number of years elapsed between receipt of the baccalaureate and the Ph.D. Registered time-to-degree (RTD) gauges the amount of time actually enrolled in graduate school; RTD includes master's degrees, enrollment in nondegree programs, and time spent working on the dissertation.
-
TTD has remained fairly level since the mid-1980s, while RTD has increased at a slow but steady pace. The median TTD in 1993 was 10.5 years, and the median RTD was 7.1 years.
-
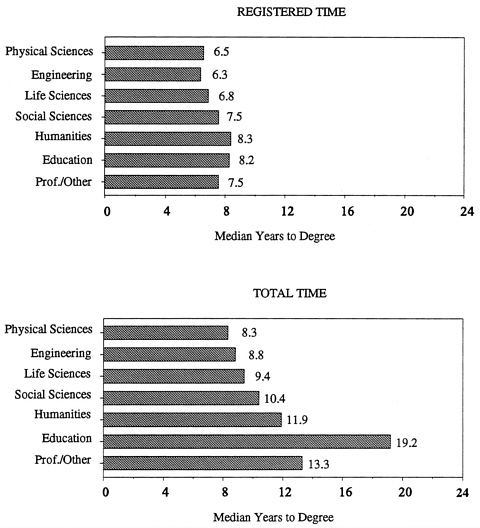
Both TTD and RTD varied considerably by field. In 1993, doctorate recipients in physical sciences had the shortest TTD (8.3 median years), while those in education had the longest (19.2 median years). The shortest RTD was in engineering (6.3 median years), and the longest RTD was in the humanities (8.3 median years).
-
Time-to-degree was shorter for men than for women, though differences in RTD almost disappear for Ph.D.s in the same broad field. Temporary residents exhibited shorter time-to-degree than both permanent residents and U.S. citizens, and Asian Americans had the shortest time-to-degree of all U.S. racial/ethnic groups. (See Table 10.)
FIGURE 8 Median years to doctorate from baccalaureate award, 1963 –1993.
NOTE: A different method of computing TTD using baccalaureate-year cohorts rather than doctorate-year cohorts is discussed in Bowen, W., G.Lord, and J.A.Sosa. 1991. Measuring Time to the Doctorate: A Reinterpretation of the Evidence. Proceedings of the National Academy of Sciences, Vol. 88. Washington, D.C. Pp. 713–717.
See technical notes in Appendix C for rates of nonresponse to the applicable questions.
SOURCE: National Research Council, Survey of Earned Doctorates.
FIGURE 9 Median years to doctorate from baccalaureate award, by broad field, 1993.
NOTE: A different method of computing TTD using baccalaureate-year cohorts rather than doctorate-year cohorts is discussed in Bowen, W., G.Lord, and J.A.Sosa. 1991. Measuring Time to the Doctorate: A Reinterpretation of the Evidence. Proceedings of the National Academy of Sciences, Vol. 88. Washington, D.C. Pp. 713–717.
See technical notes in Appendix C for rates of nonresponse to the applicable questions.
SOURCE: National Research Council, Survey of Earned Doctorates.
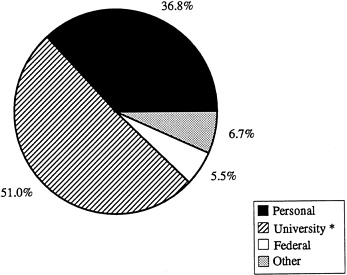
Financial Support
As in the previous two years, university funding (mostly via teaching and research assistantships) was the primary source of graduate school support for the majority of 1993 Ph.D.s (51 percent). Another 37 percent were primarily supported by personal resources (own earnings; family contributions; loans) and the remaining 12 percent by “other ” resources (federal or state governments; nonfederal competitive fellowships; businesses/employers).
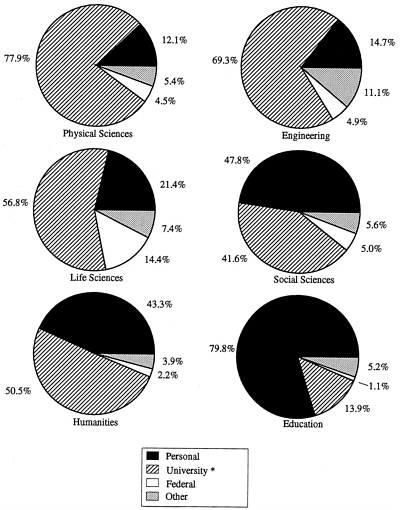
-
The type of primary support varied greatly by field. University sources were most common in the physical and life sciences and in engineering (reported by well over half of recipients). Personal resources were most typical in education (reported by 80 percent of recipients).
-
Male Ph.D. recipients were primarily supported by their university; female recipients were more likely to be self-supporting. Over two-thirds of non-U.S. citizens reported university support as their primary source of financing, whereas U.S. citizens were somewhat more apt to be supported by their own resources. The largest proportion of Ph.D.s in most U.S. racial/ethnic groups also indicated personal funds as their primary source of financial support; however, university funding was the chief means of support for more than half of Asian Americans. These differences were due in part to the field concentrations of the various demographic groups. (See Table 11.)
FIGURE 10a Primary sources of financial support for doctorate recipients in all fields, 1993.
See Table 11.
See technical notes in Appendix C for rates of nonresponse to this question.
*University support also includes research assistantships funded by the federal government.
SOURCE: National Research Council, Survey of Earned Doctorates.
FIGURE 10b Primary sources of financial support for doctorate recipients, by broad field, 1993.
See Table 11.
See technical notes in Appendix C for rates of nonresponse to this question.
*University support also includes research assistantships funded by the federal government.
SOURCE: National Research Council, Survey of Earned Doctorates.
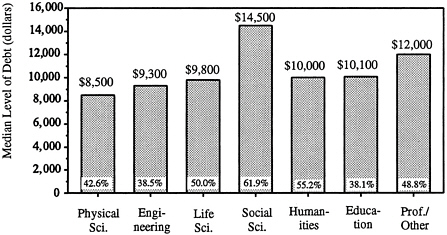
Almost half (48 percent) of all Ph.D.s in 1993 reported debt related to their combined undergraduate and graduate education. Among those with debt, the median level of debt was $10,500.
-
Doctorate recipients in social sciences were the most likely to have incurred educational debt (62 percent), while those in education and engineering were the least likely (about 38 percent in each field). Social scientists also had the highest level of debt (median $14,500); physical scientists had the lowest debt level (median $8,500).
-
Men and women reported debt in equal proportions and had about the same level of debt. Non-U.S. citizens were much less likely to have incurred debt than U.S. citizens, the majority of whom were indebted. Temporary residents reported lower levels of debt than both U.S. citizens and permanent residents. Black and Hispanic Americans were the most likely of U.S. racial/ethnic groups to have educational debt, and their debt levels were the highest. (See Tables 12 and 13.)
FIGURE 11 Median level of educational debt and percentage of Ph.D.s with debt, total and by broad field, 1993.
NOTE: Ph.D.s without debt are not included in the median computations.
See technical notes in Appendix C for rates of nonresponse to the question on debt.
SOURCE: National Research Council, Survey of Earned Doctorates.
Postgraduation Plans
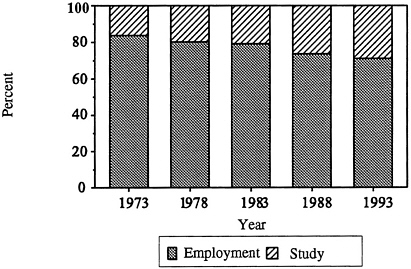
Of those Ph.D.s in 1993 who reported definite postgraduation commitments, 71 percent planned to be employed while 29 percent planned postdoctoral study. (Note: Postdoctoral appointments are considered to be postdoctoral study rather than employment in this report.) The proportion of new Ph.D.s with employment plans was significantly lower than 20 years ago, when 84 percent intended to work after graduation and only 16 percent planned further study.
-
Doctorate recipients in education and professional/other fields were the most likely to have work plans (97 percent), followed closely by Ph.D.s in the humanities (93 percent). Study plans were by far most common in the life sciences (64 percent).
-
The majority of Ph.D.s in every demographic group planned to work rather than pursue further study after graduation. However, women were more inclined towards employment than were men, and U.S. citizens were more apt to work than were foreign citizens. A significant proportion of temporary residents (39 percent) planned to continue their education. Among the aggregate of U.S. citizens and permanent residents, Native Americans and blacks had the largest proportions with work plans (about 85 percent each), and Asians had the largest proportion with study plans (39 percent). (See Table 15.)
FIGURE 12 Postgraduation commitments of doctorate recipients for selected years, 1973–1993.
NOTE: Only Ph.D.s with definite commitments are included Percentages are based on the number of Ph.D.s whose specific plans are known.
See technical notes in Appendix C for rates of nonresponse to the applicable questions and for further explanation of postgraduation plans.
SOURCE: National Research Council, Survey of Earned Doctorates.
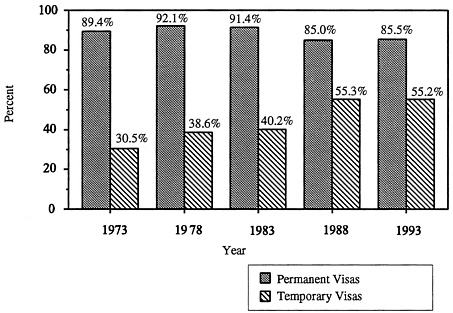
In 1993, permanent residents who reported definite postdoctoral commitments were much more likely than temporary residents with commitments to have plans to remain in the United States (86 percent versus 55 percent). However, the proportion of temporary resident Ph.D.s intending to stay was nearly double the proportion in 1973 (31 percent). (Note: Temporary residents are allowed to extend their stay in the United States after receipt of the Ph.D. for additional study or work experience; however, they cannot remain indefinitely without a change in visa status.) Among permanent residents, the percentage of Ph.D.s with plans to stay in the United States was somewhat lower than 20 years ago.
-
Postdoctoral study was planned by over half of the temporary residents who intended to remain in the United States, while permanent residents were nearly twice as apt to work as to study. (See Table 17.)
FIGURE 13 Percentage of non-U.S. citizen doctorate recipients with definite plans to remain in the United States after graduation, by visa status for selected years, 1973–1993.
NOTE: Only Ph.D.s with definite commitments are included in the percentage computations.
See technical notes in Appendix C for rates of nonresponse to the applicable questions.
SOURCE: National Research Council, Survey of Earned Doctorates.
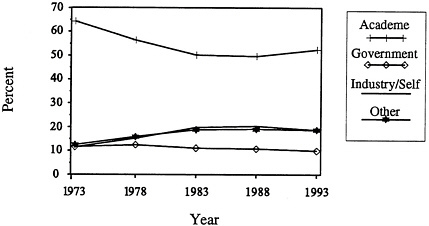
In 1993 as in earlier years, academe was the primary employer of U.S. citizens and permanent residents who had definite commitments for employment in the United States after graduation. However, the proportion of Ph.D.s planning to work in academe was smaller than 20 years ago (53 percent in 1993 versus 64 percent in 1973).
-
Plans for employment in industry (including self-employment) increased over the last two decades, from 12 percent of Ph.D.s in 1973 to 19 percent of Ph.D.s in 1993. “Other” employment sectors (namely K-12 schools and nonprofit organizations) attracted the same proportion of Ph.D.s as industry in 1993.
-
The sector of planned employment varied by field. In 1993, academic employment plans were most common among Ph.D.s in the humanities (85 percent) and professional/other fields (76 percent). Industry was most frequently reported by engineers (56 percent) and physical scientists (50 percent). (See Table 18.)
-
Whereas academic employment plans were more prevalent among women than men (58 percent versus 48 percent), the proportion of men in industry (24 percent) was twice that of women. The majority of Ph.D.s in every racial/ethnic group but Asians reported plans to work in academe. While Asians also favored academic employment (44 percent), their proportion in industry (41 percent) was nearly as large. Note that the sectors of concentration for the various demographic groups reflect the doctoral fields of the Ph.D.s. in these groups. (See Table 19.)
FIGURE 14 Employment sector of doctorate recipients with postgraduation commitments in the United States for selected years, 1973–1993 (U.S. citizens and permanent residents).
NOTE: Only Ph.D.s with definite commitments for employment are included. Foreign locations are excluded. Percentages are based on the number of Ph.D.s whose employment sector is known. Government includes U.S. federal, state, and local agencies.
See technical notes in Appendix C for rates of nonresponse to this question.
SOURCE: National Research Council, Survey of Earned Doctorates.
Tables
Page
|
1 |
Doctorates Awarded by U.S. Colleges and Universities, 1963–1993 |
|||
|
2 |
Gender of Doctorate Recipients, by Broad Field for Selected Years, 1963–1993 |
|||
|
3 |
Citizenship Status of Doctorate Recipients, by Broad Field for Selected Years, 1963–1993 |
|||
|
4 |
Leading Countries of Origin of Non-U.S. Citizens Earning Ph.D.sat U.S. Colleges and Universities, 1993 (ranked on number of Ph.D.s) |
|||
|
5 |
Race/Ethnicity of U.S. Citizen Ph.D.s, by Major Doctorate Field, 1993 |
|||
|
6 |
Leading U.S. Baccalaureate Institutions of U.S. Minority Ph.D.s, 1989–1993 (ranked on number of Ph.D.s) |
|||
|
7 |
Leading Ph.D. Institutions of U.S. Minority Ph.D.s, 1989–1993 (ranked on number of Ph.D.s) |
|||
|
8 |
Major Doctorate Field for Selected Years, 1963–1993 |
|||
|
9 |
Median Years to Doctorate from Baccalaureate Award, by Broad Field for Selected Years, 1963–1993 |
|||
|
10 |
Median Years to Doctorate from Baccalaureate Award, by Demographic Group and Broad Field, 1993 |
|||
|
11 |
Primary Sources of Support for Doctorate Recipients, by Broad Field and Demographic Group, 1993 |
|||
|
12 |
Median Level of Debt Related to the Education of Doctorate Recipients, 1993 |
|||
|
13 |
Cumulative Level of Debt Related to the Education of Doctorate Recipients, 1993 |
|||
|
14 |
Postgraduation Commitments of Doctorate Recipients, by Type of Plans and Broad Field for Selected Years, 1973–1993 |
|||
|
15 |
Postgraduation Commitments of Doctorate Recipients, by Type of Plans and Demographic Group for Selected Years, 1973–1993 |
|||
|
16 |
Postdoctoral Location of Non-U.S. Citizen Doctorate Recipients with Postgraduation Commitments, by Visa Status for Selected Years, 1973 –1993 |
|||
|
17 |
Postdoctoral Location of Non-U.S. Citizen Doctorate Recipients with Postgraduation Commitments, by Major Field and Visa Status, 1993 |
|||
|
18 |
Employment Sector of Doctorate Recipients with Postgraduation Commitments in the United States, by Broad Field for Selected Years, 1973–1993 (U.S. citizens and permanent residents) |
|||
|
19 |
Employment Sector of Doctorate Recipients with Postgraduation Commitments in the United States, by Demographic Group for Selected Years, 1973 –1993 |
TABLE 1 Doctorates Awarded by U.S. Colleges and Universities, 1963 –1993
|
Year |
Number |
Year |
Number |
Year |
Number |
Year |
Number |
|
1963 |
12,728 |
1971 |
31,867 |
1979 |
31,239 |
1987 |
32,367 |
|
1964 |
14,325 |
1972 |
33,041 |
1980 |
31,020 |
1988 |
33,499 |
|
1965 |
16,340 |
1973 |
33,755 |
1981 |
31,356 |
1989 |
34,324 |
|
1966 |
17,949 |
1974 |
33,047 |
1982 |
31,111 |
1990 |
36,068 |
|
1967 |
20,403 |
1975 |
32,952 |
1983 |
31,282 |
1991 |
37,517 |
|
1968 |
22,937 |
1976 |
32,946 |
1984 |
31,337 |
1992 |
38,853 |
|
1969 |
25,743 |
1977 |
31,716 |
1985 |
31,298 |
1993 |
39,754 |
|
1970 |
29,498 |
1978 |
30,875 |
1986 |
31,899 |
||
|
SOURCE: National Research Council, Survey of Earned Doctorates. |
|||||||
TABLE 2 Gender of Doctorate Recipients, by Broad Field for Selected Years, 1963–1993
|
Field/Gender |
1963 |
1968 |
1973 |
1978 |
1983 |
1988 |
1993 |
|
All Fields |
12,728 |
22,937 |
33,755 |
30,875 |
31,282 |
33,499 |
39,754 |
|
Men |
11,336 |
20,005 |
27,670 |
22,553 |
20,749 |
21,681 |
24,646 |
|
Women |
1,392 |
2,932 |
6,085 |
8,322 |
10,533 |
11,818 |
15,108 |
|
Physical Sciences* |
2,910 |
4,653 |
5,311 |
4,193 |
4,426 |
5,309 |
6,496 |
|
Men |
2,786 |
4,420 |
4,929 |
3,754 |
3,809 |
4,430 |
5,152 |
|
Women |
124 |
233 |
382 |
439 |
617 |
879 |
1,344 |
|
Engineering |
1,357 |
2,855 |
3,364 |
2,423 |
2,781 |
4,187 |
5,696 |
|
Men |
1,347 |
2,843 |
3,318 |
2,370 |
2,657 |
3,901 |
5,175 |
|
Women |
10 |
12 |
46 |
53 |
124 |
286 |
521 |
|
Life Sciences |
2,083 |
3,707 |
5,168 |
5,041 |
5,554 |
6,165 |
7,397 |
|
Men |
1,876 |
3,197 |
4,246 |
3,882 |
3,833 |
3,894 |
4,311 |
|
Women |
207 |
510 |
922 |
1,159 |
1,721 |
2,271 |
3,086 |
|
Social Sciences |
2,027 |
3,495 |
5,757 |
6,038 |
6,095 |
5,781 |
6,545 |
|
Men |
1,763 |
2,941 |
4,546 |
4,177 |
3,689 |
3,179 |
3,316 |
|
Women |
264 |
554 |
1,211 |
1,861 |
2,406 |
2,602 |
3,229 |
|
Humanities |
1,842 |
3,467 |
5,414 |
4,231 |
3,500 |
3,556 |
4,481 |
|
Men |
1,538 |
2,735 |
3,864 |
2,635 |
1,969 |
1,981 |
2,351 |
|
Women |
304 |
732 |
1,550 |
1,596 |
1,531 |
1,575 |
2,130 |
|
Education |
2,137 |
4,029 |
7,238 |
7,194 |
7,174 |
6,359 |
6,647 |
|
Men |
1,720 |
3,228 |
5,455 |
4,339 |
3,555 |
2,846 |
2,743 |
|
Women |
417 |
801 |
1,783 |
2,855 |
3,619 |
3,513 |
3,904 |
|
Professional/Other |
372 |
731 |
1,503 |
1,755 |
1,752 |
2,142 |
2,492 |
|
Men |
306 |
641 |
1,312 |
1,396 |
1,237 |
1,450 |
1,598 |
|
Women |
66 |
90 |
191 |
359 |
515 |
692 |
894 |
|
*Includes mathematics and computer sciences. SOURCE: National Research Council, Survey of Earned Doctorates. |
|||||||
TABLE 3 Citizenship Status of Doctorate Recipients, by Broad Field for Selected Years, 1963–1993
|
Field/Citizenship |
1963 |
1968 |
1973 |
1978 |
1983 |
1988 |
1993 |
|
All Fields |
12,728 |
22,937 |
33,755 |
30,875 |
31,282 |
33,499 |
39,754 |
|
U.S. Citizens |
10,925 |
19,229 |
27,914 |
25,291 |
24,359 |
23,290 |
26,386 |
|
Permanent Residents |
354 |
1,046 |
1,998 |
1,344 |
1,275 |
1,622 |
2,250 |
|
Temporary Residents |
1,251 |
2,268 |
3,174 |
3,421 |
4,499 |
6,194 |
9,923 |
|
Unknown Citizenship |
198 |
394 |
669 |
819 |
1,149 |
2,393 |
1,195 |
|
Physical Sciences* |
2,910 |
4,653 |
5,311 |
4,193 |
4,426 |
5,309 |
6,496 |
|
U.S. Citizens |
2,437 |
3,865 |
4,101 |
3,200 |
3,138 |
3,238 |
3,475 |
|
Permanent Residents |
74 |
187 |
433 |
257 |
223 |
252 |
455 |
|
Temporary Residents |
339 |
510 |
683 |
646 |
926 |
1,483 |
2,363 |
|
Unknown Citizenship |
60 |
91 |
94 |
90 |
139 |
336 |
203 |
|
Engineering |
1,357 |
2,855 |
3,364 |
2,423 |
2,781 |
4,187 |
5,696 |
|
U.S. Citizens |
1,042 |
2,105 |
2,142 |
1,261 |
1,163 |
1,780 |
2,225 |
|
Permanent Residents |
85 |
273 |
557 |
325 |
319 |
366 |
466 |
|
Temporary Residents |
215 |
436 |
622 |
768 |
1,170 |
1,721 |
2,783 |
|
Unknown Citizenship |
15 |
41 |
43 |
69 |
129 |
320 |
222 |
|
Life Sciences |
2,083 |
3,707 |
5,168 |
5,041 |
5,554 |
6,165 |
7,397 |
|
U.S. Citizens |
1,688 |
2,894 |
4,062 |
4,030 |
4,437 |
4,407 |
4,827 |
|
Permanent Residents |
60 |
186 |
367 |
215 |
191 |
305 |
419 |
|
Temporary Residents |
319 |
585 |
649 |
668 |
776 |
1,069 |
1,988 |
|
Unknown Citizenship |
16 |
42 |
90 |
128 |
150 |
384 |
163 |
|
Social Sciences |
2,027 |
3,495 |
5,757 |
6,038 |
6,095 |
5,781 |
6,545 |
|
U.S. Citizens |
1,749 |
2,961 |
4,885 |
5,118 |
5,047 |
4,349 |
4,943 |
|
Permanent Residents |
66 |
149 |
236 |
211 |
191 |
223 |
323 |
|
Temporary Residents |
165 |
310 |
519 |
488 |
570 |
709 |
1,074 |
|
Unknown Citizenship |
47 |
75 |
117 |
221 |
287 |
500 |
205 |
|
Humanities |
1,842 |
3,467 |
5,414 |
4,231 |
3,500 |
3,556 |
4,481 |
|
U.S. Citizens |
1,700 |
3,105 |
4,817 |
3,780 |
2,984 |
2,796 |
3,510 |
|
Permanent Residents |
35 |
147 |
232 |
139 |
118 |
168 |
267 |
|
Temporary Residents |
71 |
152 |
251 |
198 |
258 |
350 |
568 |
|
Unknown Citizenship |
36 |
63 |
114 |
114 |
140 |
242 |
136 |
|
Education |
2,137 |
4,029 |
7,238 |
7,194 |
7,174 |
6,359 |
6,647 |
|
U.S. Citizens |
2,005 |
3,736 |
6,724 |
6,498 |
6,246 |
5,298 |
5,746 |
|
Permanent Residents |
20 |
54 |
105 |
128 |
148 |
177 |
175 |
|
Temporary Residents |
98 |
184 |
290 |
412 |
555 |
480 |
546 |
|
Unknown Citizenship |
14 |
55 |
119 |
156 |
225 |
404 |
180 |
|
Professional/Other |
372 |
731 |
1,503 |
1,755 |
1,752 |
2,142 |
2,492 |
|
U.S. Citizens |
304 |
563 |
1,183 |
1,404 |
1,344 |
1,422 |
1,660 |
|
Permanent Residents |
14 |
50 |
68 |
69 |
85 |
131 |
145 |
|
Temporary Residents |
44 |
91 |
160 |
241 |
244 |
382 |
601 |
|
Unknown Citizenship |
10 |
27 |
92 |
41 |
79 |
207 |
86 |
|
NOTE: See technical notes in Appendix C for rates of nonresponse to the question on citizenship status. *Includes mathematics and computer sciences. SOURCE: National Research Council, Survey of Earned Doctorates. |
|||||||
TABLE 4 Leading Countries of Origin of Non-U.S. Citizens Earning Ph.D.s at U.S. Colleges and Universities, 1993 (ranked on number of Ph.D.s)
|
Country |
Number |
Country |
Number |
||
|
1. |
People's Republic of China* |
2,254 |
16. |
France |
136 |
|
2. |
Taiwan, Republic of China* |
1,452 |
17. |
Pakistan |
132 |
|
3. |
Republic of Korea† |
1,405 |
18. |
Israel |
126 |
|
4. |
India |
1,134 |
19. |
Nigeria |
117 |
|
5. |
Canada |
485 |
20. |
Indonesia |
107 |
|
6. |
Germany |
249 |
21. |
Egypt |
107 |
|
7. |
Iran |
239 |
22. |
Italy |
101 |
|
8. |
England |
224 |
23. |
Malaysia |
101 |
|
9. |
Greece |
199 |
24. |
Spain |
100 |
|
10. |
Japan |
182 |
25. |
Jordan |
98 |
|
11. |
Brazil |
180 |
26. |
Sri Lanka |
97 |
|
12. |
Mexico |
162 |
27. |
The Philippines |
92 |
|
13. |
Turkey |
157 |
28. |
Australia |
91 |
|
14. |
Hong Kong |
137 |
29. |
Saudi Arabia |
83 |
|
15. |
Thailand |
137 |
30. |
The Netherlands |
69 |
|
Top 30 Countries of Origin |
10,153 |
||||
|
Total Countries Reported (145) |
12,001 |
||||
|
NOTE: The total number of non-U.S. citizens who earned doctorates in 1993 was 12,173; nearly all (12,001 Ph.D.s) reported their country of origin. See technical notes in Appendix C for rates of nonresponse to the questions on country of citizenship and citizenship status. *An additional 176 Ph.D.s indicated “China” as their country of citizenship, but the specific origin could not be determined. Thus, data for these recipients were excluded from the table. †Includes “Korea, unspecified.” The Democratic People's Republic of Korea (North Korea) does not permit its citizens to study in the United States. SOURCE: National Research Council, Survey of Earned Doctorates. |
|||||
TABLE 5 Race/Ethnicity of U.S. Citizen Ph.D.s, by Major Doctorate Field, 1993
|
Field |
Total Ph.D.s |
Known Race/ Ethnicity |
Asians |
Blacks |
Hispanics |
Native Amers.* |
Whites |
|
All Fields |
26,386 |
26,152 |
891 |
1,106 |
834 |
119 |
23,202 |
|
Physical Sciences |
3,475 |
3,432 |
182 |
41 |
89 |
11 |
3,109 |
|
Physics/Astronomy |
810 |
799 |
45 |
9 |
22 |
3 |
720 |
|
Chemistry |
1,272 |
1,259 |
76 |
19 |
45 |
2 |
1,117 |
|
Earth, Atmos., & Marine Sci. |
473 |
469 |
6 |
3 |
8 |
4 |
448 |
|
Mathematics |
496 |
488 |
28 |
5 |
9 |
1 |
445 |
|
Computer Sciences |
424 |
417 |
27 |
5 |
5 |
1 |
379 |
|
Engineering |
2,225 |
2,205 |
218 |
41 |
56 |
2 |
1,888 |
|
Life Sciences |
4,827 |
4,782 |
219 |
122 |
126 |
14 |
4,301 |
|
Biological Sciences |
3,445 |
3,406 |
190 |
63 |
93 |
7 |
3,053 |
|
Health Sciences |
880 |
877 |
19 |
52 |
19 |
6 |
781 |
|
Agricultural Sciences |
502 |
499 |
10 |
7 |
14 |
1 |
467 |
|
Social Sciences |
4,943 |
4,906 |
104 |
205 |
182 |
19 |
4,396 |
|
Psychology |
3,066 |
3,050 |
52 |
117 |
120 |
15 |
2,746 |
|
Anthropology |
279 |
279 |
3 |
7 |
10 |
2 |
257 |
|
Economics |
388 |
386 |
17 |
13 |
10 |
0 |
346 |
|
Poli. Sci. & Int'l. Relations |
389 |
384 |
9 |
18 |
13 |
0 |
344 |
|
Sociology |
348 |
341 |
10 |
23 |
15 |
0 |
293 |
|
Other Social Sciences |
473 |
466 |
13 |
27 |
14 |
2 |
410 |
|
Humanities |
3,510 |
3,469 |
60 |
95 |
130 |
13 |
3,171 |
|
History |
599 |
592 |
7 |
17 |
21 |
1 |
546 |
|
Amer. & Eng. Lang. & Lit. |
819 |
813 |
15 |
18 |
20 |
1 |
759 |
|
Foreign Lang. & Lit. |
376 |
374 |
4 |
2 |
51 |
1 |
316 |
|
Other Humanities |
1,716 |
1,690 |
34 |
58 |
38 |
10 |
1,550 |
|
Education |
5,746 |
5,716 |
82 |
512 |
211 |
50 |
4,861 |
|
Teacher Education |
383 |
382 |
5 |
35 |
16 |
4 |
322 |
|
Teaching Fields |
742 |
737 |
7 |
38 |
27 |
2 |
663 |
|
Other Education |
4,621 |
4,597 |
70 |
439 |
168 |
44 |
3,876 |
|
Professional/Other |
1,660 |
1,642 |
26 |
90 |
40 |
10 |
1,476 |
|
Business & Management |
764 |
758 |
14 |
24 |
13 |
5 |
702 |
|
Communications |
239 |
237 |
4 |
15 |
9 |
4 |
205 |
|
Other Professional Fields |
642 |
632 |
8 |
50 |
17 |
1 |
556 |
|
Other Fields |
15 |
15 |
0 |
1 |
1 |
0 |
13 |
|
NOTE: See technical notes in Appendix C for rates of nonresponse to the question on race/ethnicity. * “Native Americans” includes American Indians and Alaskan Natives. SOURCE: National Research Council, Survey of Earned Doctorates. |
|||||||
TABLE 6 Leading U.S. Baccalaureate Institutions of U.S. Minority Ph.D.s, 1989–1993 (ranked on number of Ph.D.s)
|
Institution |
Number |
Institution |
Number |
|
Asians |
Hispanics |
||
|
Univ. of California-Berkeley |
239 |
Univ. of Puerto Rico-Rio Piedras |
497 |
|
Univ. of Hawaii-Manoa |
123 |
Univ. of Puerto Rico-Mayaguez |
79 |
|
Univ. of California-Los Angeles |
110 |
Univ. of California-Berkeley |
62 |
|
Massachusetts Inst. of Technology |
98 |
Univ. of Texas- Austin |
54 |
|
Harvard Univ. |
66 |
Univ. of New Mexico |
50 |
|
Cornell Univ. |
60 |
Univ. of Miami |
47 |
|
Univ. of Illinois-Urbana/Champaign |
57 |
Univ. of California-Los Angeles |
46 |
|
California Inst. of Technology |
53 |
Catholic Univ. of Puerto Rico |
40 |
|
Univ. of California-Davis |
52 |
California State Univ.-Los Angeles |
35 |
|
Univ. of Washington |
50 |
City Univ. of NY-City College |
34 |
|
Stanford Univ. |
41 |
Univ. of California-Santa Barbara |
34 |
|
Yale Univ. |
40 |
Univ. of Arizona |
33 |
|
Univ. of Michigan |
40 |
Princeton Univ. |
30 |
|
Univ. of California-Irvine |
39 |
Univ. of Florida |
30 |
|
Univ. of Southern California |
36 |
Inter American Univ.-San German |
29 |
|
Univ. of Chicago |
35 |
Cornell Univ. |
27 |
|
Univ. of Maryland-College Park |
34 |
New York Univ. |
27 |
|
Univ. of Wisconsin-Madison |
27 |
Florida International Univ. |
27 |
|
Northwestern Univ. |
25 |
Univ. of Texas-El Paso |
27 |
|
Princeton Univ. |
24 |
Univ. of California-Irvine |
26 |
|
Johns Hopkins Univ. |
24 |
||
|
Top 20 U.S. Institutions |
1,234 |
||
|
Top 21 U.S. Institutions |
1,273 |
Total U.S. Institutions Reported (632) |
3,398 |
|
Total U.S. Institutions Reported (456) |
2,743 |
||
|
Native Americans |
|||
|
Blacks |
|||
|
Oklahoma State Univ. |
16 |
||
|
Howard Univ.* |
123 |
Northeastern State Univ. |
15 |
|
Hampton Univ.* |
67 |
Univ. of Oklahoma |
13 |
|
Spelman College* |
67 |
Pembroke State Univ. |
9 |
|
North Carolina A & T St. Univ.* |
63 |
Univ. of Central Oklahoma |
9 |
|
Tuskegee Univ.* |
60 |
Univ. of Montana |
8 |
|
Wayne State Univ. |
57 |
Univ. of California-Berkeley |
8 |
|
Southern Univ. & A&M Univ.-Baton Rouge* |
53 |
Northern Arizona Univ. |
7 |
|
North Carolina Central Univ.* |
49 |
Univ. of Arkansas-Fayetteville |
6 |
|
South Carolina State Univ.* |
48 |
Univ. of Colorado-Boulder |
6 |
|
Fisk Univ.* |
46 |
Univ. of Arizona |
6 |
|
Florida A & M Univ.* |
44 |
California State Univ.-Long Beach |
6 |
|
Texas Southern Univ.* |
44 |
Univ. of California-Los Angeles |
6 |
|
Morgan State Univ.* |
43 |
Univ. of California-Santa Barbara |
6 |
|
Tennessee State Univ.* |
43 |
Syracuse Univ. |
5 |
|
Chicago State Univ. |
42 |
Univ. of Michigan |
5 |
|
Jackson State Univ.* |
42 |
Western Washington Univ. |
5 |
|
Virginia State Univ.* |
41 |
||
|
Univ. of the District of Columbia* |
36 |
Top 17 U.S. Institutions |
136 |
|
Univ. of Michigan |
35 |
Total U.S. Institutions Reported (331) |
587 |
|
Univ. of Maryland-College Park |
33 |
||
|
Clark Atlanta Univ.* |
33 |
||
|
Note: Approximately 1,850 U.S. institutions awarded baccalaureate degrees to Ph.D. recipients from 1989 to 1993. |
|||
|
Top 21 U.S. Institutions |
1,069 |
||
|
Total U.S. Institutions Reported (809) |
4,679 |
||
|
NOTE: See technical notes in Appendix C for total numbers of U.S. minority Ph.D.s in this period, numbers reporting foreign institutions, and nonresponse rates to baccalaureate institution, citizenship, and race/ethnicity. *This institution is one of the “Historically Black Colleges and Universities” (HBCUs) that were founded in the late 1800s and early 1900s during legal segregation for the specific purpose of educating blacks. There are currently 103 HBCUs, 90 of which award baccalaureates. SOURCE: National Research Council, Survey of Earned Doctorates. |
|||
TABLE 7 Leading Ph.D. Institutions of U.S. Minority Ph.D.s, 1989–1993 (ranked on number of Ph.D.s)
|
Institution |
Number |
Institution |
Number |
|
Asians |
Hispanics |
||
|
Univ. of California-Berkeley |
201 |
Univ. of Texas-Austin |
112 |
|
Univ. of California-Los Angeles |
185 |
Univ. of California-Los Angeles |
103 |
|
Stanford Univ. |
151 |
Univ. of Puerto Rico-Rio Piedras |
103 |
|
Univ. of Southern California |
103 |
Univ. of California-Berkeley |
97 |
|
Univ. of Illinois-Urbana/Champaign |
101 |
Texas A & M Univ. |
87 |
|
Massachusetts Inst. of Technology |
81 |
Univ. of Massachusetts-Amherst |
83 |
|
Harvard Univ. |
79 |
New York Univ. |
68 |
|
Univ. of Hawaii-Manoa |
74 |
Univ. of Michigan |
66 |
|
Univ. of Washington |
69 |
Harvard Univ. |
63 |
|
Univ. of Michigan |
63 |
Univ. of Southern California |
62 |
|
Cornell Univ. |
60 |
Univ. of Wisconsin-Madison |
58 |
|
Univ. of California-Davis |
58 |
CUNY-Grad. School & Univ. Center |
57 |
|
Univ. of Maryland-College Park |
50 |
Univ. of Miami |
55 |
|
Northwestern Univ. |
49 |
Univ. of New Mexico |
55 |
|
Univ. of Minnesota-Minneapolis |
49 |
Stanford Univ. |
54 |
|
Univ. of Pennsylvania |
48 |
Fordham Univ. |
52 |
|
Purdue Univ. |
48 |
Penn State Univ. |
51 |
|
Univ. of Texas-Austin |
48 |
Columbia Teachers College |
47 |
|
Univ. of California-Irvine |
48 |
Cornell Univ. |
46 |
|
Univ. of California-San Diego |
48 |
Univ. of Arizona |
45 |
|
Top 20 Institutions |
1,613 |
Top 20 Institutions |
1,364 |
|
Total Institutions Reported (277) |
3,781 |
Total Institutions Reported (268) |
3,645 |
|
Blacks |
Native Americans |
||
|
Howard Univ.* |
164 |
Oklahoma State Univ. |
23 |
|
Clark Atlanta Univ.* |
156 |
Univ. of Oklahoma |
18 |
|
Nova Univ. |
139 |
Penn State Univ. |
13 |
|
Columbia Teachers College |
130 |
Northern Arizona Univ. |
13 |
|
Univ. of Maryland-College Park |
121 |
Indiana Univ.-Bloomington |
10 |
|
Ohio State Univ. |
108 |
Univ. of Wisconsin-Madison |
10 |
|
Wayne State Univ. |
94 |
Univ. of California-Berkeley |
10 |
|
Univ. of Massachusetts-Amherst |
86 |
Stanford Univ. |
10 |
|
Temple Univ. |
79 |
Univ. of Illinois-Urbana/Champaign |
9 |
|
Univ. of Michigan |
77 |
Univ. of North Carolina-Chapel Hill |
9 |
|
Univ. of Pittsburgh |
73 |
Univ. of Washington |
9 |
|
Florida State Univ. |
71 |
Univ. of South Dakota |
8 |
|
Univ. of North Carolina-Chapel Hill |
69 |
North Carolina State Univ.-Raleigh |
8 |
|
Texas Southern Univ.* |
67 |
Univ. of Texas-Austin |
8 |
|
George Washington Univ. |
60 |
Arizona State Univ. |
8 |
|
Univ. of California-Berkeley |
57 |
Univ. of Oregon |
8 |
|
Univ. of South Carolina |
54 |
Univ. of California-Los Angeles |
8 |
|
Michigan State Univ. |
53 |
||
|
Univ. of Texas-Austin |
53 |
Top 17 Institutions |
182 |
|
Harvard Univ. |
52 |
Total Institutions Reported (189) |
588 |
|
Univ. of Florida |
52 |
||
|
Top 21 Institutions |
1,815 |
Note: 377 institutions awarded doctorates between 1989 and 1993. |
|
|
Total Institutions Reported (268) |
4,789 |
||
|
NOTE: See technical notes in Appendix C for nonresponse rates to citizenship and race/ethnicity. *This institution is one of the “Historically Black Colleges and Universities” (HBCUs) that were founded in the late 1800s and early 1900s during legal segregation for the specific purpose of educating blacks. There are currently 103 HBCUs, 11 of which award doctorates. SOURCE: National Research Council, Survey of Earned Doctorates. |
|||
TABLE 8 Major Doctorate Field for Selected Years, 1963–1993
|
Field |
1963 |
1968 |
1973 |
1978 |
1983 |
1988 |
1993 |
|
All Fields |
12,728 |
22,937 |
33,755 |
30,875 |
31,282 |
33,499 |
39,754 |
|
Physical Sciences |
2,910 |
4,653 |
5,311 |
4,193 |
4,426 |
5,309 |
6,496 |
|
Physics/Astronomy |
817 |
1,436 |
1,589 |
1,067 |
1,043 |
1,302 |
1,543 |
|
Chemistry |
1,288 |
1,803 |
1,855 |
1,544 |
1,759 |
2,015 |
2,139 |
|
Earth, Atmos., & Marine Sci. |
322 |
443 |
634 |
623 |
637 |
728 |
790 |
|
Mathematics |
483 |
971 |
1,232 |
838 |
701 |
749 |
1,146 |
|
Computer Sciences* |
N/A |
N/A |
1 |
121 |
286 |
515 |
878 |
|
Engineering |
1,357 |
2,855 |
3,364 |
2,423 |
2,781 |
4,187 |
5,696 |
|
Life Sciences |
2,083 |
3,707 |
5,168 |
5,041 |
5,554 |
6,165 |
7,397 |
|
Biological Sciences |
1,510 |
2,827 |
3,648 |
3,516 |
3,741 |
4,112 |
5,090 |
|
Health Sciences |
107 |
196 |
486 |
512 |
640 |
882 |
1,201 |
|
Agricultural Sciences |
466 |
684 |
1,034 |
1,013 |
1,173 |
1,171 |
1,106 |
|
Social Sciences |
2,027 |
3,495 |
5,757 |
6,038 |
6,095 |
5,781 |
6,545 |
|
Psychology |
890 |
1,464 |
2,458 |
3,055 |
3,347 |
3,074 |
3,419 |
|
Anthropology |
82 |
138 |
326 |
399 |
373 |
325 |
342 |
|
Economics |
450 |
747 |
942 |
800 |
813 |
852 |
930 |
|
Poli. Sci. & Int'l. Relations |
290 |
580 |
908 |
695 |
473 |
469 |
609 |
|
Sociology |
211 |
370 |
599 |
610 |
525 |
449 |
513 |
|
Other Social Sciences |
104 |
196 |
524 |
479 |
564 |
612 |
732 |
|
Humanities |
1,842 |
3,467 |
5,414 |
4,231 |
3,500 |
3,556 |
4,481 |
|
History |
389 |
741 |
1,216 |
852 |
616 |
603 |
728 |
|
Amer. & Eng. Lang. & Lit. |
492 |
930 |
1,414 |
1,025 |
715 |
717 |
948 |
|
Foreign Lang. & Lit. |
206 |
526 |
917 |
637 |
504 |
430 |
577 |
|
Other Humanities |
755 |
1,270 |
1,867 |
1,717 |
1,665 |
1,806 |
2,228 |
|
Education |
2,137 |
4,029 |
7,238 |
7,194 |
7,174 |
6,359 |
6,647 |
|
Teacher Education |
206 |
493 |
675 |
551 |
483 |
473 |
428 |
|
Teaching Fields |
578 |
984 |
1,536 |
1,352 |
1,327 |
988 |
940 |
|
Other Education |
1,353 |
2,552 |
5,027 |
5,291 |
5,364 |
4,898 |
5,279 |
|
Professional/Other |
372 |
731 |
1,503 |
1,755 |
1,752 |
2,142 |
2,492 |
|
Business & Management |
224 |
440 |
785 |
713 |
750 |
1,033 |
1,280 |
|
Communications |
13 |
49 |
199 |
292 |
250 |
247 |
322 |
|
Other Professional Fields |
123 |
203 |
446 |
736 |
730 |
812 |
863 |
|
Other Fields |
12 |
39 |
73 |
14 |
22 |
50 |
27 |
|
*“Computer sciences” first appeared on the survey form in 1978. However, the number shown for 1978 may be lower than the actual number in the field because some Ph.D.s filled out questionnaires from earlier years. The single count in 1973 represents a late receipt of data on a survey form that included the computer science field. SOURCE: National Research Council, Survey of Earned Doctorates. |
|||||||
TABLE 9 Median Years to Doctorate from Baccalaureate Award, by Broad Field for Selected Years, 1963–1993
|
Field |
1963 |
1968 |
1973 |
1978 |
1983 |
1988 |
1993 |
|
All Fields |
|||||||
|
Registered |
5.4 |
5.3 |
5.8 |
6.1 |
6.6 |
6.9 |
7.1 |
|
Total |
8.6 |
8.1 |
8.4 |
8.9 |
9.8 |
10.5 |
10.5 |
|
Physical Sciences* |
|||||||
|
Registered |
5.1 |
5.1 |
5.7 |
5.8 |
6.0 |
6.2 |
6.5 |
|
Total |
6.3 |
6.0 |
6.8 |
7.0 |
7.1 |
7.4 |
8.3 |
|
Engineering |
|||||||
|
Registered |
5.1 |
5.1 |
5.6 |
5.6 |
5.7 |
5.9 |
6.3 |
|
Total |
6.9 |
7.1 |
7.7 |
7.5 |
8.0 |
8.1 |
8.8 |
|
Life Sciences |
|||||||
|
Registered |
5.3 |
5.3 |
5.5 |
5.7 |
6.1 |
6.5 |
6.8 |
|
Total |
7.6 |
7.1 |
7.2 |
7.3 |
7.9 |
8.9 |
9.4 |
|
Social Sciences |
|||||||
|
Registered |
5.4 |
5.1 |
5.7 |
6.0 |
6.8 |
7.4 |
7.5 |
|
Total |
8.5 |
7.7 |
7.6 |
8.1 |
9.4 |
10.5 |
10.4 |
|
Humanities |
|||||||
|
Registered |
5.9 |
5.5 |
6.4 |
7.3 |
8.0 |
8.5 |
8.3 |
|
Total |
10.2 |
9.5 |
9.2 |
10.2 |
11.1 |
12.1 |
11.9 |
|
Education |
|||||||
|
Registered |
6.7 |
5.8 |
6.1 |
6.5 |
7.4 |
8.1 |
8.2 |
|
Total |
13.2 |
13.9 |
12.5 |
12.7 |
14.1 |
16.8 |
19.2 |
|
Professional/Other |
|||||||
|
Registered |
5.4 |
5.1 |
5.9 |
6.2 |
6.9 |
7.3 |
7.5 |
|
Total |
11.4 |
10.9 |
10.0 |
10.7 |
12.0 |
13.0 |
13.3 |
|
NOTE: Medians are based on the number of individuals who provided complete information about their postbaccalaureate education. “Registered ” time-to-degree gauges the amount of time actually enrolled in graduate school, including master's degrees and enrollment in nondegree programs. “Total” time-to-degree measures the number of years elapsed between receipt of the baccalaureate and the Ph.D. See technical notes in Appendix C for rates of nonresponse to the applicable questions. *Includes mathematics and computer sciences. SOURCE: National Research Council, Survey of Earned Doctorates. |
|||||||
TABLE 10 Median Years to Doctorate from Baccalaureate Award, by Demographic Group and Broad Field, 1993
|
All Fields |
Physical Sci.* |
Eng. |
Life Sci. |
Social Sci. |
Humanities |
Education |
Prof./ Other |
|
|
Registered Time from Baccalaureate |
||||||||
|
All Ph.D.s |
7.1 |
6.5 |
6.3 |
6.8 |
7.5 |
8.3 |
8.2 |
7.5 |
|
Men |
6.9 |
6.5 |
6.3 |
6.8 |
7.4 |
8.2 |
8.1 |
7.4 |
|
Women |
7.5 |
6.5 |
6.4 |
6.9 |
7.5 |
8.4 |
8.2 |
7.7 |
|
U.S. Citizens |
7.3 |
6.3 |
6.3 |
6.9 |
7.4 |
8.4 |
8.4 |
7.8 |
|
Permanent Residents |
7.4 |
7.3 |
6.8 |
7.0 |
8.3 |
8.2 |
7.1 |
7.5 |
|
Temporary Residents |
6.6 |
6.8 |
6.2 |
6.6 |
7.3 |
7.5 |
6.3 |
6.8 |
|
U.S. Citizens |
||||||||
|
Asians |
6.8 |
6.2 |
6.6 |
6.5 |
7.4 |
7.7 |
9.6 |
7.5 |
|
Blacks |
7.9 |
6.9 |
6.6 |
7.4 |
7.8 |
7.8 |
8.4 |
7.5 |
|
Hispanics |
7.7 |
6.1 |
6.1 |
7.2 |
7.7 |
8.4 |
8.7 |
7.3 |
|
Native Americans |
6.8 |
6.2 |
6.4 |
8.5 |
10.0 |
6.4 |
6.5 |
|
|
Whites |
7.3 |
6.3 |
6.2 |
6.9 |
7.4 |
8.4 |
8.4 |
7.9 |
|
Total Time from Baccalaureate |
||||||||
|
All Ph.D.s |
10.5 |
8.3 |
8.8 |
9.4 |
10.4 |
11.9 |
19.2 |
13.3 |
|
Men |
9.9 |
8.3 |
8.9 |
9.2 |
10.3 |
11.7 |
18.4 |
12.4 |
|
Women |
12.2 |
8.1 |
8.0 |
9.7 |
10.7 |
12.0 |
19.7 |
15.2 |
|
U.S. Citizens |
11.5 |
7.4 |
8.1 |
9.0 |
10.5 |
12.3 |
19.9 |
15.5 |
|
Permanent Residents |
10.3 |
10.0 |
9.7 |
9.9 |
11.2 |
10.9 |
13.5 |
11.7 |
|
Temporary Residents |
9.7 |
9.2 |
9.2 |
9.9 |
10.0 |
10.4 |
12.4 |
10.5 |
|
U.S. Citizens |
||||||||
|
Asians |
8.4 |
6.6 |
8.4 |
7.4 |
9.2 |
10.8 |
20.4 |
12.0 |
|
Blacks |
16.5 |
8.4 |
8.6 |
12.4 |
12.6 |
14.0 |
20.0 |
17.4 |
|
Hispanics |
12.0 |
8.0 |
7.4 |
9.1 |
10.8 |
12.9 |
18.7 |
15.5 |
|
Native Americans |
13.9 |
10.0 |
8.5 |
10.7 |
13.3 |
19.0 |
10.5 |
|
|
Whites |
11.4 |
7.4 |
8.0 |
9.0 |
10.5 |
12.2 |
19.9 |
15.5 |
|
NOTE: Medians are based on the number of individuals who provided complete information about their postbaccalaureate education. “Registered time” gauges the amount of time actually enrolled in graduate school, including master's degrees and enrollment in nondegree programs. “Total time” measures the number of years elapsed between receipt of the baccalaureate and the Ph.D. See technical notes in Appendix C for rates of nonresponse to the applicable questions. *Includes mathematics and computer sciences. †A median was not computed because there were fewer than five Ph.D.s with known time-to-degree. SOURCE: National Research Council, Survey of Earned Doctorates. |
||||||||
TABLE 11 Primary Sources of Support for Doctorate Recipients, by Broad Field and Demographic Group, 1993
|
Primary Source of Support (responses only) |
U.S. Citizens |
|||||||||||
|
All Ph.D.s |
Men |
Women |
U.S. Cits. |
Perm. Res. |
Temp. Res. |
Asians |
Blacks |
Hispanics |
Native Amers. |
Whites |
||
|
All Fields |
N |
26,260 |
16,227 |
10,033 |
18,433 |
1,345 |
6,452 |
614 |
676 |
510 |
77 |
16,455 |
|
Personal |
% |
36.8 |
29.9 |
48.0 |
46.2 |
26.4 |
12.2 |
25.1 |
58.3 |
46.9 |
62.3 |
46.5 |
|
University |
% |
51.0 |
56.7 |
41.7 |
42.3 |
65.8 |
72.7 |
56.8 |
25.3 |
38.0 |
19.5 |
42.6 |
|
Federal |
% |
5.5 |
5.4 |
5.8 |
7.2 |
2.0 |
1.6 |
10.6 |
8.4 |
10.2 |
7.8 |
6.9 |
|
Other |
% |
6.7 |
8.0 |
4.5 |
4.3 |
5.8 |
13.5 |
7.5 |
8.0 |
4.9 |
10.4 |
4.0 |
|
Physical Sciences* |
N |
4,385 |
3,469 |
916 |
2,603 |
289 |
1,489 |
126 |
27 |
56 |
6 |
2,366 |
|
Personal |
% |
12.1 |
12.0 |
12.7 |
16.5 |
11.4 |
4.6 |
9.5 |
11.1 |
17.9 |
33.3 |
16.8 |
|
University |
% |
77.9 |
78.1 |
77.3 |
72.0 |
83.7 |
87.4 |
77.8 |
55.6 |
66.1 |
50.0 |
71.9 |
|
Federal |
% |
4.5 |
4.3 |
5.3 |
7.2 |
0.7 |
0.7 |
6.3 |
14.8 |
12.5 |
16.7 |
7.1 |
|
Other |
% |
5.4 |
5.6 |
4.7 |
4.4 |
4.2 |
7.3 |
6.3 |
18.5 |
3.6 |
0.0 |
4.2 |
|
Engineering |
N |
3,995 |
3,609 |
386 |
1,745 |
290 |
1,954 |
170 |
27 |
47 |
2 |
1,487 |
|
Personal |
% |
14.7 |
15.0 |
12.2 |
18.2 |
21.0 |
10.7 |
14.7 |
22.2 |
31.9 |
50.0 |
18.0 |
|
University |
% |
69.3 |
69.2 |
70.2 |
60.3 |
72.1 |
76.9 |
67.1 |
25.9 |
44.7 |
50.0 |
60.8 |
|
Federal |
% |
4.9 |
4.5 |
8.3 |
10.4 |
0.7 |
0.6 |
6.5 |
18.5 |
12.8 |
0.0 |
10.6 |
|
Other |
% |
11.1 |
11.3 |
9.3 |
11.1 |
6.2 |
11.9 |
11.8 |
33.3 |
10.6 |
0.0 |
10.6 |
|
Life Sciences |
N |
4,982 |
2,861 |
2,121 |
3,395 |
265 |
1,315 |
150 |
78 |
83 |
11 |
3,055 |
|
Personal |
% |
21.4 |
18.3 |
25.6 |
26.9 |
17.0 |
7.9 |
15.3 |
29.5 |
22.9 |
45.5 |
27.5 |
|
University |
% |
56.8 |
59.3 |
53.5 |
49.6 |
70.2 |
72.9 |
51.3 |
34.6 |
54.2 |
36.4 |
49.8 |
|
Federal |
% |
14.4 |
13.5 |
15.5 |
19.6 |
5.7 |
2.6 |
26.0 |
26.9 |
18.1 |
18.2 |
19.1 |
|
Other |
% |
7.4 |
8.9 |
5.4 |
3.9 |
7.2 |
16.6 |
7.3 |
9.0 |
4.8 |
0.0 |
3.6 |
|
Social Sciences |
N |
4,124 |
2,049 |
2,075 |
3,289 |
186 |
645 |
66 |
108 |
115 |
12 |
2,974 |
|
Personal |
% |
47.8 |
42.5 |
53.0 |
53.8 |
41.4 |
19.4 |
42.4 |
46.3 |
49.6 |
50.0 |
54.5 |
|
University |
% |
41.6 |
45.0 |
38.3 |
37.9 |
47.3 |
59.2 |
43.9 |
35.2 |
27.8 |
25.0 |
38.2 |
|
Federal |
% |
5.0 |
5.2 |
4.7 |
5.3 |
2.7 |
3.6 |
7.6 |
10.2 |
16.5 |
16.7 |
4.6 |
|
Other |
% |
5.6 |
7.2 |
4.0 |
3.1 |
8.6 |
17.8 |
6.1 |
8.3 |
6.1 |
8.3 |
2.7 |
|
Humanities |
N |
2,824 |
1,461 |
1,363 |
2,324 |
141 |
354 |
36 |
53 |
70 |
8 |
2,135 |
|
Personal |
% |
43.3 |
43.8 |
42.8 |
47.4 |
32.6 |
21.2 |
44.4 |
32.1 |
40.0 |
50.0 |
48.0 |
|
University |
% |
50.5 |
49.7 |
51.4 |
48.1 |
61.7 |
62.1 |
50.0 |
60.4 |
54.3 |
37.5 |
47.9 |
|
Federal |
% |
2.2 |
2.0 |
2.5 |
1.9 |
0.7 |
4.8 |
2.8 |
1.9 |
1.4 |
0.0 |
1.9 |
|
Other |
% |
3.9 |
4.5 |
3.2 |
2.5 |
5.0 |
11.9 |
2.8 |
5.7 |
4.3 |
12.5 |
2.2 |
|
Education |
N |
4,351 |
1,760 |
2,591 |
3,932 |
91 |
324 |
48 |
325 |
115 |
31 |
3,404 |
|
Personal |
% |
79.8 |
77.4 |
81.4 |
83.3 |
65.9 |
41.0 |
85.4 |
81.5 |
84.3 |
80.6 |
83.4 |
|
University |
% |
13.9 |
14.3 |
13.6 |
11.9 |
29.7 |
32.4 |
8.3 |
11.4 |
8.7 |
0.0 |
12.3 |
|
Federal |
% |
1.1 |
1.4 |
1.0 |
1.1 |
2.2 |
1.2 |
2.1 |
3.4 |
3.5 |
3.2 |
0.8 |
|
Other |
% |
5.2 |
6.9 |
4.1 |
3.6 |
2.2 |
25.3 |
4.2 |
3.7 |
3.5 |
16.1 |
3.5 |
|
Professional/Other |
N |
1,599 |
1,018 |
581 |
1,145 |
83 |
371 |
18 |
58 |
24 |
7 |
1,034 |
|
Personal |
% |
51.5 |
49.4 |
55.1 |
62.7 |
39.8 |
19.4 |
50.0 |
51.7 |
54.2 |
71.4 |
63.8 |
|
University |
% |
38.8 |
39.4 |
37.7 |
30.8 |
55.4 |
59.6 |
50.0 |
25.9 |
45.8 |
14.3 |
30.6 |
|
Federal |
% |
1.8 |
1.6 |
2.2 |
2.4 |
0.0 |
0.5 |
0.0 |
6.9 |
0.0 |
0.0 |
2.0 |
|
Other |
% |
7.9 |
9.6 |
5.0 |
4.1 |
4.8 |
20.5 |
0.0 |
15.5 |
0.0 |
14.3 |
3.6 |
|
NOTE: Numbers represent those Ph.D.s with known primary support; percentages are based on these numbers. Because nonresponse to “ primary” source of support is much greater than for other variables and fluctuates from year to year, the reader is advised not to compare percentages in this table with those published in earlier reports. The overall nonresponse rate to “primary” source of support was 33.9 percent in 1993, compared to 30.4 percent in 1992 and 22.5 percent in 1991. See technical notes in Appendix C for rates of nonresponse to this question by field and demographic group. “Personal” includes loans as well as own earnings and contributions from the spouse/family. Federally funded research assistantships (RAs) are grouped under “University” because not all recipients of such support are aware of the actual source of funding. For further definition of “Federal ” support, see item 17 on the survey questionnaire in Appendix D. “Other” support includes U.S. nationally competitive fellowships, business/employer funds, foreign government, state government, and other nonspecified sources. *Includes mathematics and computer sciences. SOURCE: National Research Council, Survey of Earned Doctorates. |
||||||||||||
TABLE 12 Median Level of Debt Related to the Education of Doctorate Recipients, 1993
|
All Ph.D.s |
Responses to Debt Status |
Percent with Debt |
Median Dollars* |
|
|
All Ph.D.s |
39,754 |
36,861 |
47.6 |
10,500 |
|
Men |
24,646 |
22,777 |
47.8 |
10,500 |
|
Women |
15,108 |
14,084 |
47.4 |
10,600 |
|
U.S. Citizens |
26,386 |
25,362 |
55.2 |
10,600 |
|
Permanent Residents |
2,250 |
2,143 |
36.0 |
10,700 |
|
Temporary Residents |
9,923 |
9,309 |
29.7 |
9,600 |
|
U.S. Citizens |
||||
|
Asians |
891 |
863 |
54.6 |
10,200 |
|
Blacks |
1,106 |
1,033 |
61.7 |
11,800 |
|
Hispanics |
834 |
799 |
65.5 |
12,500 |
|
Native Americans |
119 |
112 |
55.4 |
8,000 |
|
Whites |
23,202 |
22,415 |
54.6 |
10,600 |
|
Physical Sciences† |
6,496 |
6,043 |
42.6 |
8,500 |
|
Engineering |
5,696 |
5,275 |
38.5 |
9,300 |
|
Life Sciences |
7,397 |
6,908 |
50.0 |
9,800 |
|
Social Sciences |
6,545 |
6,020 |
61.9 |
14,500 |
|
Humanities |
4,481 |
4,183 |
55.2 |
10,000 |
|
Education |
6,647 |
6,142 |
38.1 |
10,100 |
|
Professional/Other |
2,492 |
2,290 |
48.8 |
12,000 |
|
NOTE: “All Ph.D.s” includes recipients whose debt status is unknown; percentages are based on the number with “responses to debt status.” See technical notes in Appendix C for rates of nonresponse to the question on debt. *Rounded to the nearest hundred dollars. Doctorate recipients who reported “no debt” are not included. †Includes mathematics and computer sciences. SOURCE: National Research Council, Survey of Earned Doctorates. |
||||
TABLE 13 Cumulative Level of Debt Related to the Education of Doctorate Recipients, 1993
|
Percent owing: |
||||||||
|
Number of Ph.D.s with Debt |
$1 to $5,000 |
$5,001 to $10,000 |
$10,001 to $15,000 |
$15,001 to $20,000 |
$20,001 to $25,000 |
$25,001 to $30,000 |
$30,001 or More |
|
|
All Ph.D.s |
17,557 |
26.9 |
21.5 |
16.2 |
10.3 |
7.2 |
5.6 |
12.5 |
|
Men |
10,877 |
27.1 |
21.3 |
16.5 |
10.1 |
7.2 |
5.2 |
12.6 |
|
Women |
6,680 |
26.5 |
21.8 |
15.6 |
10.6 |
7.1 |
6.2 |
12.2 |
|
U.S. Citizens |
14,002 |
25.7 |
22.1 |
17.2 |
11.0 |
7.6 |
5.7 |
10.8 |
|
Permanent Residents |
771 |
25.7 |
22.2 |
15.0 |
9.2 |
7.5 |
5.8 |
14.5 |
|
Temporary Residents |
2,762 |
33.4 |
17.9 |
11.2 |
6.9 |
5.1 |
5.0 |
20.5 |
|
U.S. Citizens |
||||||||
|
Asians |
471 |
22.5 |
26.5 |
19.5 |
10.4 |
8.1 |
3.6 |
9.3 |
|
Blacks |
637 |
26.2 |
18.7 |
14.4 |
11.3 |
6.3 |
7.1 |
16.0 |
|
Hispanics |
523 |
21.0 |
20.7 |
16.6 |
12.6 |
8.8 |
7.1 |
13.2 |
|
Native Americans |
62 |
35.5 |
24.2 |
11.3 |
6.5 |
4.8 |
3.2 |
14.5 |
|
Whites |
12,234 |
25.9 |
22.2 |
17.3 |
11.0 |
7.6 |
5.6 |
10.4 |
|
Physical Sciences* |
2,577 |
31.5 |
26.0 |
18.0 |
8.3 |
5.2 |
3.8 |
7.1 |
|
Engineering |
2,030 |
30.8 |
22.1 |
14.7 |
9.1 |
6.3 |
4.5 |
12.4 |
|
Life Sciences |
3,457 |
27.2 |
23.7 |
18.3 |
9.1 |
6.4 |
4.7 |
10.4 |
|
Social Sciences |
3,725 |
18.9 |
17.6 |
15.0 |
12.5 |
8.5 |
7.7 |
19.9 |
|
Humanities |
2,310 |
27.4 |
22.4 |
16.3 |
11.7 |
7.4 |
5.7 |
9.1 |
|
Education |
2,340 |
29.8 |
19.8 |
15.3 |
10.0 |
8.0 |
5.5 |
11.5 |
|
Professional/Other |
1,118 |
27.3 |
17.3 |
13.3 |
10.6 |
9.0 |
7.2 |
15.3 |
|
NOTE: See technical notes in Appendix C for rates of nonresponse to the question on debt. *Includes mathematics and computer sciences. SOURCE: National Research Council, Survey of Earned Doctorates. |
||||||||
TABLE 14 Postgraduation Commitments of Doctorate Recipients, by Type of Plans and Broad Field for Selected Years, 1973–1993
|
All Fields |
Physical Sci.* |
Eng. |
Life Sci. |
Social Sci. |
Humanities |
Education |
Prof./ Other |
||
|
All Definite Commitments |
|||||||||
|
1973 |
N |
24,091 |
3,625 |
2,323 |
3,728 |
4,328 |
3,610 |
5,261 |
1,216 |
|
1978 |
N |
20,849 |
2,992 |
1,688 |
3,610 |
3,914 |
2,393 |
4,870 |
1,382 |
|
1983 |
N |
21,187 |
3,150 |
1,850 |
3,914 |
3,869 |
2,068 |
4,978 |
1,358 |
|
1988 |
N |
22,202 |
3,661 |
2,495 |
4,297 |
3,691 |
2,113 |
4,389 |
1,556 |
|
1993 |
N |
24,404 |
3,918 |
2,869 |
5,038 |
3,948 |
2,488 |
4,433 |
1,710 |
|
Definite Commitments with Responses to Type of Plans |
|||||||||
|
1973 |
N |
23,931 |
3,616 |
2,317 |
3,708 |
4,301 |
3,569 |
5,217 |
1,203 |
|
1978 |
N |
20,682 |
2,979 |
1,679 |
3,586 |
3,885 |
2,368 |
4,813 |
1,372 |
|
1983 |
N |
21,127 |
3,139 |
1,844 |
3,908 |
3,857 |
2,061 |
4,966 |
1,352 |
|
1988 |
N |
21,992 |
3,638 |
2,480 |
4,274 |
3,655 |
2,082 |
4,321 |
1,542 |
|
1993 |
N |
24,236 |
3,893 |
2,857 |
5,016 |
3,922 |
2,458 |
4,391 |
1,699 |
|
Employment |
|||||||||
|
1973 |
% |
83.8 |
60.9 |
87.1 |
58.1 |
91.9 |
96.2 |
98.0 |
98.6 |
|
1978 |
% |
80.3 |
60.5 |
84.8 |
47.4 |
87.0 |
95.2 |
97.7 |
98.4 |
|
1983 |
% |
79.3 |
62.0 |
87.5 |
44.8 |
86.3 |
95.4 |
97.4 |
97.2 |
|
1988 |
% |
73.6 |
51.4 |
80.2 |
39.4 |
84.2 |
93.1 |
95.6 |
97.5 |
|
1993 |
% |
71.1 |
50.3 |
74.8 |
35.9 |
80.0 |
93.1 |
97.1 |
97.2 |
|
Study |
|||||||||
|
1973 |
% |
16.2 |
39.1 |
12.9 |
41.9 |
8.1 |
3.8 |
2.0 |
1.4 |
|
1978 |
% |
19.7 |
39.5 |
15.2 |
52.6 |
13.0 |
4.8 |
2.3 |
1.6 |
|
1983 |
% |
20.7 |
38.0 |
12.5 |
55.2 |
13.7 |
4.6 |
2.6 |
2.8 |
|
1988 |
% |
26.4 |
48.6 |
19.8 |
60.6 |
15.8 |
6.9 |
4.4 |
2.5 |
|
1993 |
% |
28.9 |
49.7 |
25.2 |
64.1 |
20.0 |
6.9 |
2.9 |
2.8 |
|
NOTE: Only Ph.D.s with definite commitments are included. “All definite commitments” includes recipients who reported definite commitments but not type of plans (employment or study). Percentages are based on the number of Ph.D.s with “responses to type of plans.” See technical notes in Appendix C for rates of nonresponse to the applicable questions and for further explanation of postgraduation plans. *Includes mathematics and computer sciences. SOURCE: National Research Council, Survey of Earned Doctorates. |
|||||||||
TABLE 15 Postgraduation Commitments of Doctorate Recipients, by Type of Plans and Demographic Group for Selected Years, 1973–1993
|
U.S. Citizens & Permanent Residents* |
||||||||||||
|
All Ph.D.s |
Men |
Women |
U.S. Cits. |
Perm. Res. |
Temp. Res. |
Asians |
Blacks |
Hispanics |
Native Amers. |
Whites |
||
|
All Definite Commitments |
||||||||||||
|
1973 |
N |
24,091 |
20,282 |
3,809 |
20,798 |
1,131 |
2,113 |
N/A |
N/A |
N/A |
N/A |
N/A |
|
1978 |
N |
20,849 |
15,750 |
5,099 |
17,772 |
781 |
2,265 |
625 |
712 |
367 |
41 |
15,981 |
|
1983 |
N |
21,187 |
14,399 |
6,788 |
17,496 |
759 |
2,885 |
647 |
668 |
420 |
45 |
16,192 |
|
1988 |
N |
22,202 |
14,464 |
7,738 |
17,326 |
913 |
3,925 |
772 |
642 |
487 |
64 |
15,982 |
|
1993 |
N |
24,404 |
14,878 |
9,526 |
18,006 |
1,099 |
5,273 |
1,089 |
766 |
624 |
75 |
16,459 |
|
Definite Commitments with Responses to Type of Plans |
||||||||||||
|
1973 |
N |
23,931 |
20,154 |
3,777 |
20,670 |
1,120 |
2,095 |
N/A |
N/A |
N/A |
N/A |
N/A |
|
1978 |
N |
20,682 |
15,638 |
5,044 |
17,656 |
773 |
2,225 |
616 |
699 |
366 |
41 |
15,890 |
|
1983 |
N |
21,127 |
14,358 |
6,769 |
17,459 |
758 |
2,863 |
644 |
665 |
419 |
45 |
16,166 |
|
1988 |
N |
21,992 |
14,335 |
7,657 |
17,182 |
899 |
3,874 |
762 |
634 |
479 |
63 |
15,855 |
|
1993 |
N |
24,236 |
14,788 |
9,448 |
17,903 |
1,084 |
5,223 |
1,079 |
758 |
621 |
75 |
16,363 |
|
Employment |
||||||||||||
|
1973 |
% |
83.8 |
83.6 |
85.1 |
85.4 |
68.1 |
76.4 |
N/A |
N/A |
N/A |
N/A |
N/A |
|
1978 |
% |
80.3 |
79.2 |
83.7 |
81.0 |
78.3 |
75.8 |
71.3 |
94.0 |
89.3 |
90.2 |
80.7 |
|
1983 |
% |
79.3 |
77.9 |
82.2 |
79.6 |
80.1 |
77.2 |
73.6 |
92.3 |
86.6 |
97.8 |
79.2 |
|
1988 |
% |
73.6 |
71.8 |
77.2 |
75.8 |
72.0 |
64.7 |
70.3 |
87.9 |
73.7 |
82.5 |
75.5 |
|
1993 |
% |
71.1 |
68.5 |
75.3 |
74.4 |
66.1 |
60.9 |
60.9 |
83.8 |
74.2 |
85.3 |
74.3 |
|
Study |
||||||||||||
|
1973 |
% |
16.2 |
16.4 |
14.9 |
14.6 |
31.9 |
23.6 |
N/A |
N/A |
N/A |
N/A |
N/A |
|
1978 |
% |
19.7 |
20.8 |
16.3 |
19.0 |
21.7 |
24.2 |
28.7 |
6.0 |
10.7 |
9.8 |
19.3 |
|
1983 |
% |
20.7 |
22.1 |
17.8 |
20.4 |
19.9 |
22.8 |
26.4 |
7.7 |
13.4 |
2.2 |
20.8 |
|
1988 |
% |
26.4 |
28.2 |
22.8 |
24.2 |
28.0 |
35.3 |
29.7 |
12.1 |
26.3 |
17.5 |
24.5 |
|
1993 |
% |
28.9 |
31.5 |
24.7 |
25.6 |
33.9 |
39.1 |
39.1 |
16.2 |
25.8 |
14.7 |
25.7 |
|
NOTE: Only Ph.D.s with definite commitments are included. “All definite commitments” includes recipients who reported definite commitments but not type of plans (employment or study). Percentages are based on the number of Ph.D.s with “responses to type of plans.” See technical notes in Appendix C for rates of nonresponse to the applicable questions and for further explanation of postgraduation plans. *Race/ethnicity was not available in 1973. SOURCE: National Research Council, Survey of Earned Doctorates. |
||||||||||||
TABLE 16 Postdoctoral Location of Non-U.S. Citizen Doctorate Recipients with Postgraduation Commitments, by Visa Status for Selected Years, 1973–1993
|
All Non-U.S. Citizens |
Permanent Residents |
Temporary Residents |
||
|
All Definite Commitments |
||||
|
1973 |
N |
3,244 |
1,131 |
2,113 |
|
1978 |
N |
3,046 |
781 |
2,265 |
|
1983 |
N |
3,644 |
759 |
2,885 |
|
1988 |
N |
4,838 |
913 |
3,925 |
|
1993 |
N |
6,372 |
1,099 |
5,273 |
|
Definite Commitments with Responses to Location |
||||
|
1973 |
N |
3,140 |
1,081 |
2,059 |
|
1978 |
N |
2,892 |
744 |
2,148 |
|
1983 |
N |
3,376 |
697 |
2,679 |
|
1988 |
N |
4,372 |
834 |
3,538 |
|
1993 |
N |
6,294 |
1,094 |
5,200 |
|
U.S. Location |
||||
|
1973 |
% |
50.8 |
89.4 |
30.5 |
|
1978 |
% |
52.4 |
92.1 |
38.6 |
|
1983 |
% |
50.7 |
91.4 |
40.2 |
|
1988 |
% |
61.0 |
85.0 |
55.3 |
|
1993 |
% |
60.5 |
85.5 |
55.2 |
|
Foreign Location |
||||
|
1973 |
% |
49.2 |
10.6 |
69.5 |
|
1978 |
% |
47.6 |
7.9 |
61.4 |
|
1983 |
% |
49.3 |
8.6 |
59.8 |
|
1988 |
% |
39.0 |
15.0 |
44.7 |
|
1993 |
% |
39.5 |
14.5 |
44.8 |
|
NOTE: Only non-U.S. citizen Ph.D.s with definite commitments are included. “All definite commitments” includes recipients who reported definite commitments but not location (U.S. or foreign). Percentages are based on the number with “responses to location.” See technical notes in Appendix C for rates of nonresponse to the applicable questions and for further explanation of postgraduation plans. SOURCE: National Research Council, Survey of Earned Doctorates. |
||||
TABLE 17 Postdoctoral Location of Non-U.S. Citizen Doctorate Recipients with Postgraduation Commitments, by Major Field and Visa Status, 1993
|
Postdoctoral Location |
||||||||||
|
Permanent Visas |
Temporary Visas |
|||||||||
|
Resp. to Location/ Type of Plans (N) |
U.S. Location |
Foreign Location |
Resp. to Location/ Type of Plans (N) |
U.S. Location |
Foreign Location |
|||||
|
Field of Doctorate (responses only) |
Empl. (%) |
Study (%) |
Empl. (%) |
Study (%) |
Empl. (%) |
Study (%) |
Empl. (%) |
Study (%) |
||
|
All Fields |
1,080 |
55.0 |
30.5 |
11.1 |
3.4 |
5,154 |
25.7 |
29.5 |
35.5 |
9.2 |
|
Physical Sciences |
220 |
55.0 |
34.1 |
5.9 |
5.0 |
1,267 |
25.0 |
41.5 |
19.8 |
13.7 |
|
Physics/Astronomy |
45 |
31.1 |
55.6 |
0.0 |
13.3 |
297 |
10.8 |
61.6 |
7.7 |
19.9 |
|
Chemistry |
55 |
43.6 |
45.5 |
3.6 |
7.3 |
379 |
15.8 |
60.7 |
11.3 |
12.1 |
|
Earth, Atmos., Marine |
22 |
36.4 |
50.0 |
13.6 |
0.0 |
124 |
15.3 |
33.9 |
36.3 |
14.5 |
|
Mathematics |
46 |
73.9 |
15.2 |
10.9 |
0.0 |
260 |
39.6 |
20.8 |
26.5 |
13.1 |
|
Computer Sciences |
52 |
78.8 |
13.5 |
5.8 |
1.9 |
207 |
49.8 |
8.2 |
34.3 |
7.7 |
|
Engineering |
193 |
63.7 |
22.8 |
10.9 |
2.6 |
1,207 |
34.1 |
23.3 |
35.8 |
6.9 |
|
Life Sciences |
247 |
20.2 |
67.2 |
8.1 |
4.5 |
1,167 |
8.6 |
54.7 |
25.9 |
10.9 |
|
Biological Sciences |
190 |
13.2 |
78.9 |
3.2 |
4.7 |
780 |
5.6 |
71.3 |
12.4 |
10.6 |
|
Health Sciences |
34 |
52.9 |
20.6 |
26.5 |
0.0 |
123 |
26.8 |
22.8 |
42.3 |
8.1 |
|
Agricultural Sciences |
23 |
30.4 |
39.1 |
21.7 |
8.7 |
264 |
8.7 |
20.5 |
58.0 |
12.9 |
|
Social Sciences* |
147 |
66.7 |
19.0 |
11.6 |
2.7 |
600 |
30.0 |
7.7 |
56.2 |
6.2 |
|
Psychology |
50 |
62.0 |
36.0 |
2.0 |
0.0 |
84 |
26.2 |
21.4 |
42.9 |
9.5 |
|
Economics |
34 |
67.6 |
5.9 |
23.5 |
2.9 |
265 |
33.6 |
2.6 |
57.7 |
6.0 |
|
Poli. Sci./Int'l. Relat. |
20 |
65.0 |
10.0 |
20.0 |
5.0 |
64 |
25.0 |
6.3 |
60.9 |
7.8 |
|
Sociology |
16 |
68.8 |
18.8 |
12.5 |
0.0 |
63 |
33.3 |
3.2 |
58.7 |
4.8 |
|
Humanities |
124 |
78.2 |
6.5 |
11.3 |
4.0 |
296 |
39.9 |
6.1 |
45.6 |
8.4 |
|
Education |
64 |
62.5 |
6.3 |
29.7 |
1.6 |
250 |
15.6 |
2.8 |
73.2 |
8.4 |
|
Professional/Other* |
85 |
76.5 |
4.7 |
18.8 |
0.0 |
367 |
43.9 |
1.9 |
51.8 |
2.5 |
|
Business & Mgmt. |
55 |
85.5 |
1.8 |
12.7 |
0.0 |
259 |
52.1 |
1.2 |
45.9 |
0.8 |
|
NOTE: Only Ph.D.s with definite commitments are included; see Table 16 for numbers of non-U.S. citizens with commitments. Numbers represent those Ph.D.s who responded to both postdoctoral location and type of plans; percentages are based on these numbers. See technical notes in Appendix C for rates of nonresponse to these questions and for further explanation of postgraduation plans. *Totals include other fields not shown. SOURCE: National Research Council, Survey of Earned Doctorates. |
||||||||||
TABLE 18 Employment Sector of Doctorate Recipients with Postgraduation Commitments in the United States, by Broad Field for Selected Years, 1973–1993 (U.S. citizens and permanent residents)
|
All Fields |
Physical Sci.* |
Eng. |
Life Sci. |
Social Sci. |
Humanities |
Education |
Prof./ Other |
||
|
All Employment Commitments |
|||||||||
|
1973 |
N |
17,931 |
1,947 |
1,712 |
1,778 |
3,479 |
3,148 |
4,833 |
1,034 |
|
1978 |
N |
14,612 |
1,575 |
1,081 |
1,359 |
2,996 |
2,056 |
4,398 |
1,147 |
|
1983 |
N |
14,269 |
1,607 |
979 |
1,347 |
2,981 |
1,764 |
4,476 |
1,115 |
|
1988 |
N |
13,430 |
1,458 |
1,268 |
1,275 |
2,671 |
1,707 |
3,839 |
1,212 |
|
1993 |
N |
13,619 |
1,349 |
1,234 |
1,336 |
2,531 |
1,954 |
3,981 |
1,234 |
|
Employment Commitments with Responses to Sector |
|||||||||
|
1973 |
N |
17,847 |
1,942 |
1,707 |
1,773 |
3,464 |
3,130 |
4,800 |
1,031 |
|
1978 |
N |
14,531 |
1,572 |
1,074 |
1,357 |
2,976 |
2,044 |
4,362 |
1,146 |
|
1983 |
N |
14,122 |
1,604 |
978 |
1,339 |
2,946 |
1,743 |
4,400 |
1,112 |
|
1988 |
N |
13,301 |
1,452 |
1,266 |
1,265 |
2,631 |
1,690 |
3,791 |
1,206 |
|
1993 |
N |
13,415 |
1,342 |
1,229 |
1,324 |
2,467 |
1,937 |
3,892 |
1,224 |
|
Academe† |
|||||||||
|
1973 |
% |
64.3 |
49.5 |
24.8 |
63.5 |
69.1 |
92.0 |
59.8 |
80.4 |
|
1978 |
% |
56.4 |
37.9 |
23.5 |
59.0 |
58.5 |
82.6 |
51.9 |
74.1 |
|
1983 |
% |
50.2 |
34.0 |
29.3 |
53.0 |
48.8 |
80.0 |
43.8 |
71.0 |
|
1988 |
% |
49.7 |
36.1 |
28.6 |
52.2 |
44.9 |
79.3 |
43.7 |
73.5 |
|
1993 |
% |
52.5 |
37.0 |
24.2 |
51.2 |
49.7 |
85.2 |
45.5 |
75.8 |
|
Industry/Self-Employed |
|||||||||
|
1973 |
% |
11.5 |
29.0 |
51.1 |
13.6 |
5.2 |
1.4 |
1.8 |
6.4 |
|
1978 |
% |
15.3 |
45.2 |
57.1 |
20.4 |
9.6 |
4.9 |
3.4 |
7.0 |
|
1983 |
% |
19.8 |
52.7 |
55.8 |
25.2 |
17.2 |
6.5 |
7.5 |
10.5 |
|
1988 |
% |
20.4 |
50.1 |
55.5 |
23.6 |
19.5 |
5.8 |
7.3 |
8.1 |
|
1993 |
% |
18.7 |
49.6 |
56.1 |
24.2 |
18.2 |
3.8 |
5.4 |
8.6 |
|
Government |
|||||||||
|
1973 |
% |
11.6 |
18.6 |
20.0 |
16.6 |
14.4 |
1.7 |
9.4 |
6.4 |
|
1978 |
% |
12.5 |
14.4 |
17.5 |
16.4 |
15.9 |
3.8 |
12.5 |
7.2 |
|
1983 |
% |
11.1 |
11.2 |
13.2 |
15.9 |
15.5 |
3.4 |
10.3 |
6.6 |
|
1988 |
% |
10.8 |
11.9 |
15.0 |
16.7 |
14.2 |
3.7 |
9.0 |
6.6 |
|
1993 |
% |
10.0 |
11.1 |
16.8 |
16.3 |
14.4 |
2.0 |
7.7 |
6.1 |
|
Other‡ |
|||||||||
|
1973 |
% |
12.5 |
2.9 |
4.0 |
6.3 |
11.2 |
4.9 |
29.0 |
6.8 |
|
1978 |
% |
15.9 |
2.4 |
2.0 |
4.3 |
16.0 |
8.7 |
32.2 |
11.8 |
|
1983 |
% |
18.9 |
2.0 |
1.6 |
5.8 |
18.5 |
10.1 |
38.5 |
12.0 |
|
1988 |
% |
19.1 |
1.9 |
0.9 |
7.6 |
21.4 |
11.2 |
39.9 |
11.8 |
|
1993 |
% |
18.8 |
2.3 |
3.0 |
8.3 |
17.8 |
8.9 |
41.5 |
9.5 |
|
NOTE: Only Ph.D.s with definite commitments for employment are included. Foreign locations are excluded. “All employment commitments” includes recipients whose employment sector is unknown; percentages are based on the number with “responses to sector.” See technical notes in Appendix C for rates of nonresponse to this question. *Includes mathematics and computer sciences. †Academe includes two- and four-year colleges and universities and medical schools. Elementary and secondary schools are included in “Other.” ‡“Other” is mainly composed of elementary and secondary schools and nonprofit organizations. SOURCE: National Research Council, Survey of Earned Doctorates. |
|||||||||
TABLE 19 Employment Sector of Doctorate Recipients with Postgraduation Commitments in the United States, by Demographic Group for Selected Years, 1973–1993.
|
U.S. Citizens & Permanent Residents* |
||||||||||||
|
All Ph.D.s |
Men |
Women |
Asians |
Blanks |
Hispanics |
Native Amers. |
Whites |
U.S. Cits. |
Perm. Res. |
Temp. Res. |
||
|
All Employment Commitments |
||||||||||||
|
1973 |
N |
17,931 |
14,935 |
2,996 |
N/A |
N/A |
N/A |
N/A |
N/A |
17,263 |
668 |
316 |
|
1978 |
N |
14,612 |
10,677 |
3,935 |
419 |
650 |
319 |
37 |
12,575 |
14,061 |
551 |
424 |
|
1983 |
N |
14,269 |
9,069 |
5,200 |
444 |
606 |
357 |
43 |
12,614 |
13,714 |
555 |
624 |
|
1988 |
N |
14,430 |
7,988 |
5,442 |
498 |
544 |
341 |
49 |
11,808 |
12,871 |
559 |
924 |
|
1993 |
N |
13,619 |
7,263 |
6,356 |
579 |
620 |
446 |
64 |
11,858 |
13,023 |
596 |
1,323 |
|
Employment Commitments with Responses to Sector |
||||||||||||
|
1973 |
N |
17,847 |
14,875 |
2,972 |
N/A |
N/A |
N/A |
N/A |
N/A |
17,186 |
661 |
316 |
|
1978 |
N |
14,531 |
10,624 |
3,907 |
413 |
637 |
313 |
37 |
12,524 |
13,986 |
545 |
423 |
|
1983 |
N |
14,122 |
9,000 |
5,122 |
439 |
588 |
347 |
42 |
12,508 |
13,986 |
544 |
624 |
|
1988 |
N |
13,301 |
7,930 |
5,371 |
496 |
534 |
337 |
49 |
11,700 |
12,747 |
554 |
924 |
|
1993 |
N |
13,415 |
7,177 |
6,238 |
572 |
602 |
434 |
63 |
11,693 |
12,831 |
584 |
1,300 |
|
Academe† |
||||||||||||
|
1973 |
% |
64.3 |
62.3 |
74.7 |
N/A |
N/A |
N/A |
N/A |
N/A |
64.6 |
57.3 |
66.5 |
|
1978 |
% |
56.4 |
52.9 |
65.7 |
33.2 |
64.5 |
63.9 |
56.8 |
56.7 |
56.8 |
45.7 |
58.9 |
|
1983 |
% |
50.2 |
47.4 |
55.2 |
37.6 |
48.6 |
53.6 |
50.0 |
50.6 |
50.4 |
46.0 |
63.5 |
|
1988 |
% |
49.7 |
46.2 |
55.0 |
35.3 |
56.7 |
52.8 |
40.8 |
50.0 |
49.5 |
54.3 |
67.4 |
|
1993 |
% |
52.5 |
47.5 |
58.3 |
44.1 |
57.3 |
59.4 |
57.1 |
52.4 |
52.3 |
57.2 |
53.6 |
|
Industry/Self-Employed |
||||||||||||
|
1973 |
% |
11.5 |
13.0 |
4.2 |
N/A |
N/A |
N/A |
N/A |
N/A |
10.7 |
32.7 |
22.5 |
|
1978 |
% |
15.3 |
18.1 |
7.4 |
51.6 |
4.9 |
9.6 |
10.8 |
14.6 |
14.2 |
43.3 |
31.7 |
|
1983 |
% |
19.8 |
23.9 |
12.6 |
46.9 |
9.2 |
15.9 |
11.9 |
19.4 |
19.0 |
40.4 |
31.7 |
|
1988 |
% |
20.4 |
25.1 |
13.5 |
45.0 |
9.6 |
16.9 |
12.2 |
19.9 |
19.9 |
32.5 |
28.2 |
|
1993 |
% |
18.7 |
24.2 |
12.4 |
40.7 |
8.5 |
15.9 |
7.9 |
18.3 |
18.0 |
33.7 |
39.4 |
|
Government |
||||||||||||
|
1973 |
% |
11.6 |
12.4 |
7.8 |
N/A |
N/A |
N/A |
N/A |
N/A |
11.9 |
3.9 |
1.9 |
|
1978 |
% |
12.5 |
13.8 |
8.9 |
9.0 |
11.0 |
13.7 |
21.6 |
12.5 |
12.8 |
5.1 |
2.4 |
|
1983 |
% |
11.1 |
12.3 |
8.8 |
8.2 |
13.8 |
12.7 |
11.9 |
11.0 |
11.3 |
4.6 |
2.1 |
|
1988 |
% |
10.8 |
12.2 |
8.6 |
8.7 |
11.2 |
12.2 |
20.4 |
10.8 |
11.1 |
3.4 |
1.2 |
|
1993 |
% |
10.0 |
11.5 |
8.2 |
8.0 |
9.5 |
12.2 |
17.5 |
10.0 |
10.3 |
3.6 |
2.2 |
|
Other‡ |
||||||||||||
|
1973 |
% |
12.5 |
12.4 |
13.3 |
N/A |
N/A |
N/A |
N/A |
N/A |
12.8 |
6.1 |
9.2 |
|
1978 |
% |
15.9 |
15.1 |
18.1 |
6.3 |
19.6 |
12.8 |
10.8 |
16.2 |
16.3 |
5.9 |
7.1 |
|
1983 |
% |
18.9 |
16.4 |
23.4 |
7.3 |
28.4 |
17.9 |
26.2 |
19.0 |
19.3 |
9.0 |
2.7 |
|
1988 |
% |
19.1 |
16.6 |
22.9 |
11.1 |
22.5 |
18.1 |
26.5 |
19.4 |
19.5 |
9.7 |
3.1 |
|
1993 |
% |
18.8 |
16.8 |
21.1 |
7.2 |
24.8 |
12.4 |
17.5 |
19.3 |
19.4 |
5.5 |
4.8 |
|
NOTE: Only doctorates with definite commitments for employment are included. Foreign locations are excluded. “All employment commitments ” includes recipients whose employment sector is unknown; percentages are based on the number with “responses to sector.” See technical notes in Appendix C for rates of nonresponse to this question. *Race/ethnicity was not available in 1973. †Academe includes two- and four-year colleges and universities and medical schools. Elementary and secondary schools are included in “Other.” ‡“Other” is mainly composed of elementary and secondary schools and nonprofit organizations. SOURCE: National Research Council, Survey of Earned Doctorates. |
||||||||||||


