
shows, the number of non-US PhD recipients increased by 78% from 1985 to 1995. Furthermore, in every year since 1990, foreign students have received more than half the PhDs awarded in mathematics in the United States.
That phenomenon occurs elsewhere, and high proportions of foreign students in the sciences are relatively common in other industrialized countries, especially those with former colonial ties. The percentages of foreign natural-science doctoral students in several countries are depicted in figure 6. The large increase shown for Japan is due to Japan's strategy to attract and train foreign students.
A closely related issue is the number of foreign-born PhD recipients who remain permanently in the United States. The panel found no data on how many foreign students receiving mathematics PhDs intend to remain in the United States after receiving their degrees. However, the overall picture of “stay rates” for foreign students in all science and engineering fields, as shown in figure 7, suggests that such intentions are widespread and confirms the attractiveness of the United States to foreign talent mentioned in section 4.1.
To explore the question further, the panel conducted its own informal survey of 10 highly rated US mathematics departments. Of 397 tenured faculty, 21% received their undergraduate degree outside the United States; for 107 tenure-track faculty, this statistic was 58%. Thus, the number of faculty in US mathematics departments with undergraduate degrees from outside the United States can be expected to increase.
Stay rates in other countries were found only for France, where 56% of non-French people who received mathematics PhDs in 1992 remained in France (NSF 1996c).
5.5. Graduate Education
As discussed in section 5.3.1, the number of PhDs produced by US universities grew substantially from the middle 1980s through the 1990s. However, the trend has recently changed as doctorate-granting institutions have begun to reduce the size of their graduate programs. In particular, in the autumn of 1996, the projected size of the new class of PhD students in mathematics at US universities was 2,384 compared with 2,546 in the autumn of 1994. Figure 8 shows the total population of full-time doctoral students in mathematics for 1980, 1985, and the 1990s. Since a high in 1992, the number of full-time PhD students in mathematics has steadily decreased.
An online NSF data brief of February 1997 (NSF 1997a) reveals that, among all US doctoral students in the sciences, the largest percentage from 1994 to 1995 occurred in the mathematical sciences and physics, each of which experienced a 6% reduction.
The decreases in applications by both US and non-US students are dramatic, although it is unknown whether they signal the beginning of a trend. Interest in obtaining a PhD in mathematics appears to have been affected by the employment prospects described in section 5.3 for both US and non-US students. A very recent set of data (AMS 1997a, b) collected in mid-1996 shows that there has been a uniform drop in applications to mathematics graduate schools from 1994. Table 1 shows data on the 48 top-ranked mathematics departments and on all doctoral programs in mathematics. Other reasons for the decline might be competition from computer science, biologic science, and medicine and poor preparation in high school and college.
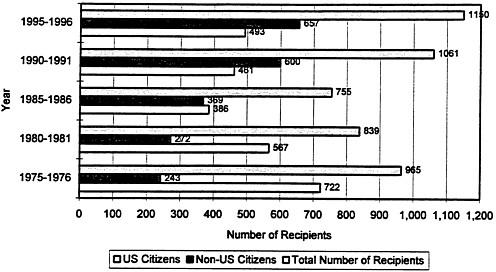
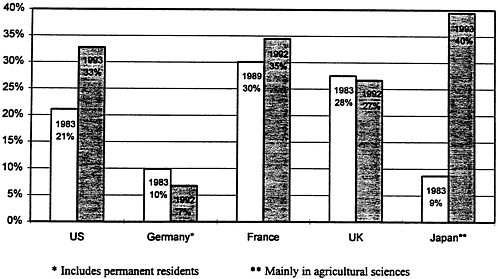
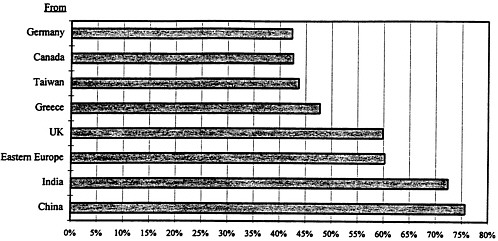

Table 1: Decrease in applications to PhD programs in mathematics, 1994 to 1996
|
Top-Ranked Departments |
All Departments |
|
|
Total pool, 1996 |
7,366 |
16,516 |
|
Total pool, 1994 |
10,320 |
23,545 |
|
Percentage Decrease, 1994 to 1996 |
29% |
30% |
|
US pool, 1996 |
3,108 |
6,291 |
|
US pool, 1994 |
4,769 |
9,270 |
|
Percentage decrease, 1994 to 1996 |
35% |
32% |
|
International pool, 1996 |
4,295 |
10,387 |
|
International pool, 1994 |
5,498 |
14,537 |
|
Percentage decrease, 1994 to 1996 |
22% |
29% |
|
Source: AMS 1997a, pp. 213-216. Note: The total pool may not equal the sum of the US pool and the international pool. Since some departments were unable to provide numbers of applications broken out by citizenship or visa status, the projections may be based on slightly different sets of respondents. Top-ranked departments are those offering the PhD and which have high "scholarly quality of program faculty" as reported in the 1995 National Research Council report Research-Doctorate Programs in the United States: Continuity and Change (NRC 1995d). There are 48 top-ranked departments. |
||
Another issue is the degree to which women and members of minority groups are pursuing graduate degrees in mathematics. From 1983 to 1993, the percentage of new PhDs who were women grew from 16.1% to 23%; this is slightly greater than the percentage for all the physical sciences and computer science. The percentage of minority-group members receiving mathematics PhDs is much smaller. For example, only 8 of some 583 mathematics PhDs awarded to Americans went to blacks in 1993, and this number has remained roughly constant over the last decade. The situation for Hispanic Americans is a bit different: 16 received degrees (NSF 1996b).
No data were found on the size of graduate mathematics programs in other countries.
5.6. Support
In section 4.4. we stated that an important underpinning for US success in mathematical research has been sustained support and funding. Before choosing to obtain a PhD in mathematics, the most-talented people are likely to consider not simply their expected salary, but also their likelihood of receiving support for the time and resources needed to carry out their research.
Figure 9 compares the 1993 median salaries of US PhDs who received their degrees in 1985-1990 in mathematics, computer science, chemistry, physics/astronomy, and electrical engineering. One might reasonably conclude that mathematics PhDs have less-favorable salary
prospects than other science PhDs. We have no comparable data for other countries.
It is difficult to make international comparisons with respect to salaries and federal support because university researchers in other countries do not typically receive summer salary support from individual government grants. In the UK and Canada, for example, academic salaries are paid entirely by universities.
As to federal research support, figure 10 shows that a lower percentage of academic mathematicians received US federal support in 1993 than any other category of doctoral scientists except social scientists.
Finally, the mathematical sciences have not fared well, compared with other sciences, in overall federal support in recent years (see figure 11). For example, in 1994-1995, overall federal support for academic research and development grew by 5%, but support for the mathematical sciences dropped relative to that for other sciences. Mathematics had the lowest rate of growth (1%) in federal funding for research and was the only science whose support grew at a rate lower than that of inflation, which was 1.8% (NSF 1997b).
The details of the picture vary by agency. On the basis of current dollars in the actual FY1996 and estimated FY1997 budgets, the Division of Mathematical Sciences at the National Science Foundation experienced growth of 7.1% overall Department of Defense spending on mathematical sciences decreased by 12.3% and overall Department of Energy spending on mathematical sciences remained flat.
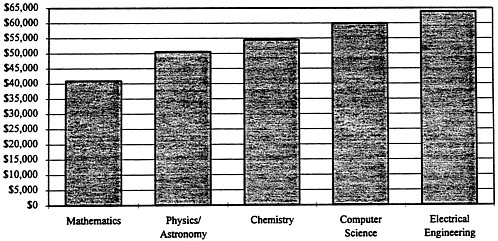
Figure 9: Median salaries in 1993 of US PhDs who received their degrees in 1985-1990, by field
Source: NSF 1996a, appendix table 5-27.


