
3
ACADEMIC EMPLOYMENT OF HUMANISTS
As the academic sector5 is the most common employer of humanities doctorates, the following characteristics of those academically employed are described below: academic rank, tenure status, and primary work activity. These characteristics are then examined by field of doctorate, gender, and years since award of doctorate.
Academic Rank
The majority of humanities doctorates employed in the academic sector, both overall and within each field, held faculty positions6 in 1991 (see Table 16). The distribution among the faculty ranks varied considerably across fields: the percentage of full professors ranged from a high of 50.1 percent in “other history” to a low of 22.3 percent in art history; over 31 percent of the doctorates in art history and modern languages and literature were associate professors compared with 20.2 percent of those in “other history”; and approximately 23 percent of doctorates in art history and “other humanities” were assistant professors compared with only 12.3 percent of those in “other history.”
Gender and Years Since Award of Doctorate
Table 17 shows the academic rank of humanities doctorates by gender and years since award of doctorate. Men were much more likely than women to be full professors (45.2 percent, compared with 21.7 percent, respectively); the percentages of men and women who were associate professors were approximately the same; and the lower-ranking positions of assistant professor, instructor, and lecturer had higher concentrations of women (see Figure 6). Men were more likely than women to be full professors, even when years since award of doctorate were taken into account. The distribution across academic ranks of men and women was most similar for the newest group.
Tenure Status
In 1991, 61.5 percent of humanities doctorates in academe were tenured. As shown in Table 18, the proportion was highest for doctorates in “other history” and
|
5 |
The academic sector includes 2-year and 4-year colleges, universities, and medical schools. |
|
6 |
For this report, faculty positions are defined to include the ranks of professor, associate professor, assistant professor, and instructor. |
TABLE 16 Academically Employed Humanities Ph.D.s, by Academic Rank and Field of Doctorate, 1991 (in percent)
|
Academic Rank |
All Fields |
Amer Hist |
“Other Hist” |
Art Hist |
Music |
Speech/ Theater |
Phil |
Engl/Amer Lang/Lit |
Class Lang/Lit |
Modern Lang/Lit |
“Other Hum” |
|
Total Employed* (No.) |
64,100 |
3,900 |
9,400 |
2,000 |
5,300 |
3,200 |
5,100 |
17,500 |
1,400 |
10,300 |
5,800 |
|
Faculty |
84.2 |
86.7 |
83.3 |
76.9 |
86.3 |
87.2 |
87.8 |
82.8 |
86.7 |
86.5 |
79.3 |
|
Professor |
37.7 |
41.9 |
50.1 |
22.3 |
36.3 |
44.5 |
37.1 |
37.9 |
46.8 |
31.2 |
26.8 |
|
Associate Professor |
26.5 |
27.8 |
20.2 |
31.2 |
28.8 |
27.6 |
27.5 |
25.3 |
21.7 |
31.5 |
26.7 |
|
Assistant Professor |
17.7 |
14.1 |
12.3 |
23.0 |
19.3 |
13.9 |
21.6 |
15.6 |
17.2 |
22.0 |
23.3 |
|
Instructor |
2.3 |
2.9 |
0.7 |
0.4 |
1.9 |
1.2 |
1.6 |
4.1 |
1.0 |
1.8 |
2.4 |
|
Lecturer |
2.5 |
1.0 |
2.2 |
1.8 |
2.7 |
1.2 |
1.2 |
2.7 |
0.2 |
3.8 |
4.0 |
|
Adjunct |
3.6 |
2.5 |
3.9 |
8.1 |
3.1 |
1.3 |
3.2 |
4.3 |
5.5 |
2.9 |
3.3 |
|
Other Faculty |
1.9 |
2.6 |
1.4 |
0.8 |
1.8 |
1.5 |
1.5 |
2.3 |
2.9 |
2.0 |
1.5 |
|
Does Not Apply |
4.1 |
5.4 |
5.3 |
3.1 |
4.2 |
4.2 |
3.1 |
4.4 |
1.5 |
2.1 |
5.7 |
|
Postdoctoral Appointment |
0.5 |
0.0 |
0.6 |
1.8 |
0.5 |
0.1 |
0.0 |
0.3 |
0.0 |
0.3 |
1.7 |
|
No Report |
3.2 |
1.8 |
3.2 |
7.6 |
1.6 |
4.6 |
3.1 |
3.4 |
3.2 |
2.3 |
4.5 |
|
NOTE: Numbers are rounded to the nearest hundred; therefore, subcategories may not add to total. |
|||||||||||
TABLE 17 Academically Employed Humanities Ph.D.s, by Academic Rank, Years Since Award of Doctorate, and Gender, 1991 (in percent)
|
Total |
5 or Fewer Years |
6-15 Years |
16-35 Years |
|||||
|
Academic Rank |
Male |
Female |
Male |
Female |
Male |
Female |
Male |
Female |
|
Total Employed* (No.) |
43,600 |
20,400 |
6,200 |
5,400 |
13,300 |
8,800 |
23,200 |
6,200 |
|
Faculty |
87.4 |
77.4 |
88.5 |
77.6 |
82.1 |
77.4 |
91.0 |
77.5 |
|
Professor |
45.2 |
21.7 |
5.1 |
1.8 |
27.1 |
14.1 |
65.6 |
49.5 |
|
Associate Professor |
26.2 |
27.1 |
16.7 |
13.4 |
39.6 |
39.9 |
22.2 |
21.1 |
|
Assistant Professor |
14.3 |
25.0 |
63.5 |
57.3 |
13.1 |
19.9 |
2.3 |
4.3 |
|
Instructor |
1.7 |
3.6 |
3.2 |
5.2 |
2.4 |
3.4 |
0.9 |
2.5 |
|
Lecturer |
1.5 |
4.7 |
1.4 |
5.2 |
2.7 |
4.8 |
0.5 |
3.9 |
|
Adjunct |
2.1 |
6.8 |
2.3 |
9.0 |
3.3 |
6.4 |
0.9 |
5.4 |
|
Other Faculty |
1.8 |
2.1 |
1.7 |
1.1 |
2.0 |
2.1 |
1.6 |
2.9 |
|
Does Not Apply |
3.7 |
5.0 |
2.9 |
4.4 |
6.3 |
4.6 |
2.5 |
6.3 |
|
Postdoctoral Appointment |
0.3 |
0.9 |
0.7 |
0.9 |
0.2 |
1.3 |
0.1 |
0.2 |
|
No Report |
3.2 |
3.1 |
2.5 |
1.8 |
3.3 |
3.4 |
3.3 |
4.0 |
|
NOTE: Those with more than 35 years since doctorate are not shown because of their small numbers; therefore, subcategories may not add to total. *Includes those employed full-time or part-time and postdoctoral appointees. |
||||||||
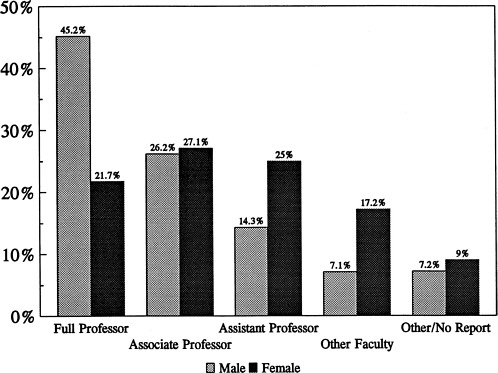
Figure 6. Faculty rank of academically employed doctorates, by gender, 1991.
speech/theater (66.7 and 66.3 percent, respectively) and lowest for those in art history and “other humanities” (50.7 and 49.2 percent, respectively). Doctorates in classical languages and literature had the highest proportion in nontenure-track positions, 14.8 percent, compared with 7.3 percent of humanities doctorates overall.
Gender and Years Since Award of Doctorate
As with faculty rank, disparities by gender are evident in the tenure status of humanities doctorates (Table 19). While 68.9 percent of academically employed men were tenured, the comparable figure for women was 49.6 percent. Women were also more likely to be in nontenure-track positions (13.5 percent, compared with 4.3 percent for men) and to hold positions where tenure status was not applicable (15.0 percent, compared with 9.4 percent for men). Regardless of group, men were more likely than women to be tenured; the differences were greatest for those from the oldest group and smallest in the newest group.
TABLE 18 Academically Employed Humanities Ph.D.s, by Tenure Status and Field of Doctorate, 1991 (in percent)
|
Tenure Status |
All Fields |
Amer Hist |
“Other Hist” |
Art Hist |
Music |
Speech/Theater |
Phil |
Engl/ Amer Lang/ Lit |
Class Lang/ Lit |
Modern Lang/ Lit |
“Other Hum” |
|
Total Employed* (No.) |
64,100 |
3,900 |
9,400 |
2,000 |
5,300 |
3,200 |
5,100 |
17,500 |
1,400 |
10,300 |
5,800 |
|
Tenured |
61.5 |
62.8 |
66.7 |
50.7 |
61.4 |
66.3 |
64.2 |
62.2 |
59.2 |
62.0 |
49.2 |
|
Not Tenured |
34.4 |
35.4 |
29.2 |
39.7 |
36.4 |
29.1 |
31.7 |
33.7 |
37.7 |
34.5 |
44.8 |
|
Tenure Track |
15.9 |
15.5 |
11.9 |
21.0 |
20.1 |
16.9 |
17.5 |
13.7 |
11.9 |
17.5 |
20.2 |
|
Nontenure Track |
7.3 |
4.6 |
5.5 |
9.3 |
6.0 |
4.3 |
6.8 |
7.2 |
14.8 |
7.6 |
12.0 |
|
Tenure Not Applicable |
11.2 |
15.3 |
11.7 |
9.4 |
10.4 |
7.9 |
7.4 |
12.8 |
11.0 |
9.5 |
12.6 |
|
No Report |
4.1 |
1.8 |
4.1 |
9.6 |
2.2 |
4.6 |
4.0 |
4.1 |
3.2 |
3.5 |
6.0 |
|
NOTE: Numbers are rounded to the nearest hundred; therefore, subcategories may not add to total. *Includes those employed full-time or part-time and postdoctoral appointees. |
|||||||||||
TABLE 19 Academically Employed Humanities Ph.D.s, by Tenure Status, Years Since Award of Doctorate, and Gender, 1991 (in percent)
|
Total |
5 or Fewer Years |
6-15 Years |
16-35 Years |
|||||
|
Tenure |
Male |
Female |
Male |
Female |
Male |
Female |
Male |
Female |
|
Total Employed* (No.) |
43,600 |
20,400 |
6,200 |
5,400 |
13,300 |
8,800 |
23,200 |
6,200 |
|
Tenured |
68.9 |
45.8 |
16.2 |
12.6 |
63.9 |
50.9 |
86.2 |
67.9 |
|
Not Tenured |
27.3 |
49.6 |
80.2 |
83.7 |
32.5 |
43.8 |
10.1 |
27.8 |
|
Tenure Track |
13.5 |
21.1 |
58.1 |
49.0 |
14.0 |
15.9 |
1.8 |
4.4 |
|
Nontenure Track |
4.3 |
13.5 |
12.1 |
19.5 |
5.9 |
14.7 |
1.2 |
6.8 |
|
Tenure Not Applicable |
9.4 |
15.0 |
10.0 |
15.2 |
12.7 |
13.2 |
7.2 |
16.6 |
|
No Report |
3.8 |
4.5 |
3.6 |
3.7 |
3.6 |
5.3 |
3.7 |
4.2 |
|
NOTE: Those with more than 35 years since doctorate are not shown because of their small numbers; therefore, subcategories may not add to total. *Includes those employed full-time or part-time and postdoctoral appointees. |
||||||||
Primary Work Activity
Teaching was the primary work activity of 76.5 percent of humanities doctorates employed in the academic sector (see Table 20), followed by management and administration (11.0 percent), and research and development (5.1 percent). There was some variation in the distribution of work activities across fields: 15.2 percent of the speech/theater doctorates were primarily engaged in management and administration, compared with approximately 6 percent of those in classical languages and literature and art history; between 10 and 11 percent of doctorates in philosophy and “other humanities” were primarily engaged in research and development, compared with only 1.0 percent of the music doctorates.
Gender and Years Since Award of Doctorate
While gender differences have been noted in both the academic positions and tenure status of academically employed humanities doctorates, the distribution of primary work activities was similar for men and women in academe (see Table 21) even when years since award of doctorate are taken into account.
Number of Publications
In 1991, respondents were asked how many publications they had published or had accepted for publication in the past 2 years. “Publications ” were defined as books or monographs (as an author, coauthor, editor, or coeditor), chapters in scholarly books, articles in refereed journals, book reviews in refereed journals, and articles in newspapers or magazines. Table 22 shows that the mean number of publications for those employed in academe was 4.2. (This compares to 2.5 for those employed in business/industry, 2.7 for those employed in nonprofit organizations, and 2.1 for those employed in government.) By field, academically employed doctorates in American history had the highest mean number of publications, 6.1, while doctorates in music and speech/theater had the lowest (2.1 and 3.6, respectively). The latter finding is not surprising, because doctorates in these fields are more likely to produce other types of creative and scholarly works such as exhibitions or performances in the fine or applied arts.
Those with tenure had the highest mean number of publications, 4.6, followed by those not tenured, but in a tenure track, 4.3. Those not in a tenure track position had a mean number of publications of 3.3.
TABLE 20 Academically Employed Humanities Ph.D.s, by Primary Work Activity and Field of Doctorate, 1991 (in percent)
|
Primary Work Activity |
All Fields |
Amer Hist |
“Other Hist” |
Art Hist |
Music |
Speech/ Theater |
Phil |
Engl/Amer Lang/Lit |
Class Lang/Lit |
Modern Lang/Lit |
“Other Hum” |
|
Total Employed* (No.) |
64,100 |
3,900 |
9,400 |
2,000 |
5,300 |
3,200 |
5,100 |
17,500 |
1,400 |
10,300 |
5,800 |
|
Teaching |
76.5 |
72.2 |
73.3 |
79.8 |
81.7 |
77.8 |
76.7 |
75.3 |
77.1 |
80.6 |
74.1 |
|
Management/Administration |
11.0 |
14.0 |
11.0 |
6.2 |
9.9 |
15.2 |
6.7 |
12.7 |
5.9 |
9.6 |
11.8 |
|
Research & Development |
5.1 |
4.8 |
6.0 |
5.8 |
1.0 |
3.6 |
10.1 |
3.0 |
3.6 |
5.0 |
10.7 |
|
Writing/Editing |
2.9 |
2.9 |
4.0 |
1.6 |
0.2 |
0.4 |
3.8 |
4.2 |
6.9 |
2.0 |
1.1 |
|
Other Activities |
3.0 |
2.9 |
3.7 |
2.2 |
7.2 |
2.3 |
1.2 |
3.4 |
5.7 |
1.0 |
2.0 |
|
No Report |
1.5 |
3.2 |
2.0 |
4.5 |
0.0 |
0.7 |
1.5 |
1.5 |
0.9 |
1.7 |
0.3 |
|
NOTE: Numbers are rounded to the nearest hundred; therefore, subcategories may not add to total. *Includes those employed full-time or part-time and postdoctoral appointees. |
|||||||||||
TABLE 21 Academically Employed Humanities Ph.D.s, by Primary Work Activity, Years Since Award of Doctorate, and Gender, 1991 (in percent)
|
Total |
5 or Fewer Years |
6-15 Years |
16-35 Years |
|||||
|
Primary Work Activity |
Male |
Female |
Male |
Female |
Male |
Female |
Male |
Female |
|
Total Employed* (No.) |
43,600 |
20,400 |
6,200 |
5,400 |
13,300 |
8,800 |
23,200 |
6,200 |
|
Teaching |
76.7 |
76.1 |
83.3 |
79.6 |
77.3 |
76.5 |
74.4 |
72.3 |
|
Management |
10.5 |
12.0 |
3.3 |
6.5 |
11.4 |
12.9 |
12.1 |
15.6 |
|
Research & Development |
5.2 |
5.0 |
7.4 |
8.1 |
4.7 |
4.4 |
4.8 |
3.0 |
|
Writing/Editing |
2.8 |
3.0 |
2.2 |
2.7 |
2.3 |
2.4 |
3.2 |
4.3 |
|
Other Activities |
3.1 |
2.7 |
3.6 |
2.4 |
3.0 |
2.9 |
3.0 |
2.8 |
|
No Report |
1.7 |
1.2 |
0.1 |
0.8 |
1.2 |
0.9 |
2.5 |
2.0 |
|
NOTE: Those with more than 35 years since doctorate are not shown because of their small numbers; therefore, subcategories may not add to total. *Includes those employed full-time or part-time and postdoctoral appointees. |
||||||||
TABLE 22 Publications of Humanities Ph.D.s Employed in Academe, by Field of Doctorate and Tenure Status, 1991 (in percent)
|
Number of Publications |
||||||
|
Field of Doctorate and Tenure Status |
Total* (No.) |
None |
1-2 |
3-5 |
More Than 5 |
Mean |
|
Total |
60,000 |
31.2 |
21.7 |
22.7 |
24.4 |
4.2 |
|
Field of Doctorate |
||||||
|
American History |
3,800 |
20.4 |
20.1 |
25.4 |
34.1 |
6.1 |
|
Other History |
9,200 |
26.3 |
19.5 |
24.7 |
29.4 |
5.0 |
|
Art History |
1,900 |
15.4 |
32.2 |
29.0 |
23.4 |
4.0 |
|
Music |
5,000 |
61.0 |
16.4 |
10.5 |
12.1 |
2.1 |
|
Speech/Theater |
3,100 |
43.3 |
20.1 |
18.1 |
18.5 |
3.6 |
|
Philosophy |
4,900 |
26.6 |
22.7 |
23.6 |
27.1 |
4.2 |
|
English and Amer Lang/Lit |
17,000 |
33.2 |
24.9 |
21.8 |
20.1 |
3.8 |
|
Classical Lang/Lit |
1,300 |
29.7 |
20.5 |
28.1 |
21.8 |
3.5 |
|
Modern Lang/Lit |
9,900 |
26.8 |
20.3 |
24.8 |
28.1 |
4.6 |
|
Other Humanities |
3,900 |
21.5 |
19.9 |
27.6 |
30.9 |
4.9 |
|
Tenure Status† |
||||||
|
Tenured |
37,300 |
28.7 |
21.0 |
23.4 |
26.9 |
4.6 |
|
Not Tenured |
20,700 |
35.3 |
22.7 |
21.7 |
20.2 |
3.6 |
|
Tenure Track |
9,600 |
21.0 |
23.4 |
29.6 |
26.0 |
4.3 |
|
Nontenure Track |
4,200 |
40.3 |
24.8 |
20.4 |
14.5 |
3.3 |
|
Tenure Not Applicable |
6,900 |
52.3 |
20.4 |
11.6 |
15.7 |
2.7 |
|
*Totals in this table are equal to the number answering the question on publications, not the total sample, and may therefore disagree with totals shown elsewhere in the report. †Subcategories do not add to total because no reports are not shown. |
||||||


