
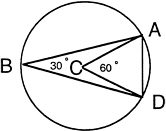
FIGURE 10 Delaunay triangulation result.
see this, examine Figure 10. If the radius of the circle is one and the distance A to D is one, the angle ACD is 60°, and thus angle ABD is 30°. If the radius of the circle is less than one (it cannot be greater), then angles ACD and ABD are larger. Similarly, if the distance A to D is greater than one (it cannot be less), then angles ACD and ABD are again larger. Therefore, no Delaunay triangulation can have an angle less than 30°. Since the three angles of a triangle sum to 180°, no angle can be greater than 120°. Thus, there is an algorithm for triangulation with a guarantee on the shape of the triangles. More sophisticated versions of the algorithm allow one to vary the size of the triangles to get higher accuracy in regions of interest.
At present there is no known method for partitioning a three-dimensional region into tetrahedra that has provable lower bounds on the size of the dihedral angles. Today this is an important research problem.
INFORMATION CAPTURE AND ACCESS
In the second portion of this lecture, I explore the science base that needs to be created to support the emerging technology for information capture and access. But first I would like to make a personal observation on contributions to science. I believe that the most fundamental contributions are not the theorems or solutions to known problems but are, rather, the formulations of the correct questions to ask. Once the correct questions are posed, it is usually not too long until answers emerge. It is the formulating of the questions that shapes a new discipline. In the area of information capture and access, we are still grappling with an attempt to formulate the correct questions.
Let me proceed by telling an apocryphal story. I call it the bus stop story. The story is about myself, a faculty member at Cornell University. Cornell is located in a small town called Ithaca, in upstate New York. The temperature in the winter drops below freezing. Although I live within walking distance, on winter evenings I go to the bus stop and ride the bus home. The last bus passes the campus stop at 6 p.m. One evening I arrived at the bus stop at 5:57 and waited 10 minutes. There was no bus. What should I do? Do I assume that the bus is delayed and wait? Or is it possible that the bus was a few minutes early and I had better start walking home? Before answering the question, consider more technology.
Modern computing and communication technology is sufficient to determine the location of a vehicle with sufficient accuracy to record its location on a street map. One such technology is based on an accurate time signal from a satellite. In fact boaters and hikers already use this technology to determine their location. Imagine a time in the not-far-distant future when use of this technology is common practice and taxi, delivery, and emergency services routinely track and dispatch their vehicles with it.
Imagine, also, that personal workstations have shrunk to the size of pocket calculators and that they are equipped with cellular communication. In this situation, I pull out my portable communication workstation and connect to the bus company's database, locate the current position of the bus, and discover that it is currently rounding the bend on Stewart Avenue. If I am patient for a few more minutes, I can ride the bus home. Note that in this transaction, I needed to pull my gloves off to key in a series
of commands. With my fingers exposed to the freezing weather, I will not be extremely happy if I receive an error message, “Invalid command, core dumped.” In fact, if I even need to know how to program to accomplish this task, so few people will make use of the service that it will not be justifiable. Furthermore, note that I need to establish a connection to the bus company's database, not even knowing the name of the bus company.
The bus stop story is a generic example of how access to information can help us. The same situation occurs when one is driving to an airport and the weather is poor. Being able to access the airline database tells you how to rearrange your travel plans in the event that your flight is delayed.
The cellular communication that makes these events possible allows all kinds of improved services. Instead of checking in at the hotel desk, you should be able to walk in the door and have the hotel' s communication system interrogate your portable cellular workstation, discover you have arrived, check you in, and download your room number and an electronic password that will allow your workstation to electronically unlock your hotel room door when you approach. Similarly, there would be no need to wait in line at the front desk for checkout. When you leave the hotel for your return home, you just press the appropriate key on the workstation, examine your bill on the screen, and walk out the door. All paper work is completed, including your expense report, with no human action necessary.
What we are concerned with today is the science base that we need to develop to make these ideas become a reality. To explore what that science consists of, let us consider how each of the following questions might be answered:
-
What are the top 10 computer science departments in the United States?
-
Why was a specific engineering change made in a project?
-
How did a particular scientific field develop?
To determine the top 10 computer science departments in the country, we need to define a metric. One might rank the departments by the amount of research funding, the number of faculty who have Presidential Young Investigator awards or are members of the National Academy, or the number of citations to publications by the institution's faculty. Each of these metrics can be calculated by a computer. For example, take research funding. The National Science Foundation maintains an externally readable database of its publications in digital form. All one needs is access to Internet, and he or she can remotely log in to stis@nsf.gov. One of the documents in this database is the summary of awards. One can bring this document to his or her home workstation and proceed to analyze it. Its format is a series of blocks, each block consisting of three header lines followed by a paragraph of text describing the research. The header information contains the institution and the amount and the duration of the grant. By developing a grammar for the document, one can then locate the fields containing the desired information and extract the information into a standard database. Having done that, one can then enter a standard database query, asking to aggregate funding by institution, and then rank the results. This experiment was actually carried out, in a semi-automatic way, by Jim Davis of Xerox Corporation, although he used an ad hoc technique instead of developing a grammar for the document. A word of caution: the top 10 institutions by funding had, in my opinion, little correlation to the top 10 institutions as perceived by researchers in the field of computer science.
To answer the second question, assume that a company keeps its engineering drawings in digital form and records who accesses them. Looking simply at who made changes in the drawings might indicate that a draftsperson had made them rather than the engineer who conceptually understood the change and the rationale for it. However, if a system log was kept, one could analyze the electronic mail traffic starting with the person who actually made the change to the documents, examine job descriptions to eliminate clerical workers, and make a list of probable candidates to call.
To answer the third question, one might examine the Science Citation Index. Given a few papers that are representative of a field, one could construct a graph whose vertices are scientific papers with an edge
from paper A to paper B, indicating that paper B references paper A. In constructing the graph, a check must be done to ensure that the content of each paper added to the graph is similar to that of the original papers. Otherwise, the graph probably would expand to the entire corpus of literature encompassing all fields of science. One technique for comparison would be to form a vector by sorting all words in a document and recording the number of occurrences of each word in a component of a vector. A document is considered similar to one of the original documents if its dot product is large.
Once the graph has been constructed, key documents in the development of a field are indicated by a high out degree. One can examine the authors of key documents to find researchers who appear frequently as author.
Similarly, one can examine the location of authors of papers to see if there are institutions that are influential in creating publications.
What is the science base that is necessary to support these activities? There is a wide range of items. One needs means for identifying and finding information sources; one needs tools to extract information; and so on. Let us consider one area: analyzing the syntactic structure of text. Consider the example of constructing a database from a document. To do this effectively, one must be able to recognize the structure of a document. A fair amount of research in linguistics and artificial intelligence has been devoted to semantic understanding of text The difficulty here seems to be that each subfield or application has a fair amount of domain knowledge. If one is working ia a narrow, well-structured domain, then this presents no problem. However, for general areas, the union of domain knowledge is too extensive, and I have seen little work in how to cope with it.
However, one can extract a large amount of the syntactic structure of a document simply by looking at blank space. Figure 11 is a document with each nonblank character replaced by a dash. Simply by looking at the dashes, one can make a reasonable guess as to the document's structure. For example, in Figure 11 the top line is probably a title. A good guess for the next two centered lines is an author and an institution. Then comes a paragraph followed by a second paragraph with some indented text. The indented text probably contains three items. The left justified line on the second page, following the blank line, is probably a section heading. After the next paragraph is a table, and the line immediately below is probably a table heading. One could write a program to summarize such a document that prints the title, author, and institution along with section headings. This example should illustrate how much information is available just from the syntactic structure of nonblank space.
The existence of embedded blank space is a powerful concept. Think of a line of text as potentially having four types of blank space. The first type is the initial blank space that occurs in the first line of a paragraph where it is indented, or an indented paragraph, a centered heading, an outline, or a computer code, and so on. Final blank space, a second type, occurs where a line terminates before the right margin. This often occurs at the final line of a paragraph, a centered heading, or table. A third type of blank is the blank separating words in a sentence or the double blank following a period at the end of a sentence prior to the start of a new sentence. The fourth type of blank, called embedded blank space, consists of two or more blanks separating nonblank characters. Exactly two blanks following a period and preceding a capitalized letter is not counted as embedded blank space. Embedded blank space in a line is a good indicator that a table might be present. If analysis of successive lines also indicates embedded blank space and the embedded blank space is aligned, then one has strong evidence of a table and may wish to convert the table to a database where standard queries may be made. The situation is, of course, far more complicated, since a page may have a two-column format and not be a table at all. Also, tables may be compressed with no embedded blanks but rather special characters separating column entries. Nevertheless, a formal syntax would be useful.
Just as one can examine blank space at the character level, so can one examine blank space at the pixel level. Here work by Bellcore indicates that a histogram of the number of nonblank pixels for each pixel row allows one to locate lines of text and also to distinguish between English text and mathematical equations. A histogram for English text has three peaks corresponding to the top, bottom, and center of
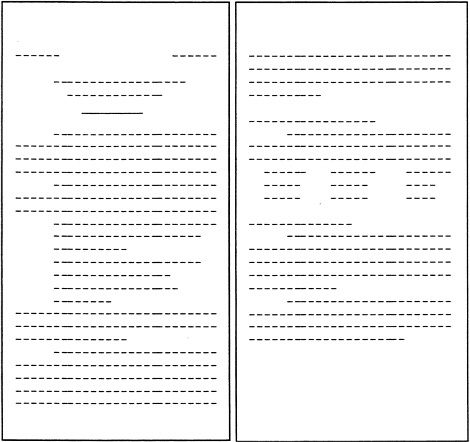
FIGURE 11 Blank document.
characters. For a mathematical equation, the presence of subscripts and superscripts generates additional small peaks. A theory of blank space in lines and documents would aid in building tools for accessing text.
Why is it important to analyze text automatically? There are many reasons. As has already been mentioned, allowing standard database queries of English text documents in the case where the document has tables is one reason. Another reason involves automatic indexing. Consider WAIS, a tool created by Apple Computer, Dow Jones, Thinking Machines, and Dunn and Bradstreet for locating information from wire services and other text sources (Kahle, 1989). Intuitively, WAIS operates by taking a document, sorting the words, and creating a vector whose components indicate the number of occurrences of various words in the document. One retrieves a document by providing a set of keywords. The keywords are used to form a search vector. The dot product of the search vector is computed with each vector representing a document in the collection. (This is basically the SMART technology (Salton, 1991). A short list of documents with the highest dot products is produced. The documents can then be displayed.


